26 minute read
Remotely Sensed Data to Increase the Effi ciency of Data Collection


A Closer look At ImpACt from HIgH Above tHe eArtH
Remotely Sensed Data to Increase the Efficiency of Data Collection
Rigorous evaluation of the outcomes of international development programmes and interventions has been a perennial challenge across multiple sectors and disciplines. Because of their ability to determine intervention effectiveness (and cost effectiveness), the demand for and production of impact evaluations (IEs) has grown substantially in recent decades, and they have been evolving to fill a critical gap in evidence. Remotely sensed data allows IEs to be improved in multiple ways, increasing their timeliness, accuracy and relevance for decision-makers. This article outlines how 3ie and New Light Technologies aim to enhance the generation, use and transparency of geospatial analysis in IEs.
Given the importance of international development to promote social, health, economic and environmental well-being and equity around the world, combined with the magnitude of investments in such efforts, it is essential to know whether or not such efforts are actually achieving the targeted outcomes for the beneficiary population. Making this determination is often far from straightforward, in part because it requires isolating and estimating the effect attributable to the programme or intervention, as compared to what would have otherwise happened for the same population in the absence of the intervention.
The criTical role of impacT evaluaTions
The field of impact evaluation has emerged and evolved over the past several decades to address this challenge and the associated gap in rigorous evidence on the effectiveness of development interventions. Study designs used to quantify attributable effects are typically experimental (which use random assignment to establish control groups) or quasi-experimental (which use statistical procedures to identify comparison groups to construct a valid counterfactual), often incorporating qualitative evidence as part of a mixed-methods approach.
Because of their ability to determine intervention effectiveness (and costeffectiveness), the demand for and production of IEs has grown substantially in recent decades. Policymakers and programme implementers increasingly seek evidence from rigorous IEs to guide investments toward interventions that are most likely to work, to produce the largest benefits, to reach the most people, and to do so at the lowest cost. At the same time, the limitations of IEs
have also come under increasing scrutiny in the development community, including for example their often substantial time and resource costs and the challenges of accounting for important but unobserved variables and phenomena that may influence the outcomes of interest in the study population.
challenGes anD limiTaTions
Impact evaluations often rely on primary data collection or existing large-scale representative survey data to construct key outcome variables and other covariates. However, when programmes are implemented at larger geographical scales than the individual or the household scale (e.g. in villages, counties, forests or for agricultural plots), conventional data collection methods may be inadequate. For example, many key outcome variables cannot be measured using conventional data collection methods (e.g. small-area economic activity) or are riddled with measurement errors (e.g. plot productivity).
Conventional data collection methods are also limited in their ability to measure a vast array of potentially critical control variables, such as the physical properties of areas where a programme is implemented (e.g. topography, land productivity, accessibility, proximity to services, etc.), which could significantly affect the impact of the programme. Furthermore, collecting several years of pre-programme baseline information or conducting follow-up surveys several years after programme implementation to measure long-term impacts is either prohibitively costly and/or not feasible. The high spatial and temporal resolution of satellite data allows the construction of multiple comparison groups to account for spillover effects and spatial heterogeneity.
In other cases, conventional survey data collection methods, such as face-to-face interviews, prove to be challenging, such as when it is necessary to reach migrant populations or populations residing in inaccessible regions. Overall, the logistical feasibility and the cost associated with the collection of conventional survey data often limits the sample size and statistical power of the analysis. When location matters for programme effect, remote sensing can add enormous value to impact measurement, especially when: 1) the programme placement has a spatial element (location/area/plots); Detection of rice fields in a satellite image.

2) the outcome of interest is spatially measurable (directly or indirectly), and; 3) information on programme placement and timing is available and can be clearly demarcated retrospectively.
availaBiliTY of airBorne GeospaTial DaTa
Until recently, the cost and availability of satellite imagery, together with the computational cost associated with data storage and analysis, have hindered the accessibility to high-quality and timely satellite data for IEs. Today, there is an exponential increase in the availability of sources that provide freely accessible and reusable satellite data. Remotely sensed observations (e.g. observations collected by satellites or airborne instruments such as unmanned aerial vehicles) offer unique possibilities for IEs, especially when high-quality and reliable data is in short supply.
With the increasing availability, quality, granularity and frequency of satellite data, it is now possible to collect data from almost every location on Earth. According to the USA’s Union of Concerned Scientists (UCS), more than 2,600 satellites currently orbit Earth, with close to 40% of them collecting data specifically for Earth and space observations and for scientific applications. For example, NASA’s/USGS’s Landsat programme has been collecting data since the 1970s, making these observations the longest continuous spacebased record of Earth. Between them, the two current operating Landsat satellites (Landsat 7 and 8, which were launched in 1999 and 2013, respectively) capture every location on Earth every eight days in a spatial resolution of 30m. Since 2014, the European Space Agency (ESA) Sentinel mission has been providing a wide range of publicly available Earth observation data, including synthetic aperture radar (SAR) and electro-optical (EO) recordings. Sentinel-2, for example, provides observations of every location on Earth at a temporal frequency of up to every five days in a spatial resolution of 10m. This is compared to NASA’s MODIS instrument, which provides almost daily images of Earth, but in a coarser spatial resolution (down to 1km).
With terabytes of data collected by multiple sources every day, it is essential to rethink the way all this data is managed, stored and analysed. Personal computers are no longer able to process this vast amount of data. On the other hand, cloud-based computational platforms (such as Google Earth Engine, AWS, Azure and more) now allow researchers to scale up the analysis across space and time. Parallel computing and cloud storage optimize the way the data is stored, managed and processed. With the decreasing cost of such cloud-based platforms (some of which are free for non-commercial use), it is now feasible to perform impact evaluation on scales that were until recently impossible. These recent technological advancements enable rapid and scalable conversion of the vast amount of remotely sensed data into meaningful information related to economic activity, distribution of the population groups, the characteristics of land cover and land use, availability of surface water, food security, land productivity, cropping intensity and more.
improvinG impacT evaluaTion
Remote sensing enables researchers to better meet the needs of policymakers by measuring outcomes and constructing comparison groups in ways that until recently were not possible. It strengthens the analysis, for example, through controlling for confounders and pre-programme trends, and makes the evaluations more feasible, for example, due to the reduction of data collection costs and more cost-effective retrospective and remote analysis.
1. Measuring the unmeasurable • Measuring outcomes: Outcomes such as economic growth, GDP, poverty or wealth at the sub-national level, infrastructure quality, population distribution, etc., are difficult to measure accurately and/or at a required temporal and spatial scale using conventional data collection methods. Remotely sensed nighttime light data may serve as a proxy for these outcomes. For example, humangenerated light at night is used as a proxy for local area economic activity. • Constructing the comparison group: Remotely sensed data enables the matching of comparison units based on relevant pre-programme characteristics at the appropriate unit level or based on spatial discontinuity. A common method for identifying comparison groups is to perform pipeline or sequential allocation, where untreated segments function as a comparison group until they are treated; a regression discontinuity design includes units within a specified cut-off (e.g. within a given radius around the programme), thus creating a comparison group from a pre-specified contiguous space. The fact that satellite data covers all areas and is always ‘on’ (both temporally and spatially) also means that it is not susceptible to self-selection bias like other sources of big data (e.g. call detail records,
Band combination techniques can be used to highlight green vegetation in a satellite image.

interest-based online searches, social media data, etc.). • Long-term impact: Collecting several years of pre- and post-programme data through a face-to-face survey is expensive and, in many cases, not feasible. The possibility to collect pre- and post-programme data, and especially the follow-up data, without the need for going to the field enables measurement of the long-term programme impact, and can help analyse how the impacts evolve over time and how long they last.
2. Overcoming analytical challenges • Assessing pre-programme trends: Quasiexperimental designs require pre-programme similarity between the treatment and the control group, both in levels and distribution, potentially for several years before the programme. Historical time series of satellite data make it possible to evaluate parallel trend assumptions. • Controlling for covariates: Failing to control for confounding factors will lead to omitted variable bias. Remote sensing can help control for local-area, time-varying factors through fixed effects at the level of individual cells or pixels in aerial or satellite imagery, and for time-invariant factors, such as physical attributes, through directly measuring them. • Heterogeneous effects: IEs often measure the average treatment effect for an entire treatment group rather than heterogeneous effects for sub-groups, largely due to the unavailability of data and statistical power limitations. Remote sensing allows researchers to estimate heterogeneous effects based on observable baseline conditions such as population density at the cell level with sufficient power for sub-group analysis. • Robustness analysis: Remotely sensed data can help conduct robustness analysis by allowing for the identification of multiple comparison groups that would have been expensive or infeasible using traditional data collection methods. Similarly, placebo tests can be conducted by testing the treatment effect on the treated for an arbitrary pre-programme date. • External validity and generalizability: Remotely sensed data is available not only for the programme area, but also for the country/ regional context. However, one needs to be mindful of the challenges in generalizing it beyond the country from which the training data comes.
3. Overcoming logistical challenges • Cost of data collection: A fundamental challenge of IEs is the cost of survey data collection. For example, the average cost of a 3ie-funded multi-year, multi-round survey impact evaluation is approximately US$400,000, whereby the survey alone costs US$175,000. In comparison, the cost of a desk-based impact evaluation with free remotely sensed data would be around US$150,000. • Retrospective, desk-based evaluation: For certain types of programmes, historical time series satellite data allows retrospective assessment of interventions already implemented, and in most cases the evaluation can be implemented remotely.
KeY limiTaTions of remoTelY senseD DaTa
For some applications, such as counting the number of trees or detecting building footprints, there is a need for the highest possible spatial resolution; for other applications, the temporal or spectral resolution may prove to be more important (for example, a high spectral resolution will be necessary to automatically detect types of crop fields, and a high temporal resolution will be essential to monitor daily changes in agricultural land productivity). In general, there is an inherent trade-off between each of these characteristics. For example, high spatial resolution imagery will often have a lower spectral resolution, while high spatial resolution imagery will often be associated with a lower temporal resolution, a smaller area covered and costlier imagery.
Nonetheless, the number and types of commercial imaging satellites are continuing to increase while small and micro satellites become significantly cheaper to build and launch. Simultaneously, the cost associated with data storage, management and analysis is continuing to decrease. Despite the increasing availability and use of satellite data, there are some important considerations that must be taken into account, including cloud coverage (which may limit the collection of remotely sensed data), the revisit period of the satellites (which tends to be lower as the spatial resolution increases), sensor limitations (e.g. the failure of the Landsat-7 Scan Line Corrector (SLC) in 2003, which resulted in significant data gaps in the acquired scenes), and the need for robust and scientifically sound data cleaning and post-processing. Importantly, it is essential to take the necessary steps in order to be able to make assumptions and generalize the interpretations. For example, machine learning and artificial intelligence-based approaches are often used to convert remotely sensed data into meaningful information about the
Earth. Some of these approaches rely on supervised machine learning techniques, which require reference data for training and validation. It is important to ensure the generalization of the reference data; for example, reference data for any supervised image classification must be collected from diverse geographical regions and a wide range of examples.
From an ethical perspective, it is important to consider risks of re-identification of study subjects and infringement of privacy, particularly if/when using ultra-high-resolution images (e.g. less than 1m). In practice, these risks can be mitigated by using areas or regions as the unit of analysis or using geomasking methods to protect privacy while maintaining spatial resolution.
remoTe sensinG as a complemenT
As implied by the above considerations, remote sensing should be approached as a way to complement rather than replace conventional forms of data collection, with an emphasis on those aspects of IEs where it is most likely to add value. One initial and perhaps obvious consideration is the type of intervention and research question, as remote sensing will be much more relevant for some than others. For instance, satellite or airborne imagery of agricultural fields is likely to be more accurate, unbiased, affordable and faster for measuring crop yields than self-reports or direct observation (e.g. crop cuts). In contrast, images from above will not tell us much about interventions to improve employee productivity and satisfaction within a workplace, nor in the context of agricultural productivity will they help us understand why crop yields are changing and the underlying causal mechanisms.
A second important consideration is that there are multiple critical aspects of development research that are more difficult to do remotely. For example, meaningful and ongoing engagement with policymakers, implementers, beneficiaries, and other stakeholders is essential to ensure that an impact evaluation is responsive to local needs and policy questions. Despite the growing use of virtual meeting platforms, this is still difficult (and sometimes impossible) to do effectively from afar. An increasing emphasis on process evaluation and mixed-method impact evaluations similarly highlights the limitations of remote sensing, as satellites and airborne images do not provide qualitative information about the political, social and operational context in which an intervention is conducted or how it is understood and experienced by implementers and beneficiaries.
conclusion
Rigorous evaluation of development interventions and their outcomes has been a perennial challenge across multiple sectors and disciplines. This is due, in part, to the fact that conventional evaluation methods, such as household surveys, are typically costly, time-consuming and often unable to capture important spatial aspects of these programmes. Remotely sensed data, such as satellite and aerial imagery, can contribute significantly to increasing the efficiency of data collection for some variables and open up the possibility of accounting for others that were previously so onerous to collect or meaningfully synthesize that they were effectively ‘unmeasurable’. However, a naïve use and interpretation of this data in IEs may result in misleading conclusions. As shown in this article, a number of technical challenges – such as cloud coverage, time of data capture, data gaps due to technical glitches and data comparability – must be accounted for carefully. Furthermore, the need to validate the predictions and interpretation (e.g. by means of machine learning techniques), the continued importance of meaningful stakeholder engagement and the growing emphasis on process evaluations and mixed methods to understand implementation and context point to the complementarity between conventional surveys and remotely sensed data, rather than the latter replacing the former.
About 3Ie And nlt
the international initiative for impact evaluation (3ie) and new light technologies inc. (nlt) have partnered up to enhance the generation, use and transparency of geospatial analysis in impact evaluation, with an emphasis on informing development decisionmaking and strengthening research capacity globally, and in particular for stakeholders in low-income and middle-income countries. this comes in light of the increasing demand for geospatial analysis in impact evaluation, the rapid recent advancements in access to geospatial and remotely sensed data and the development of new methods to convert this data into information that is fundamental of ie.
About tHe AutHors
Dr francis rathinam is the associate director and practice lead for monitoring, learning and evaluation (mle) at athena infonomics. He has about 13 years of experience working with multilateral and bilateral institutions, supporting country governments and think tanks on various aspects of monitoring and evaluation on issues related to governance, livelihoods and data for evaluation. His work experience includes technical advisory on rigorous impact evaluations, m&e system strengthening, and evaluation capacity building. Previously, as a senior evaluation specialist with the international initiative for impact evaluation (3ie), he led on 3ie’s systematic map of studies that used big data to innovatively evaluate development outcomes. dr rathinam holds a Phd from the University of Hyderabad, india. francis.r@athenainfonomics.com
Dr ran Goldblatt is a chief scientist at new light technologies (nlt) in Washington dc. He has a background in remote sensing and geospatial analysis, at scale, and the development of methodologies and tools for monitoring natural hazards, lclU changes and economic development. dr Goldblatt leads multiple projects conducted with the World bank, including monitoring economic activity with night-time lights, tracking urbanization processes in developing cities and evaluating deforestation processes. He also supports Fema’s disaster remote sensing team leading modernization initiatives underway to automate collection, processing and dissemination of imagery for the national disasters community. dr Goldblatt received his bachelor’s, master’s and Phd in Geography and the Human environment from tel-aviv University (israel) and has worked as a researcher and lecturer at the University of california, San diego. ran.goldblatt@nltgis.com
Dr Douglas Glandon provides technical guidance and quality assurance at 3ie to impact evaluations, systematic reviews, evidence gap maps and replication studies and supports members in strengthening organizational research capacity and evidence-informed decision-making. Glandon has a Phd in Health Systems from the Johns Hopkins bloomberg School of Public Health, a master’s in Public Health from the tufts University School of medicine, and a bachelor of arts in international relations and community Health from tufts University.
Ghermay araya, GiSP, founded new light technologies in 2001, building the company into the GiS and it powerhouse it is today with a mix of business development strategy and information technology expertise. He graduated from the University of maryland college Park Geography department with a focus on geographic information systems in the mid-1990s and is currently back at his alma mater working his way through a master’s degree in GiS.
FIG Working Week 2021 Now Transformed into FIG e-Working Week 2021
Everyone is affected by the impact of the COVID-19 pandemic. Back in May, we had to do some creative thinking when it became no longer possible to meet up in Amsterdam for the FIG Working Week 2020. Instead, 25 articles highlighting the content of the conference were published in cooperation with this magazine, GIM International. This supported one element of a conference – to learn. However, a conference is about much more than gaining knowledge. A conference should also provide inspiration and offer the opportunity to connect with people. At FIG Working Weeks, other crucial elements are networking and gaining a sense of community. It has now become clear that the possibility for people from all continents to travel to the Netherlands to meet up in person next summer will remain limited and is therefore unrealistic. The alternative is to go virtual, to create an e-Working Week – and this will take place in June 2021. The Dutch local organizers have thankfully agreed to stay on board and there will be a Dutch touch to this e-Working Week. This is already reflected in Commission 2: Gravity Field of the International Association of Geodesy (IAG) was originally established within the new structure of IAG in 2003 (IUGG XXXIII General Assembly, Sapporo), with the mission to address, coordinate and promote the study of scientific problems related to the accurate determination of the Earth’s gravity field and its temporal variations. The Earth’s gravity field is one of the three fundamental pillars of modern geodesy (besides geometry/ kinematics and Earth rotation) and accurate knowledge of it is essential for the overall theme: ‘Smart surveyors for land and water management – challenges in a new reality’. This different approach naturally gives rise to questions such as: Why should I attend a conference online? Do I get anything out of it? Is it just an online webinar? Our aim is to create a Working Week that combines face-toface elements such as networking and lively debates with sessions that – in line with the strengths of FIG – blends the different areas of surveying and geospatial science. Meeting with your peers and active engagement and interaction will be core principles for the e-Working Week. The ten FIG commissions are already working on designing these interactive sessions with topics such as: What does the Global Geodetic Centre of Excellence that was accepted by UN-GGIM mean for a surveyor?; Blended learning in a COVID-19 reality; where the water meets the land; The future of BIM in construction; Geohazards detection and monitoring; GIS and planning (strategic to applied); Point cloud-based monitoring in engineering surveying – urban/rural linkages; Climate change; and applications in positioning and navigation, civil and aerospace engineering, metrology, geophysics, geodynamics, oceanography, hydrology, cryospheric sciences and other disciplines related to the Earth’s climate and environment.
SCOPE AND OBJECTIVES
Commission 2’s activities and objectives deal with the establishment of an International Gravity Reference System and Frame (IGRS/IGRF), support of the realization of an International Height Reference System User-generated geospatial content, to name but a few.
To ensure a holistic approach and experience, the Dutch local organizers and FIG have formulated the following core principles for this new and innovative virtual event: FIG e-Working Week 2021 will: • inspire and connect • be a global event • provide an attractive virtual programme • bring qualitatively good sessions • provide an opportunity to exchange knowledge • provide an opportunity to network and socialize • bring different professional groups together.
Therefore, after attending FIG e-Working Week 2021, you will be inspired, (re)connected, energized, armed with new knowledge, and feel part of a community – in other words, it will be much more than ‘just another webinar’…
A call for abstracts has been published. It is possible to submit abstracts for peer review and regular papers. All papers will be included in the proceedings and as material for the technical sessions. Submit now to be a part of this unique and different experience. The deadline is 4 January 2021.
More information
IAG Commission 2: Gravity Field
www.fig.net/fig2021 (IHRS), support of the realization of a Global Geodetic Reference System (GGRS), analysis of current and future satellite data and release of improved global gravity field models (satellite-only models and combined models including terrestrial data), promotion of future gravity mission constellations for assuring the continued monitoring of the global gravity field and mass transport processes in the Earth system, foster regional gravity and geoid determination and integration of regional models into a global reference, understand the physics and dynamics of the
sub-systems and mass transport processes in the Earth system, and investigate modern relativistic methods and geodetic metrology with a special focus on gravity and height determination.
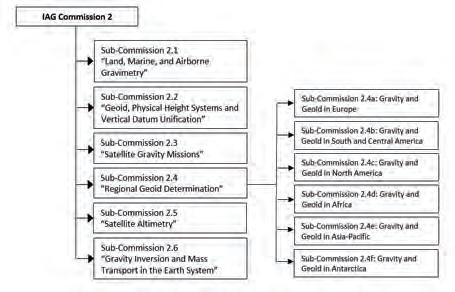
STRUCTURE AND LIAISONS
In order to streamline and appraise the research efforts towards the above objectives, Commission 2 is organized into six Sub-Commissions (see Figure 1) with an advisory Steering Committee consisting of the Commission President and VicePresident, the Chairs of Sub-Commissions, representatives of IAG Services and other members-at-large from the international geodetic community and the immediate Past Commission President. About 170 scientists from 55 countries are currently affiliated with The International Cartographic Association (ICA) is a professional organization that was founded 61 years ago, but is still young at heart. The ICA has a multi-purpose focus that includes topics ranging from ancient history to scientific development to professional practice within the discipline. One of the most important tasks for cartographers is delivering geospatial information to different kinds of users. The best way to do this is to have very close contact between the map maker and the user. This engagement not only includes experienced people, but also seeks 12 different Working Groups and 10 Study Groups that have been established under the auspices of Commission 2 for the four-year period of 2019-2023.
Commission 2 closely interacts with the other IAG Commissions and Services, the InterCommission Committee on Theory (ICCT), the newly established Inter-Commission Committees on Geodesy for Climate Research (ICCC) and Marine Geodesy (ICCM), and the components of the Global Geodetic Observing System (GGOS).
More information
https://www.iag-aig.org/iag-commissions
Figure 1: The basic structure of IAG Commission 2.
ICA – A Professional Organization with a Special Focus towards Young People
https://com2.iag-aig.org to entice younger generations, including young children, to the world of maps.
During the last online Executive Meeting of ICA (17 October 2020), two ICA activities connected to young people were approved: 1. ICA Scholarships Guidelines and Criteria 2. Call for entries for the Barbara Petchenik Children’s Map Competition 2021.
ICA scholarships for young scientists or professionals in cartography and GIScience
Figure 1: Winner of the creativity award. Title: It Is All In Our Hands. By artist Ugne Rimkute, age 15, from Lithuania.
can be used to participate in official ICA events (International Cartographic Conferences, Regional Cartographic Conferences, or events organized by ICA Commissions). The goal of these grants is to stimulate young scientists or professionals to direct their careers toward fundamental studies in the fields of cartography and GISciences. The opportunity for future applicants to apply is available. A list of previous awardees can be found at online.
The announcement of the official call for the Barbara Petchenik Children’s Map Competition 2021 was made in October, 2020. This year there are no significant changes for the participants in the competition. The new theme of the competition ‘A map of my future world’ was selected with 31% of the votes given by many colleagues who contributed their suggestions from 17 countries.
The Barbara Petchenik Competition is a biennial map-drawing competition for children. It was created by the ICA in 1993 as a memorial to Barbara Petchenik, a past vice president of the ICA and a cartographer who had a lifelong interest in maps for children. The aim of the contest is to promote the creative representation of the world in graphic form by children. We encourage all ICA national members to participate.
Cartographers, GI specialists, young scientists and business-oriented colleagues are invited to attend our upcoming events: - 25-26 Nov 2020: Geomatics Atlantic 2020 – Visualizing a Resilient Future Virtual Conference by the Canadian Institute of Geomatics – Newfoundland and Labrador Branch (Canada) - 16-17 Dec 2020: SilkGIS2020, Ghent (Belgium) - 21-24 Apr 2021: Atlases in Time – National and Regional Issues. Symposium organized by the ICA Commission on Atlases and the ICA/IGU Commission on Toponomy together Satellite-based change detection has been widely investigated in the last decades and has been recognized to be of high interest in several contexts, including urban (building/ infrastructure/urban canopy change), environment (forest/biomass dynamics, landslides estimation, glacier mass change, coastal line monitoring, volcanic eruption), disaster assessment (earthquake-destroyed buildings, flood water height/volume) and civil/industrial (construction/mining progress, stockpiles). Due to the complexity of the processing task and the limitations in spatial and temporal resolutions of available satellite data, the morphological changes at a large/ global scale have been mainly detected in two dimensions; 3D change detection has been traditionally limited at local/regional scale, using airborne Lidar and photogrammetry, and more rarely using stereo satellite imagery. Nowadays, innovative satellite constellations such as the one developed by the company ICEYE represent a groundbreaking approach for near real-time 3D change detection at the global scale. ICEYE X-band SAR satellites form a constantly growing constellation, providing very high spatial resolution imagery (0.25×0.5 metres for Spotlight High, 0.5×0.5 metres for Spotlight, 0.5×2.5-3 metres for with the National Geographic Institute of Spain (IGN), Madrid (Spain) - 14-19 Jun 2021: 8th International Conference on Cartography and GIS, Nessebar (Bulgaria) - 13-17 Dec 2021: 30th International Cartographic Conference, Florence (Italy)
More information about all ICA activities and events can be found in our journal, ICA News, edited by Igor Drecki, New Zealand. Rich information about cartography, news and maps can also be found in our monthly eCARTO newsletter edited by David Stripmap High, 0.5-1.5×2.5-3 metres for Stripmap, in range×azimuth respectively) with an ever-improving revisit time. The system that can acquire 24h ground track repeat on a global scale will be further developed by ICEYE in 2021 and beyond. This will enable the acquisition of images with different incidence angles multiple times a day for specified areas of interest, benefiting from SAR independence from cloudy weather and sunlight illumination. These are outstanding features, not only for daily interferometry and coherent 2D change detection but also for near real-time 3D change detection based on multi-view stereo-SAR data. The different image geometries allow mitigation/elimination of occlusions over urban and complex morphology areas overcoming the limitation of single stereo pairs. Therefore, with the almost continuous availability of ICEYE SAR imagery, 3D change detection is now entering a new era. It is also receiving a substantial boost from the recent developments of the stereo-SAR approach, which has attracted renewed attention in recent years thanks to the already available last-generation satellite SAR sensors at high spatial resolution (TerraSAR-X, Cosmo-SkyMed). The first Fraser, retired professor of RMIT University Melbourne, Australia.
More information
https://icaci.org/scholarship/ https://icaci.org/petchenik/ geoweb.ugent.be/silkgis2020 map-service.de/madrid2020/ iccgis2020.cartography-gis.com/ https://www.icc2021.net/ https://icaci.org/ica-news/
ICEYE Imagery: A Key Resource for Global Near Real-time 3D Change Detection
https://icaci.org/ecarto-news-archive/ experiments with dedicated scientific radargrammetric software assessed the 3D geometric capability of an ICEYE imagery dataset acquired in northern America. The results show that the 3D information can be extracted with an accuracy of a few metres with respect to Lidar ground truth data using a single stereo pair. Ongoing investigations highlight the possibility of improving the accuracy and completeness of the 3D reconstruction, exploiting the multi-view SAR geometries provided by several ascending and descending orbits.
By Andrea Nascetti, who is from Politecnico di Bari, Italy, and KTH Stockholm, Sweden, as well as Valeria Belloni, Roberta Ravanelli and Mattia Crespi, all from Sapienza University of Rome, Italy, ISPRS WG III/3 – SAR-based Surface Generation and Deformation Monitoring
More information
www.gsw2019.org www.isprs-ann-photogramm-remote-sensspatial-inf-sci.net/iv-5/53/2018/ https://bit.ly/2SQ4ary