
Covid 19 v GFCMarket Analysis


Sales of structured products during the period surrounding the market crash of midMarch were down 26% compared to the same period of 2019. We look at issuance and sales volumes across markets in the immediate aftermath to assess the impact of the recent market turbulence. By
Monika Ilcheva & Marc Wolterink.

Sixty-one structured products with estimated sales of US$1.3 billion had strike dates in Belgium between 1 February and 30 April 2020, a decrease – both in issuance and sales volume – from the 83 structures worth US$1.7 billion that struck in the same period last year.
At the start of 2020, the Belgian market flourished, with sales for products striking in March, at US$543m, at their highest levels in over a year. Then the financial markets collapsed
spectacularly: in April sales had almost halved to US$267m.
“What made this crisis so spectacular is the unprecedented speed at which the full society came to an emergency stop,” said Bart Abeloos, investment expert, Crelan. “As soon as the lockdown measures took effect, sectors that are built on social contact, such as catering, tourism and retail, fell completely silent. There are holes in production chains.
Consumers are severely limited in their options to spend money, and for many, there is much less to spend, due to temporary unemployment or temporary closure of the business.”
Products linked to baskets of shares ranked in first place both in terms of issuance and in terms of sales volume during the February-April 2020, mainly due to KBC’s preference to issue structured funds and lifeinsurance (Class 23) products linked to baskets comprising


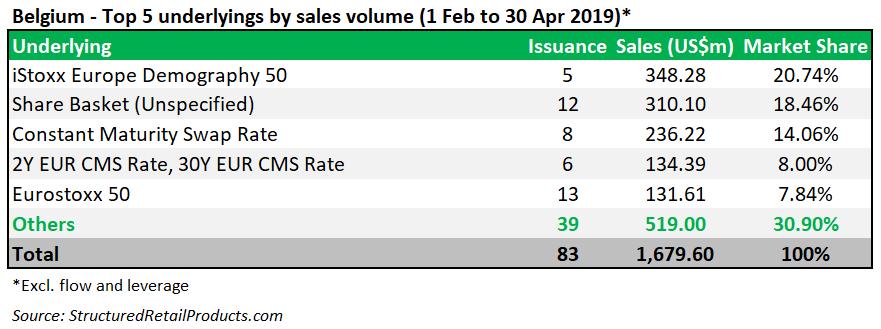
30 stocks. In February to -April 2019, most products by issuance were either linked to the Eurostoxx 50 (13 products) or a basket of shares (12).
The highest sales volume (US$307.2m) during this period was collected from five products linked to the iStoxx Europe Demography 50 – an index derived from the Stoxx Europe 600 Index, based on a first-of-
its-kind concept that focuses on seven industries that will be impacted by demographic changes, which pay high dividends and display low volatility.
‘We remain cautious about equities and opt for defensive sectors, such as food producers and companies that make a positive contribution to life in lockdown – medical technology,
e-commerce, media, software, and so on,’ said Dirk Thiels, senior investment strategist at KBC Asset Management.
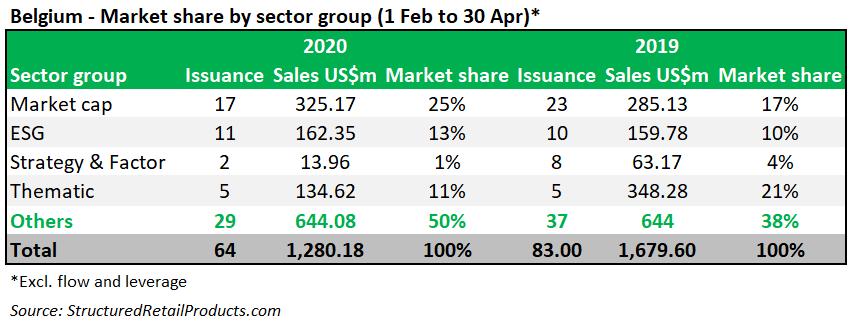
During the period analysed, 18 products were tied to market cap indices with a further 11 linked to indices with an ESG theme, compared to 23 and 10, respectively, in the same period last year. A new entrant in the country’s top five underlying
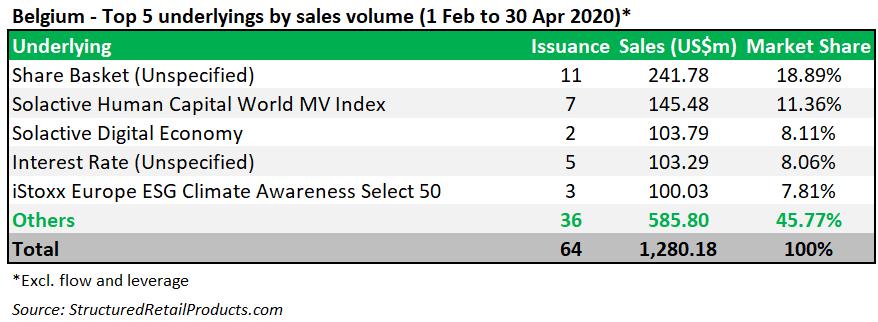
ranking was the Solactive Human Capital World MV Index which gathered US$142.98m from seven products.
The index, which did not appear in February to April 2019, is designed to track the performance of developed markets companies with a comparably high dividend yield and, at the same time, construct
a portfolio which exhibits low volatility and avoids excesses sector concentration.
As a sector, Europe (US$177m from 10 products), ESG (US$176m from 11 products), megatrends (US$112m from three products), and demographics (US$71m from two products) stood out in FebApr 2020 whilst in the same
period in 2019, demographics (US$348m from five products) was the dominant sector.
In the current turbulent market environment, it is more than ever necessary to be selective in your investment choices, according to David Ghezal, investment strategist at Deutsche Bank Belgium.


He believes that there are two sectors that investors should be keeping an eye on: healthcare and technology.
“Healthcare is logically at the centre of all attention at
the moment due to the race against time in the search for a cure and a vaccine against the coronavirus,” said Ghezal, adding that the sector also has many other catalysts that go beyond the current crisis.
“In particular, the aging of the population and the structural increase in health expenditure as a result of this demographic development are an important supporting factor.”
The investment horizon has not been affected so far either by the recent market crash with long-term products remaining the most popular choice in 2020.
Similarly, short-term product
are barely issued in the Belgian market with five with sales of US$59.83 issued in 2020 and four worth US$60.12m in 2019.
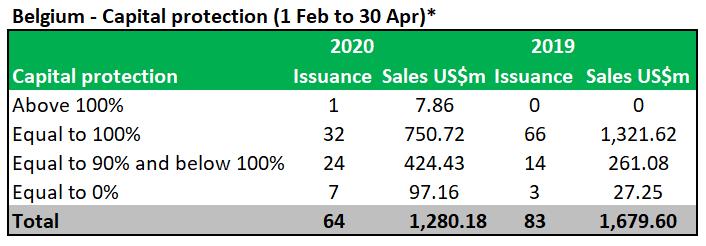
Fully capital-protected products continue to lead the way in Belgium in February to April
2020 with 30 products, which have a combined volume of US$626.66m. What has changed from the same period in 2019 is an increase in the issuance of partially protected products, which have become more popular in 2020.

Although it is too early to compare the effect of the Covid-19 crisis on the Belgian structured products market with the impact of the Lehman collapse, and the resulting global financial crisis (GFC) in 2008, some similarities can be observed.
Back then, there were 45 different distributors active in the market, which had a size of US$18.3 billion, from 584 products (for comparison, 19 distributors collected US$4.5 billion from 287 products in 2019).
However, just like today, the immediate aftermath after the Lehman collapse on 15 September 2008 (the day Lehman filed for bankruptcy) saw sales volumes drop to alarming levels – from US$1.5 billion in September to just US$299m in October 2008.
Even though sales and issuance of structured products slightly increased during the following months, the market never really recovered and annual volumes soon slipped below the US$10 billion mark, not helped either by the introduction of a moratorium on complex structured products that was introduced by the Belgian Financial Services & Markets Authority (FSMA) in July 2011.
As shown by SRP data, soon after Lehman, investors appetite shifted from products linked to a basket of shares, to products on single indices, such as the Eurostoxx 50 and Stoxx Europe 600 Healthcare, while the demand for structures tied to the interest rates also increased. One such product was ING Bank’s Callable Fix Note 3.75%, which sold €75.06m (US$83.3m) at inception.
Even pre-moratorium, capitalprotected products dominated proceedings, although investors were prepared to take more risk those days, with 30% of the 1,715 products that were issued between 1 January 2007 and 31 December 2009 putting full capital at risk.
The biggest difference between then and now can be seen in the tenor of products.
Whereas nowadays – due to the low continuing low interest rates – the vast majority of products has a duration of more than six years, with 10-year structures certainly no exception, in 2008 the bulk of sales volumes (US$11 billion out of a total of US$18.3 billion) was collected by products with a term of between three and six years.


The French structured products market has not been impacted negatively by the crisis triggered by the Covid-19 pandemic as suggested by a 73% increase in issuance during the February- April 2020 period compared to the same period last year. By Nikolay Nikolov.

The number of new products launched in the French retail market increased two-fold in the midst of the mid-March market crash.
The boom was largely due to the spike in volatility which provided new investment opportunities resulting from the pricing dislocation.
From mid-March, in the face of renewed volatility, structured products benefited from solid investment inflows, despite a slight adjustment on the average volume issued. This shows that the supply side remained very active though the average total amount collected
per product decreased.
According to SRP data, an estimation on products striking over the three-month period shows that the average amount declined from €11.6m (US$12.9m) in 2019 to €7.2m in 2020 (all products mixed).
When we exclude products brought to market via larger branch distribution networks, the figures fall to €3.5m and €2.7m, respectively.
The declining average volume could be explained by financial advisers’ (IFAs) increased demand for bespoke products compared to distributors’ range
products which dominated before. The market turbulence also favoured secondary market opportunities for investors wishing to play a rebound on stocks or indices, according to market players.
Technically, lower current valuations of structured products allow investors to buy them at a discount compared to the par.
The investor would, therefore, benefit from a considerable leverage effect when redeemed at 100% plus the memorised coupons.


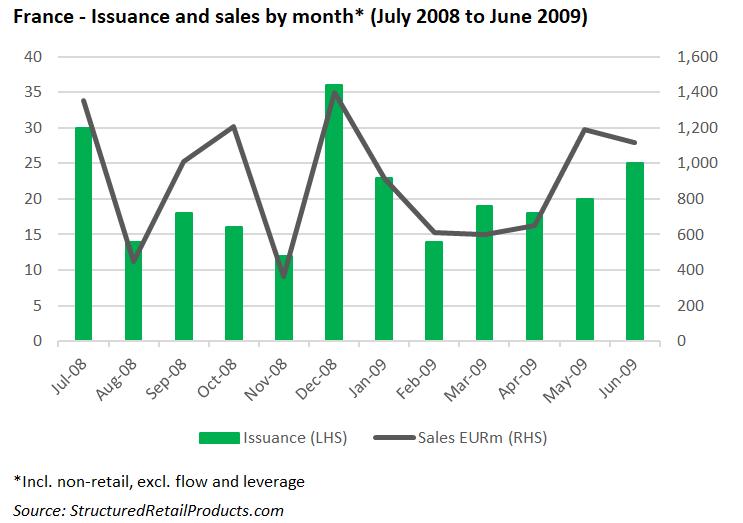


Some 369 products of the new issues available for subscription in February through April 2020 were linked to a single index, representing 57% of the issuance (64% one year back). One hundred and fortyfour products, or 22% of the issuance, were tied to a single stock. The share of single name-linked products remained
flat year-on-year, although increasing by 67% in line with the general increase of the new issuance in 2020. BNP and Société Générale were behind 70% of the single stock-linked products.
The only new entrant to France’s top five underlying ranking in the period around
the market crash is the fundlinked structure which seems to have re-emerged after being barely visible in the last decade. Sixty-eight products were linked to the Solys Euro Evolution fund over the period analysed, the second most used underlying. The fund selects stocks, according to both quality and extra-financial criteria, and
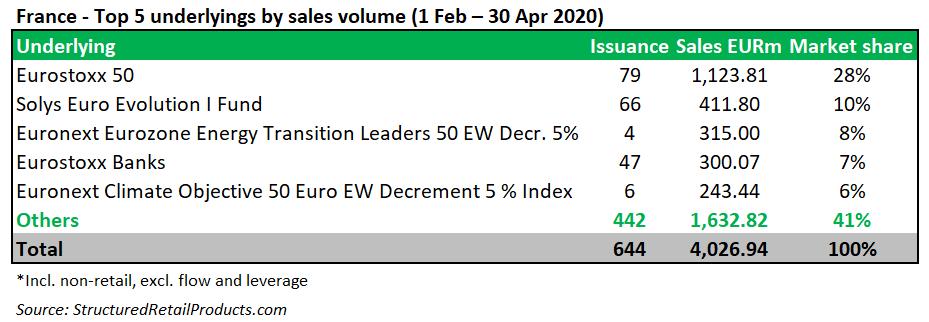
incorporates risk management and volatility stabilisation mechanisms. The increase in fund-linked products came at the expense of benchmarkand synthetic indices-linked structures (18%, -8%) and (26%, -9%), respectively.
Linking products to the Eurostoxx Banks continued to be favoured by investors seeking to benefit from the attractive derivative parameters of this underlying, notably high volatility and dividends. The weakness of the index, which has declined sharply over the recent years, provides additional appeal as an underlying for
structured products, according to the industry.
Despite increasing concerns about the environment no longer being a market priority as a result of the crisis, particularly with oil being so cheap, the issuance of products linked to sustainable underlyings rather evidenced a resilient demand amid falling markets. ESG indices underlying structured products outperformed indices, which do not consider environmental, social and governance criteria in April, on average.
Sixty-two products launched
for subscription from February through April 2020 tied their performance to an ESG index. This is a 138% increase when stacked up against the figure from the same three-month period in 2019. The ESG-linked products represent 10% of the entire issuance (seven percent for the same period one year back).
The ESG theme accounted for about 18% of the total collected sales volumes between February and April 2019. The amount is expected to increase by a rough five percent to an estimated €0.95 billion on the back of 62 new issues.

The autocallable structure accounted for 95% of the issuance, a five percent increase from the same three-month period in 2019.
Sixty percent of the whole issuance (including Athena autocalls) is growth seeking compared to 59% one year back. Income producing
products lost a six percent market share although their number increased. Seventeen products featured combinations of income and growth strategies within the autocallable structure.
The issuance of Phoenix Memory notes increased by 175% in the February to April 2020 period compared to the same period of last year. This category
represents 12% of the entire issuance (eight percent for the same period one year prior). The structure memorises any unpaid coupons, while featuring a separate knockout trigger. Because of the additional mechanism, which made it a complex structure (if used with an optimised index), the formula has been restricted from distribution in public offerings by the AMF since 2016.

The lookback option saw a revival with an increasing number of products setting the strike level on the lowest point out of several measurements of the underlying.
This payoff mechanism seeks to smooth the entry point allowing to benefit from high volatility conditions.
The number of products with annual valuation dates accounted for 25% between February and April 2020 down from 28% in 2019. Quarterly daily and semiannual observations recorded an increase: quarterly (32%, +8%), daily (14%, +3%) and half-yearly (17%, +2%).
Products with monthly observation lost one percent, at seven percent of the issuance. In contrast, products with lagged autocall observation
dates (1.5 or more years from the strike) recorded a four percent increase year-on-year, at 14%.
In the context of plummeting market levels, the number of products with descending and negative autocall triggers also decreased, from 38% of the issuance in February 2020 to 32% in March and 20% in April 2020.
In contrast, the so-called Athena Rebond emerged as the autocall structure to offer full upside participation on a possible strong market increase at any of the autocall observation dates.
Specifically, if the underlying registers an increase on any of the observation dates, the structure will pay the greater between the pre-defined memory coupon and the full rise of the index. In practice,
this means the payoff will not be capped at the headline rate should the underlying performance be more important.
The average headline rate of autocall premia represented 8.87% pa in the period analysed, up from 7.77% in the three-month period of 2019. Coupons on contingent income products stood at 6.59% pa. (6.3% previously) and will be delivered up to an average 26.5% fall in the underlying (28% previously).
Only three fully capital protected-products have been launched in the aftermath of the pandemic propagation. Issuance of products with partial protection remained flat yearon-year. The average knock-in barrier of the soft protected autocallables launched in the


current trimester protects the initial investment up to a 37% fall in a benchmark index underlying; up to 42% fall in a decrement index underlying and up to 40.6% fall in a single stock underlying.
The 45 structures linked of baskets of shares would absorb a 51% decline in the worst performing share in the basket. Products with knock-in barrier set at 60% of the initial level
dropped from 51% to 42% of the issuance in February to April 2020, while the share of barriers set at 50% increased from 26% to 30%.
From a tenor perspective, the most notable development is the increase of products with 12-year maximum investment term, which went up by nine percent when stacked up
against the figure from the same three-month period in 2019.
This came at the expense of products with duration of six years or less. Ten-year products were also up by 2.3%.
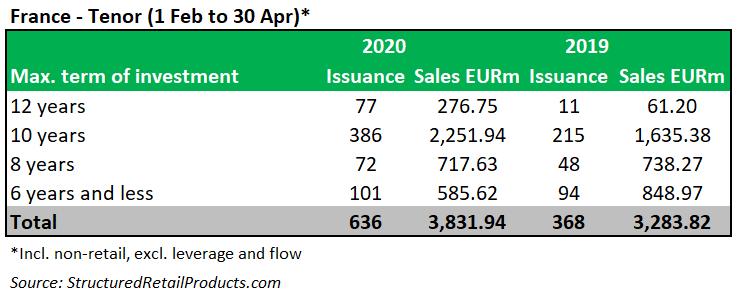

Unlike its neighbour Belgium, which registered an 80% month-on-month decrease in structured products sales as a result of the Lehman collapse in September 2008 (from €1.4 billion to €274m in October 2008), the immediate impact on the French market was rather limited. Although issuance was slightly down in the aftermath of the Lehman bankruptcy, sales volumes in October 2008, at €1.2 billion, were up almost 20% on the previous month, and the year ended on a high with €1.4 billion collected from 36 products in December.
However, it’s worth noting that Lehman Brothers never featured as a counterparty on the French
market, while in Belgium it was used as the manufacturer by Citibank Belgium, Nateus and Ethias, among others, according to SRP data. Back then, French investors preferred offerings issued via local issuers with BNP Paribas, Crédit Agricole and Société Générale taking the lion’s share – as they still do today.
If we look at the period 20072009, post-Lehman, a shift took place to structures tied to single indices, especially the Eurostoxx 50 and the local Cac 40. Products linked to an index basket, which up until mid-2008 had been the dominant asset class had all but disappeared by the end of 2009. Credit-linked
products also started to appear on the market, with the first structures launched in Q1 2009. Whilst nowadays green investing is all the rage, there were already ESG linked products even pre-financial crisis, with three such offerings striking in France in the second half of 2007. Of these, Crédit Agricole Caisses Régionales distributed Mutualto, a 5.5-year structured fund linked to the FTSE 4 Good Europe 50 that sold €19m at inception.


Despite the country being close to the epicentre of the Covid-19 outbreak, Japan’s structured products market has remained somehow stable. By Veselin Krastev.

SRP data shows an increase in both issuance and sales during the period between 1 February and 30 April 2020 against the same period in 2019. Excluding flow and leveraged products, issuance was up 17% and sales also increased by 27% compared to 2019.
Looking at the three-month period in the run up and immediately after the market crash of mid-March, sales stood at US$3.95bn across 221 striking products, compared to same period in 2019 - overall sales were up by 27% with 32 more products striking.
However, April’s sales hit a low of US$501.8m, last seen in July 2016 (US$494m) with the
lowest number of striking (53), since May 2019. Compared to the previous months, sales were down by 64%, while the number of striking products was also down by 33%.
The dominance of products linked to the FX rate and single index/shares in 2019 has shifted predominantly towards equity single/worst-of index ones, SRP data shows. Japanese investors have put their focus on the Nikkei 225 index both alone and in combination with other market cap indices such as the S&P 500, Eurostoxx 50 and DJ Industrial Average. Despite the fall in value during the market crash in mid-March which saw the Nikkei 225 falling to its lowest level (16,609),
the Japanese benchmark has bounced back to its February level (above 20,000).
The most featured FX rate underlying in Japan is the JPY/ AUD currency pair but volumes collected with this underlying have decreased significantly. New in the top five underlying ranking is Japan’s interest rate which has featured in six products worth an estimated US$90.3m compared to two such products issued during the same period last year worth an estimated US$11.78m.
Issuance (down 6.8%) and volumes (up 14.7%) related to the most popular payoff combination – knock out/ reverse convertible, has


remained relatively stable in 2020. This combination of yield enhancement and soft protection, with a knock in barrier, has been the bread and butter for Japanese investors for many years now. However, this payoff has seen
a downward trend in issuance since the second half of 2019, giving way to a new favourite for Japanese investors – dual index products with a worst-of feature. Products with a knock out, reverse convertible, worst of option payoff profile, linked
to index baskets with different combinations have increased both in issuance and volumes compared to the same period in 2019.
SRP data shows that investment terms in the country’s structured

products markets have shifted notably from short-term structures which dominated in 2019 to a slightly longer terms. Products with one- to five-year terms have increased by 300% from 39 in 2019 to 156 in the
same period of 2020. Longer term products of over five years treble last year’s issuance. Yield enhancement products with no capital protection dominate product issuance in Japan with fully-protected structures
representing a small portion of the overall issuance.
In terms of underlyings, Japan’s structured products market remains heavily weighted towards market cap underlyings

with 112 products worth an estimated US$4.3 billion during the period in question compared to 76 products worth an estimated US$2.5 billion, in 2019.
Overall, the impact of the market crash triggered by the Covid-19 pandemic has been limited with investors benefitting from higher buffers, and higher coupons. More than half of the
products issued in the observed period offered fixed coupons of 4.35% pa. on average with some products offering as much as 14-15.5% pa.

Looking back at the 2008 financial crisis which became a structured product market issue when a leading manufacturer at the time - Lehman Brothers, went bankrupt on the back of unprecedented losses due to the subprime mortgage crisis in the US - we can see similarities regarding the level of issuance and sales.
SRP data shows that the aftermath of the collapse translated in a dramatic drop
in issuance and sales of more that 50%. Although the speed of the selloff was not as fast as in 2020, the markets did not rebound at the same speed either. However, less than a year after the market crash, sales were almost at the same level as before the Lehman collapse despite issuance was 60% lower.
It is worth mentioning that postLehman, the Japanese market recovered steadily despite a
shift from equity underlyings towards FX rates and managed funds – the latter had not been present in the market since early 2007. The number of products using managed funds as underlying almost double in the fourth quarter of 2008.
SRP data also shows that equity underlyings returned to the market in full swing at the beginning of 2009, more than doubling compared to the last quarter of 2008.


The extreme Covid-19 related volatility on the financial markets at the beginning of this year saw record numbers of turbos issued in the Netherlands during the weeks leading to the mid-march market crash and immediately after. By Marc Wolterink.

Some 26,880 products (almost exclusively turbos) were added to the SRP Netherlands database between 1 February and 30 April 2020, a 5.5-fold increase compared to 4,091 products that were added in the same period last year.
The 16,467 products issued in March is the highest ever number of products added to the SRP Netherlands database in a single month, since its launch in April 2006.
The local AEX-index was featured in more than 4,800 certificates. Underlyings from the automobiles & parts (1,451 products), banks (1,211), and semiconductors (1,093)
sectors were all in demand while products linked to technology (1,036), mining (719), retail (560), and pharmaceuticals & biotechnology (264) were also popular with Dutch investors.
The latter sector was also frequently requested by clients from Leonteq, according to Harm Polman, director, crossasset investment solutions sales for the Netherlands, at the Swiss structured products provider.
“We certainly noticed that and we even have a special Leonteq Biotechnology Index on which capital-guaranteed products are now made,” said Polman, adding that investors seem to want
to “commit to this sector for a longer period of time”.
“In addition, we have also seen in the last two weeks that the traditional value stocks have become in demand again: Unibail, ING, NN,” he said.
Everyone is looking at the same sectors: tech, healthcare and consumer staples, according to a senior executive at a distribution outlet.
“This was already the case in 2018 and 2019, but it has intensified very rapidly in recent months.
“You would expect that at some point this would become a


crowded trade, but so far those sectors have been the winners,” said the executive.
Marcel Pronk, director securities marketing structured products, at Kempen, also noticed more demand for sector-related products though the vast majority of the trades still remain on the normal large indices such as Eurostoxx 50 and S&P 500.
“Industries that are particularly popular now are indeed healthcare, technology and consumer staples,” he said.
Primary market products, however, were scarce, as they have been for years in the Netherlands, with only 44 products – from BNP Paribas, ING Bank, Leonteq, and Société Générale, respectively – issued during February-April 2020.
Nearly all tranche products were autocalls and 37 had a snowball feature. The Eurostoxx 50 was used in 22 of these products, either on its own, or as part of a basket, while the Eurostoxx Select Dividend 30 (19 products), iShares MSCI Emerging Markets ETF (12), and S&P 500 were also frequently used.
In February-April 2019, there were 15 primary market


predominately tied to single stocks.
In February 2020, Kempen announced that due to the current exceptional market conditions in the financial markets, it had increased the
bid-ask spread of all products with Van Lanschot as issuer from 0.5% to one percent. The bank ended the first quarter of 2020 with a loss of €10.5m after tax, blaming ‘exceptional’ volatility in certain segments of the financial markets for
losses in its structured product portfolio.
The extreme volatility and illiquidity of the markets in March made it impossible to make timely adjustments to these hedges, causing losses

ING Financial Markets, which houses the bank’s structured products business, recorded a result before tax of €-78m in the first quarter of 2020, compared with €-33m in the first quarter of 2019.
However, revenues were up in the structured products, forex, non-linear, and commodities businesses, which all benefited from the volatility on the financial markets, according to the bank.
Covid-19 is something that even during boom times would have caused tremendous damage, according to Professor Jaap Koelewijn, speaking at the Big Crisis Webinar on 15 April.
‘Only, in those times there is a little more resilience,’ he said. ‘I am always amazed at the enormous resilience of the market economy. Things are going to change and I think the recovery will come in a year or two, but you have to have the guts to sit out the storm.’

Looking back at the 2008 financial crisis which became a structured product market issue when a leading manufacturer at the time - Lehman Brothers, went bankrupt on the back of unprecedented losses due to the subprime mortgage crisis in the US - we can see similarities regarding the level of issuance and sales.
SRP data shows that the aftermath of the collapse translated in a dramatic drop
in issuance and sales of more that 50%. Although the speed of the selloff was not as fast as in 2020, the markets did not rebound at the same speed either. However, less than a year after the market crash, sales were almost at the same level as before the Lehman collapse despite issuance was 60% lower.
It is worth mentioning that postLehman, the Japanese market recovered steadily despite a
shift from equity underlyings towards FX rates and managed funds – the latter had not been present in the market since early 2007. The number of products using managed funds as underlying almost double in the fourth quarter of 2008.
SRP data also shows that equity underlyings returned to the market in full swing at the beginning of 2009, more than doubling compared to the last quarter of 2008.


As the coronavirus outbreak hit the country, South Korea’s structured products market slowed down with both issuance and sales decreasing for the period preceding the market crash of mid-March, compared to the same period of last year. Excluding flow and leverage products, issuance and sales fell by 16% and 32%, respectively.
By Lachezara Tsenova
Looking at this year’s developments, the market has dropped continuously since the beginning of the year. April’s sales stagnated with a slight drop of four percent to US$4,828m, while issuance plummeted 19% to 1,469 striking products, compared to March. This level of market activity was last seen in July 2016 (US$4,752m/1,689 products).
According to SRP data, both in 2019 and 2020, the worst of structures linked to baskets of indices were most popular, followed by the single index underlyings. Foreign indices such
as the Eurostoxx 50, Hang Seng China Enterprises Index, S&P 500 and Nikkei 225 in various combinations continued to dominate. TheS&P 500 gained market share over the Hang Seng China Enterprises Index and appeared alongside the Eurostoxx 50 in more than 2,200 products between February and April 2020.
South Korea’s Kospi 200 index has seen a recent revival among investors. Despite a dramatic fall at the beginning of March to a four-year-low of 236.82 from February’s high of 303.01 – the index managed to recover to an average of 246.54 during April. In terms of structured products, the
lower issuance in 2020 resulted in decreasing sales volumes despite almost doubling the sales volume of Kospi 200-linked products compared to 2019.
The most featured payoff for both periods was the combination knock out, protected tracker, and worst of option.
However, issuance of this payoff structure dropped by 8% with sales volumes also decreasing almost by half compared to the same period of 2019. Although knock in barriers have been lowered to 35% on a number of products issued after the midMarch crash, and some of the


coupons have risen to between eight and 16% per annum, on average downside barriers have risen from 60% in the 2019 period to 61% during the 2020 period.
Most of these products offer limited protection, but are the
preferred option among South Korean investors due to the chance of early redemption, especially if there is a lizard option and/or a knock in barrier. These products have increased their appeal to investors on the back of the recent market volatility as they provide higher
coupons and more protection.
During the period analysed, SRP recorded a significant increase in issuance and sales of digital products mostly linked to the Kospi 200 and the Certificate of Deposit Rate 91d, followed by domestics stocks like Samsung

Kospi 200 and the Certificate of Deposit Rate 91d, followed by domestics stocks like Samsung Electronics and Hyundai Motor. This would be as a result of investors shifting towards the capital protection offered by
these products in the current environment.
Products issued during the period observed switched to longer tenors in a market characterised by the opportunistic short-
term approach of its investors. Products with tenors between one and five years doubled in issuance in 2020, while products with shorter terms decreased by 76%, compared to February-April 2019.


Electronics and Hyundai Motor. This would be as a result of investors shifting towards the capital protection offered by these products in the current environment.
Products issued during the period observed switched to longer
tenors in a market characterised by the opportunistic shortterm approach of its investors. Products with tenors between one and five years doubled in issuance in 2020, while products with shorter terms decreased by 76%, compared to February-April 2019.
The market turbulence has also led to an increase in issuance of products with full capital protection. Even though the majority of issued products between February and April 2020 offered no capital protection, products with 100% capital return have doubled. In addition, capital
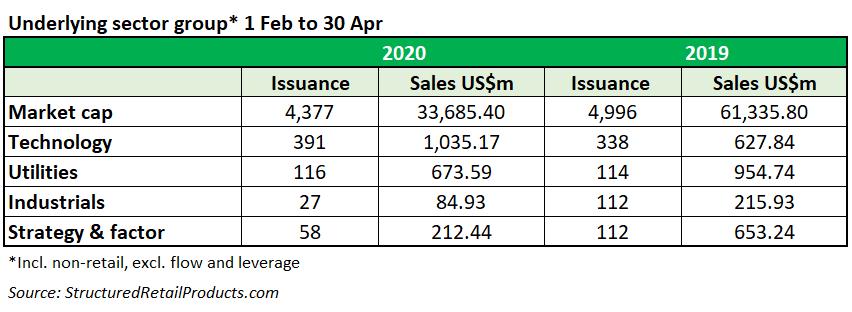
protection of 80-85% gained popularity in 2020, reflecting an increasing in issuance of not fully protected products. South Korea is not behind global trends when it comes to the underlying sector group with many products linked to technology, utilities and industrials assets.
According to SRP data, Korea Electric Power was the main focus of investors in both periods, with
In February-April 2020, other sectors like consumer goods and prop & custom recorded a rise of 38% and 34% respectively, compared to the same period last year.
Overall, capital-protected products along with the early redemption options with higher coupons and lower barriers kept
issuers afloat in the run up to the crash. Downside barriers increased by 50% - for instance, an NH Investment & Securities placement offered an annual coupon of 16% with a knock in barrier of 45%.

Comparing the market activity of 2020 with the activity seen after the Lehman Brothers collapse in September 2008 shows that the market started to recover within the next three months after the crash. This is similar to the developments seen since December 2019, with sales and striking products decreasing during the first three month of 2020, but picking up in April when sales have shown signs of recovery.
A senior market source told SRP about serious concerns at the end
of March as the experience after the Lehman Brothers bankruptcy was that the real damage came one or two months after the event.
“This time around some investors did not panic and actually many of them saw the bottom and went for it,” said the source. “That call has paid off for those investors who have been able to take advantage of the market volatility to enter new products and that helped the volumes to recover very sharply.”
Overall, the collapse in activity after the Lehman Brothers bankruptcy saw structured productsales and issuance around almost all assets halving in the immediate aftermath. These shrank further during the following two quarters with baskets of shares and indices almost disappearing from the market and the rest of assets at historical lows. Single equity indices however managed to keep some level of activity and led the recovery during the first months of 2009.


The impact of the recent market crash in the structured products world has been well documented. As with any market dislocation, trader and investor losses piled up alongside increasing hedging costs and faltering assets.
By Filip Dyankov & Yordan Ivanov
However, the trigger for the current crisis is not creditrelated as it was the case back in 2008, but a direct consequence of the collapse of the financial markets as the economy came to a halt.
In this article we analyse how the US structured products market fared between February and April 2020 compared to February and April 2019 in terms of sales volume, number of new products issued and product performance.
SRP data shows that 57% of new products launched and 60% of the sales volume generated in the US market year-to-date
relate to the period analysed, primarily due to very strong sales recorded in February and the first half of March as the markets were still rallying.
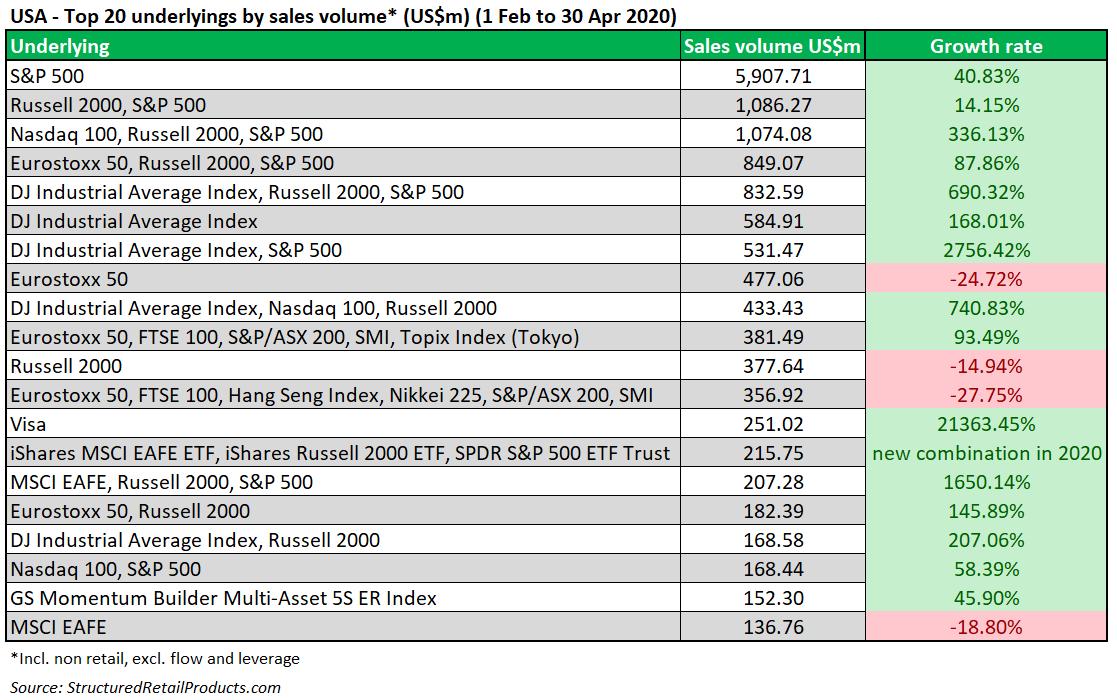
SRP data shows that the number of products tracking the S&P 500 increased by 42.17% year-on-year - from 773 to 1099. The second and third underlyings in terms of issuance between February and April 2019 were the Russell 2000 and S&P500 (515 issuances), which were delivered via worst of structures, followed by the Eurostoxx 50 (228 new products), which was deployed
via participation products.
In 2020, the Russell 2000 and S&P 500 worst of structure remained the second most popular play for investors (620 issuances; 20.39% positive shift) with the DJ Industrial Average Index, Russell 2000 and S&P 500 worst of structure coming in third (281 new products, a rise of 430.19% compared to the same period of last year). The SPDR S&P 500 ETF Trust (1,300% more products released to the market) and the Apple share (with a 226.09% increase in issuances) entered the top five underlying ranking during the February to April 2020 period.


Proprietary index by Goldman Sachs and an economy dependent index on the backfoot both in terms of sales and in terms of new products launched .
The use of proprietary indices developed by banks has also shifted. The JPMorgan Efficiente
Plus DS 5 Index and Morgan Stanley MAP Trend Index slipped out of the top 10 underlying table during the period analysed compared to 2019 when they linked to 102 products worth US$154m, and 77 products worth US$56m, respectively.
Another popular proprietary
underlying in the US market, the Goldman Sachs Index GS Momentum Builder Multi-Asset 5S ER Index has also seen issuance dropping almost by half – 51 products (Feb-Apr 2020) compared to 93 products (Feb-Apr 2019). The cumulative cash position of the index as of 21 April accounted for 84.5%

of its total weight which means that each index component within the seven asset classes used in the rotating strategy exceeded 6% realised volatility.
Regardless of the index weighting during the period analysed, the sales volume in 2020 increased by 45.90%, compared to 2019 with investors potentially capitalising on the volatility control feature, and putting up with the probability of having a
cash-dominated portfolio when experiencing high levels of volatility, rather than incurring in losses with a risky portfolio.
It is also worth mentioning that the S&P Economic Cycle Factor Rotator Index, which ranked ninth in the issuance ranking with 78 new products striking between February and April 2019, disappeared from the top 20 table for the corresponding period in 2020. The S&P Economic Cycle Factor
Rotator Index selects the underlying index on which its performance is based depending on the three-month moving average and monthly change figures of the Chicago Fed National Activity Index (CFNI), which represents a weighted average of 85 monthly US macroeconomic indicators (please refer to the Excel attachment - cfnai-realtime-3xlsx).
In March 2020, the three-

month moving average stood at -1.47 (-0.21 in February 2020), and the monthly change was -4.19 (0.16 in February 2020). In other words, the moving average was both negative in February and March 2020 but with a tendency to fall deeper into the negative territory, whereas the monthly change fell
from positive to negative.
These characteristics of the CFNI explain why the term contraction is used to describe when the US economy is slowing down, and the magnitude of stagnation is accelerating. Under these circumstances, the S&P Economic Cycle Factor Rotator
Index follows the performance of the S&P Low Volatility High Dividend Daily Risk Control Index, which tracks the 50 least volatile constituents of the 75 highest dividend yielding companies in the S&P 500.
If the CFNAI change and average were positive, the

CFNAI would have been based on the performance of large and mid-cap corporate behemoths (if the economy is in expansion), or on the performance of stocks within the S&P 500 with strong value characteristics (EPS ratio, book-to-price ratio) but low growth characteristics (EPS growth), when the economy is in a recovery mode. The state of the economy/CFNI may have dissuaded investors from investing their funds in the S&P Economic Cycle Rotator Index.
Underliers’ sales volume – S&P 500 unwaveringly stays first – but how did its payoff types diverge in 2020? .
Despite the collapse of the S&P 500 index during the market crash of mid-March, the most popular US underlying remained on top in terms of issuance and sales – US$4.1 billion for the period between February and April 2019 compared to US$5.9 billion in 2020.
The main payoff type combinations used to deliver S&P500-linked products remained unchanged: capped call/enhanced tracker/protected tracker (US$1.2billion in the 2019 vs US$1.2 billion in 2020; enhanced tracker, protected tracker (US$781.47m vs US$863.46m), and digital, protected tracker (US$413.75m vs US$785.88m).
Another trend unveiled during the period was the 2,758.8%

upsurge in sales volume of knock out/reverse convertible structures which stood at US$424.49m during the period.
This boom in interest towards this payoff profile occurred primarily in the run up to the
market crash, and especially in the 1 March 2020 - 20 March 2020 timeframe when 89.79% of the March 2020 sales volume from knock out, reverse convertible structures linked to the S&P 500 index increased.
Growth products - participation equals zero-coupon bond discount dividend by option costs – effects of macroeconomic indicators, volatility, and option prices

on the interest for growth structured products
Given the continuous slashing of the Fed’s Fund rate, declining interest rates will trigger a hike in bond prices, as their coupons will become more attractive. As a result, enhanced demand will strengthen bond prices, and curb their yields (current yield = annual coupon/bond price). The ongoing macroeconomic indicators and the policies followed by the Federal Reserve indicate yields will fall.
It is assumed that both call and put options were far more costly in the run up to the market crash, given that the VIX CBOE Index averaged 40.65 in the period observed compared to 14.19 for the respective period of 2019, .
Considering all underlying factors impacting the participation rate of growth products, zero coupon discounts shrunk in 2020 relative to 2019 (refer to figure 7), whereas the cost of the options was influenced by an interplay of
factors including the spot price of underliers and volatility. However, objectively volatility tends impact underlier spot prices adversely more often than not even though the direction of movement can be dual.
As the coronavirus crisis unfolded, growth products have proven to be more resilient with sales volume falling to a far lesser extent compared to income products. The sales volume of growth products in March 2020, as reported on our news service, spiked

compared to February 2020 and March 2019 by 7.71% and 48.36%, respectively. Income sales relative to February 2020 declined by 14.44% albeit a remarkable increase of 119.35% compared to the same period of 2019 (refer to figure 6)
Sales figures for April 2020 relating to growth products remained relatively intact, recording a drop of 0.14%. Conversely, income products recorded a flux of inflows in February 2020, and sound performance in March 2020. However, sales of this product
type crumbled in April 2020 by 40.55% despite a 16.1% increase in sales relative to March 2019. It is evident that upside participation of growth structured products will remain limited unless some preventive measures are taken. This approach can be an alternative
to the concept of capitalprotected products per se, which illustrate a relatively lengthy maturity by default.
The theory overlaps with the practical data from the SRP database – in reality, the average upward participation of growth products decreased from 164.02% in February 2019 to 153.96% in April 2020.
Why were income product sales so jubilant in February and
March 2020 prior to the trough in April 2020 – consideration of reverse convertibles and knock out products. In this article, we look at two principal income payoff types of structured products - namely, products comprising reverse convertible and knock out as their/one of their payoff(s).
Products featuring the reverse convertible as at least one of their payoff types saw a far greater number of issuances in February 2020 compared to same period a year ago in
February 201. In fact, issuances of reverse convertible-backed structured products grew by 109.45% reaching 1,152 products in February 2020 (comparatively February 2019 was less prolific in terms of reverse convertible issuances totalling 550). March 2020 issuances of products involving a reverse convertible payoff stood at 1,162, a rise of 0.87% relative to February 2020 and 65.06% against the equivalent period in 2019.
In April 2020 investors shunned

reverse convertibles which saw a 37.01% slump in sales compared to the previous month although the upward inertia led to a sales volume increase of 4.72% compared to April 2019. Variable coupons remained the most widely issued form of reward embedded in reverse convertibles, representing
around 90% of the total reverse convertible issuance for both periods. A marginal shift towards the predictability of fixed coupons diversified the pool of striking reverse convertibles in April 2020, as their share of total issuances increased to 11.75% (relative to 7.83% in March 2020).
To name a few products, the fixed coupon reverse convertible structure with the greatest sales volume in April 2020 (13.025%) had a knock out, reverse convertible payoff type and tracked the performance of the JP Morgan Chase share,
conferring an unconditional monthly fixed coupon of 10% being potentially autocalled on a quarterly basis if the underlying price was above its initial level. The final payout of this product involves the risk of losing the entire principal amount, and the payout upon maturity is settled in shares, with any remaining fractional shares paid out in cash.
Another highly sold reverse convertible featuring a fixed coupon striking in April 2020 was a knock out, reverse convertible tracking the Walt Disney share which recorded a sales volume of US$12.427m paying out a monthly coupon of nine percent, subject to a potential early maturity on a quarterly basis.
The highest coupon among reverse convertibles with the initial valuation date in April 2020 was offered by a structure linked to the Boeing share at 27.9% pa, reflecting the financial difficulties the airline industry has been experiencing since the pandemic erupted.
Products featuring the reverse convertible as at least one of the payoff types had their fixed coupons boosted from an average of 8.24% in February 2020 to 11.97% in April 2020a 45.35% upward shift. During the 2020 period reviewed structured products featuring the reverse convertible as part of the payoff combination did not exceed the six-year term, unlike the period from February to April 2019.
A technical detail of products with an inbuilt reverse convertible payoff is their underlying short position in a down-and-in put option, which determines the maturity barrier of the product. In the case of these barrier in options, their price tends to converge with the price of a plain vanilla option when the underlying price moves closer to the maturity barrier.
With regards to products comprising the knock out option, February and March 2020 were
largely successful, with 1,120 and 1,009 products issued, respectively, generating sales of US$3.1 billion and US$2.4 billion (up by 155.79% and 68.85% when measured against equivalent months in 2019).
The best-selling knock out product in February 2020 was a growth product with a digital, knock out, protected tracker payoff type combination, linked to the S&P 500 index. This products offers a 15% downward buffer and 11.83% pa call premium which is potentially available on an annual redemption date if the underlying exceeded its initial level, and an upward potential equal to the greater of 30% of the principal amount or 100% of the rise in the underlying. This structure accumulated a staggering US$164.3m in sales.
In times of unprecedented uncertainty, investors desperately seek capital protection – but is hedging a walk in the park?
During the three-month

period of 2019 there were 941 products launched with a minimum capital return of at least 95%. The same period in 2020 recorded 564 fullyor partially- (at least 95%) protected structures. Particularly noticeable was the 29.56% decrease of capital-protected products in April 2020 but also the 22.44% increase on average of downside barriers – a 7.79% increase compared to the equivalent period of 2019.
With regards to prevalent payoff types, February 2020 sales figures were dominated by the knock out, reverse convertible, worst of option payoff combination (US$1.4 billion), followed by the callable, reverse convertible, worst of option mix (US$1.2 billion), and the capped call, enhanced tracker, protected tracker combo (US$771.19m).
One of the best-selling product during this period was a knock out, reverse convertible, worst of option structure linked to the S&P 500 and Nasdaq-100 which accumulated US$46.8m in sales volume. The product’s appeal came from its capacity to generate conditional coupons on a quarterly basis amounting to 8.10% pa as long as the worst performing of the indices is priced at a minimum of 70% of its initial value.

The autocallable feature of this product comes into effect after the first six months of the investment and returns the principal amount to the investor plus the applicable coupon if the worst performing index exceeds its initial level. Payout at maturity may leave the investor’s principal unscathed and deliver the final applicable quarterly coupon if the worst performing index has fallen by no more than 30%. Looking at the 12-month historical correlation between the S&P 500 and Nasdaq 100, arranged on a monthly basis, the correlation never dropped below 0.90 except in January 2020, when a 0.876 correlation between these two indices was computed. A swift rebound in the correlation ensued up to 0.989 in February 2020.
Correlation plays a pivotal role
in products featuring a worst of option payoff, with index returns moving in divergent directions. On the other hand, contrarian views argue that the merits of worst of option are fully leveraged if the product is launched when correlation between two variables (ie indices) has decreased, which will open up more avenues for profit once the correlation picks up.
In March 2020, investors’ preferences swayed towards callable, reverse convertible, worst of option, as products consistent with the latter payoff strategy recorded sales US$1.3 billion (a 6.36% increase compared to February 2020), followed by the knock out, reverse convertible, worst of option combination, which saw a fall in sales of 34.07% to US$943m. Products featuring
an enhanced tracker, protected tracker payoff, attracted sales of US$747.38m, a 114.91% increase. The main driver in this payoff category was a product linked to the S&P 500 maturing in April 2026, which offered principal protection up to 35% and a participation rate equal to 150%.
Several payoff type combinations saw their sales rising significantly in March relative to February 2020enhanced tracker, protected tracker, worst of option (431.19%), enhanced tracker, worst of option (206.39%), and fixed upside (178.27%). The latter payoff type was solely embedded in structured products wrapped as certificates of deposit, and 61.94% of March sales were amassed by a product tracking a basket of large-cap stocks (Altria, Duke
Energy, Ford Motor, Kinder Morgan, Occidental Petroleum, Pfizer, Philip Morris, Simon Property Group, Southern Company, Verizon).
Annual coupons will be paid out upon individual stock performance - positive or null performances were regarded as a fixed four percent rise, while negative performances were counted as actual performances, subject to a 15% floor. This
product guarantees a 100% capital return at maturity. On the other side of the spectrum, some payoff combinations such as uncapped call, uncapped put (100% down), knock out, shark fin (99.36% down), and capped call, worst of option (81.67% down) suffered dramatic falls in sales during March 2020.
Considering the entire structured universe, total sales were down by 33.23% in April
in contrast to a fall in March 2020, which totalled 3.1%. The looming recession and volatile markets have given way to caps on upward participation with sales volume of capped performance products increasing by 24.73%.
Otherwise, the payoff types in vogue in April 2020 included the knockout, reverse convertible (US$828.91m, capped call, enhanced tracker (US$604.67m,

and capped call, enhanced tracker, protected tracker (US$582.44m). The best-selling products in April 2020 compared to March 2020 featured an uncapped call, worst of option payoff (126.43% upwards) and digital, worst of option (13.93% upwards).
Average annualised performance of structured products maturing in the timeframes February-April 2019 and February-April 2020
From the perspective of annualised average performance segmented on the basis of payoff types, we conclude that the weighted average annualised capital return of
maturing products was 4.10% (February 2019), 5.17% (March 2019), 5.93% (April 2019), 7.31% (February 2020), 3.22% (March 2020), and 2.96% (April 2020), respectively.
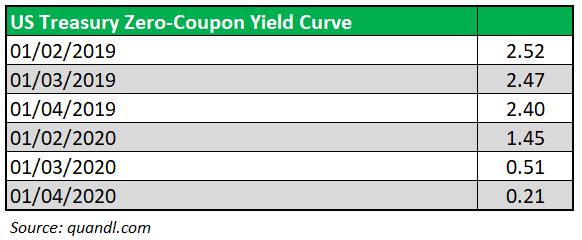
In addition, comparing the risk premium structured products carry compared to Treasury bonds, and considering that the low interest rate policy maintained by the Federal Reserve has largely suppressed bond yields, structured products performed better than bond yields. For instance, using the bond yield interpolation technique, we can conclude that whilst it was 5.89 times more profitable to hold structured
products than Treasury bonds in April 2019, a year later in April 2020 the performance advantage of structured products skyrocketed to a 61.04 times risk premium over bonds.
It is an intriguing observation that the disparity between the two-year and 10-year yields of Treasury bonds have expanded as of 1 April 2020. Why? The Fed’s goal was to issue US$2.2 trillion worth of short-term T-bills to finance President Trump’s coronavirus aid package - increasing the short-term money supply was expected to push back short-term Treasury yields back in positive territory and steepen the yield curve.

The impact of the Lehman collapse in September 2008 was felt almost immediately in the US structured products market. By the end of the month, US$2.4 billion was collected from 643 products and although issuance was more or less on par with August 2008, when 663 structures were launched, sales volumes had fallen by 37% (from US$3.8 billion).
The negative trend continued in October and November, with sales dropping to US$2.1 billion (from 460 products) and US$1.6 billion (321 products), respectively, but the absolute low was reached in December when US$1.3 billion was collected from just 307 products.owever, between
January-April 2009, issuance stabilised at around 400 products per month while by the end of May sales volumes, at US$2.9 billion, had fully recovered.
What was remarkable following Lehman’s demise, volumes for products linked to a single stock –which in August and September 2008 made up 25% and 20%, respectively, of total sales – became almost marginal even though issuance remained proportionally stable.
By October 2008, just 3.7% (US$75.9m) of the total volume for the month came from products tied to a single share, with many products simply withdrawn due to a lack
of interest. November did not fare much better, with just US$99 collected (6.15% of the total for the month), and sales only started to pick up slightly by May 2009 when US$348m (12.1% of the total for the month) was linked to this asset class.
Lehman Brothers issued 43 structured products in the USA between 1 July and 9 September 2008. Of these, 35 were linked to a single share, with the stock of Visa (four products) the most frequently used.
Photo: Kobu agency/ Unsplash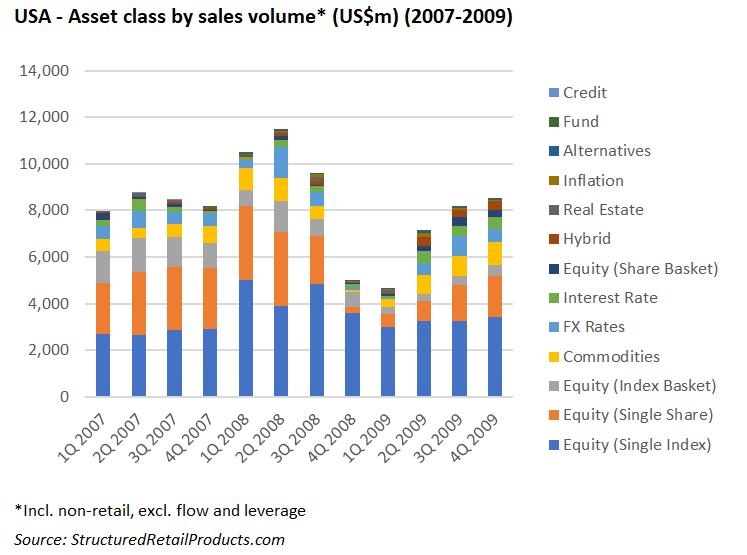

Neudata
Daryl Smith is director of research at Neudata. Smith joined Neudata from Liberum Capital, where he conducted equity research across a number of sectors, including diversified financials, agriculture and chemicals. Prior to Liberum, he worked for Goldman Sachs as an equity derivatives analyst as well as a regulatory reporting strategist.
SRP’s Reprint Policy: Articles published by SRP can be sent (on a PDF format and displaying SRP’s logo) to sources for reference and for internal use only (including intranet posting and internal distribution). If an article is to be shared with a third party or re-published on a public website (i.e. a location on the World Wide Web that is accessible by anyone with a web browser and access to the internet), SRP offers reprints, PDFs of articles or advertisements, and the licensing to republish any content published on the SRP website. Reprints and PDFs can be customised to include advertisements, company logo and/or company contact details, and can also be delivered on 170gsm matt paper. Minimum order for print: 50 copies. Prices vary depending on size, quantity and any additional requirements (e.g. editing, resizing, inclusion of logos, lamination, etc.) and range from £500 to £1,000 (+ VAT) for the authorisation to republish any Q&A, profile or feature published by SRP. For a full quote or for further details please contact info@StructuredRetailProducts.com.