3 minute read
Q.Cassar Breast Carcinoma Segmentation Based on Terahertz Refractive Index Thresholding
Breast Carcinoma Segmentation Based on Terahertz Refractive Index Thresholding
Q.Cassar1, P. Hillger3 , J. Grzyb3, U. Pfeiffer3, G. MacGrogan2, J.P. Guillet1, T. Zimmer1 and P. Mounaix1 1University of Bordeaux, IMS UMR CNRS 5218, 33400 Talence, France 2Department of Pathology, Bergonié Institute, 33076 Bordeaux, France 3University of Wuppertal, Institute for High-Frequency, and Communication Technology, 42119 Wuppertal, Germany
Advertisement
Abstract— A self-reference imaging method, in reflection configuration, was employed to extract from inverse electromagnetic problems the refractive index map of freshly excised breast carcinoma sections. Various thresholding strategies were tested to isolate the malignant pixels from the benign ones. Correlations with pathology images were performed to determine receiver operating characteristics of considered segmentations. To enlarge the field of inquiry, additional investigations towards principal component analysis were performed.
I. INTRODUCTION
Areflection imaging system was employed to record the response of freshly excised breast carcinoma sections to terahertz pulses [1]. The refractive index map of tissue samples was extracted by means of inverse electromagnetic problems. The collected maps were then segmented with different classification methods. Chiefly, it consists of defining a refractive index threshold above which, pixels are marked as malignant. However, as pixels are numerical entities rather than biological ones, such a type of rough segmentation are often hardly efficient. Therefore, connected thresholding strategies that consider pixel proximity were additionally investigated. These methods are based on the definition of an influence area that allows to mark as malignant the pixels that were classified as benign, from the refractive index thresholding, but are comprised in the influence zone of a malignant pixel. The efficiency of each segmentation was assessed by filling the associated confusion matrix with regards to the corresponding pathology images, annotated by the pathologist. The resulting receiver operating characteristics corresponding to each segmentation were derived.
Complementary to these studies, principal component analysis (PCA) investigation was investigated [2]. Such a procedure does not aim to qualify PCA efficiency for tissue classification, but rather to explore a possible correlation between the contrast exhibited from principal component analysis and pixel malignancy.
II. RESULTS
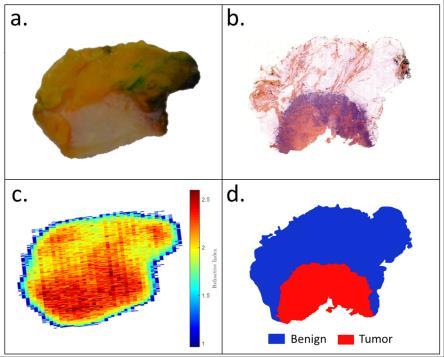
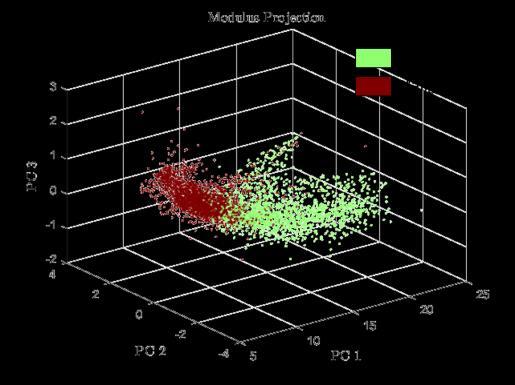
On Fig. 1 is given the photograph of one of the treated sample as well as the pathology image, the refractive index map at 560 GHz and the pathology mask. Each segmentation was subsequently correlated with the pathology mask. The receiver operating characteristic (ROC) curves were drawn for each segmentation. Fig. 2 depicts ROC curves that were extracted for a specific tissue sample. The two best obtained trade-offs between sensitivity and specificity were, in the study, 79% sensitivity for 82% specificity and 86% sensitivity for 69% specificity. Considering PCA, Fig. 3 shows the distribution of original pixels once projected with respect to their newly calculated coordinates in PCA subspace. Globally, results towards PCA indicate that pixels were clustered in accordance with their malignant or benign nature.
Fig. 1. Example of one of the treated tissue sample. a: photograph; b: pathology image; c: refractive index map at 560 GHz ; d: pathology mask.
Fig. 2. Typical ROC curves derived from the segmentation of the refractive index map. HT: hard thresholding; CT1, 2, 3: connected thresholding with influence zone that comprises 1st, 2nd and 3rd order neighbor pixels.
Fig. 3. Example of one of the modulus data set projected on the PC1-PC2PC3 3D space.
REFERENCES

[1]. Q. Cassar, et al. "Pilot study of freshly excised breast tissue response in the 300–600 GHz range." Biomedical optics express 9.7 (2018): 2930-2942. [2]. S. Wold, et al. "Principal component analysis." Chemometrics and intelligent laboratory systems 2.1-3 (1987): 37-52.


