A
Copyright © 2018 by Boston Consulting Group. All rights reserved.
Third Way
view
The highest potential value chain segments with over $1 trillion in market sales and moderate to high potential for competitive advantage
opportunity,
Moderate opportunity,
High opportunity, existing advantage
opportunity,
opportunity,
High opportunity,
build advantage
Low opportunity,
opportunity, low
advantage High opportunity, low potential for advantage Small (<$1T SAM '20 – '50) and low-growth Small (<$1T SAM '20 – '50) and high-growth or strategically important Large (>$1T SAM '20 – '50) LDES OEM 1 EV – Aftersales Services 7 LDES – O&M software 2 EV – Raw Materials 3 EV – Battery & Powertrain Manu. 4 H2 - OEM 8 H2 – Transport & Storage 9 H2 Project Development 10 EV – OEM 5 EV – Software Development 6 7 6 5 DAC - OEM 12 SMR Raw Materials 20 DAC – Project Development 13 DAC – Transport & storage 15 Clean Steel - OEM 17 SMR – OEM 21 Clean Steel EPC 18 Clean Steel - Offtake 19
Market potential 17 18 2 3 SMR EPC 22 14 12 10 20 22 DAC EPC 14 DAC Offtake 16 8 13 15 21 9 Note: Market potential placement based on APS scenario; Positioning within sectors is not relative H2 – Offtake 11 16 4 1 19 11
High US advantage today, can be kept Low
existing advantage
existing advantage
Low US advantage today, can be built Low
ability to build advantage Moderate
ability to build advantage
ability to
Low US advantage today, difficult to build
low potential for advantage Moderate
potential for
Competitive Advantage
Copyright © 2018 by Boston Consulting Group. All rights reserved. 10+ yrs $50 – 100K 10+ yrs $100 $150K 10+ yrs $50 100K 10+ yrs $100 $150K 10+ yrs $50 100K 10+ yrs $50K – 100K 10+ yrs $100 $150K <3 yrs $100 $150K <3 yrs $50K – 100K <3 yrs $50K – 100K 10+ yrs $50K 100K 10+ yrs $50K – 100K <3 yrs $50K 100K 10+ yrs $50K 100K 5 – 10 yrs $50K – 100K 10+ yrs $100 $150K 5 – 10 yrs $50K – 100K 5 10 yrs $50K – 100K 10+ yrs $50K 100K 10+ yrs $100K – 150K Job impacts Cumulative Domestic Job years 2020 2050 (APS Scenario U.S. SOM) 570,000 250,000 130,000 50,000 280,000 30,000 50,000 65,000 H2 - Transport & Storage LDES O&M Software EV- Battery1 1,050,000 DAC - Transport & Storage 320,000 1,050,000 EV OEM H2 - OEM EV Aftersales services H2 Project Dev. EV Software EV Raw materials Clean steel OEM SMRs OEM SMRs Raw Materials 2,460,000 370,000 5,000 240,000 330,000 390,000 50,000 Clean steel EPC DAC EPC Clean steel - Offtake 5,660,000 DAC OEM DAC - Project Dev. LDES - OEM SMRs EPC 260,000 H.S. Diploma Bachelor’s Degree Avg. Job Duration (Years) Est. Avg. Salary Avg. (Range)
paying jobs
of education 1. Battery & powertrain manufacturing
Majority of well
are associated with higher levels

Recognize urgency Act now Set Net Zero goals Regulate markets, offsets, and standardize Innovate-iterate Incentivize-penalize Price carbon now Adjust, reinforce, reevaluate


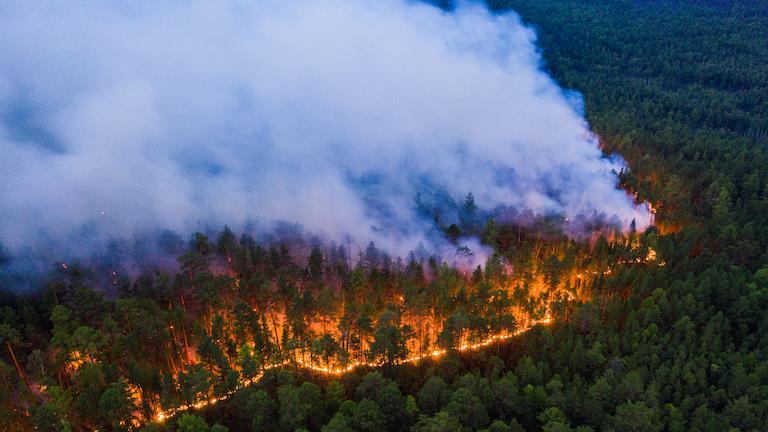
18,591 separate fires in Siberia in 2020 - a total of nearly 14 million hectares burnt – consuming peat and melting permafrost, releasing methane (80x warming) and CO2 in vast quantities.

Parts of Siberia are likely approaching a tipping point already – with scientists pulling forward estimates of shift by 70 years


93m
139m Meadowlarks
Populations of vertebrates collapsed an average of 69 percent - more than two-thirds in 48 years. (Living Planet Index -2022) 2.9bn US birds 175m Black Eyed Junko
Sparrows


