

Senate Ag Committee Republicans Economic Costs Weather & Climate Events Billion Dollars, Not Adjusted For Inflation Senate Ag GOP Analysis, NOAA Drought, $183 , 12% Flooding, $109 , 7% Freeze, $16 , 1% Severe Storms, $264 , 17% Tropical Storms, $882 , 57% Wildfires, $100 , 6% $1.55 Trillion Average $37B Annually 1980 to 2022 $$50 $100 $150 $200 $250 $300 $350 Drought Flooding Freeze Severe Storm Tropical Cyclone Wildfire Winter Storm


&
To
Disasters
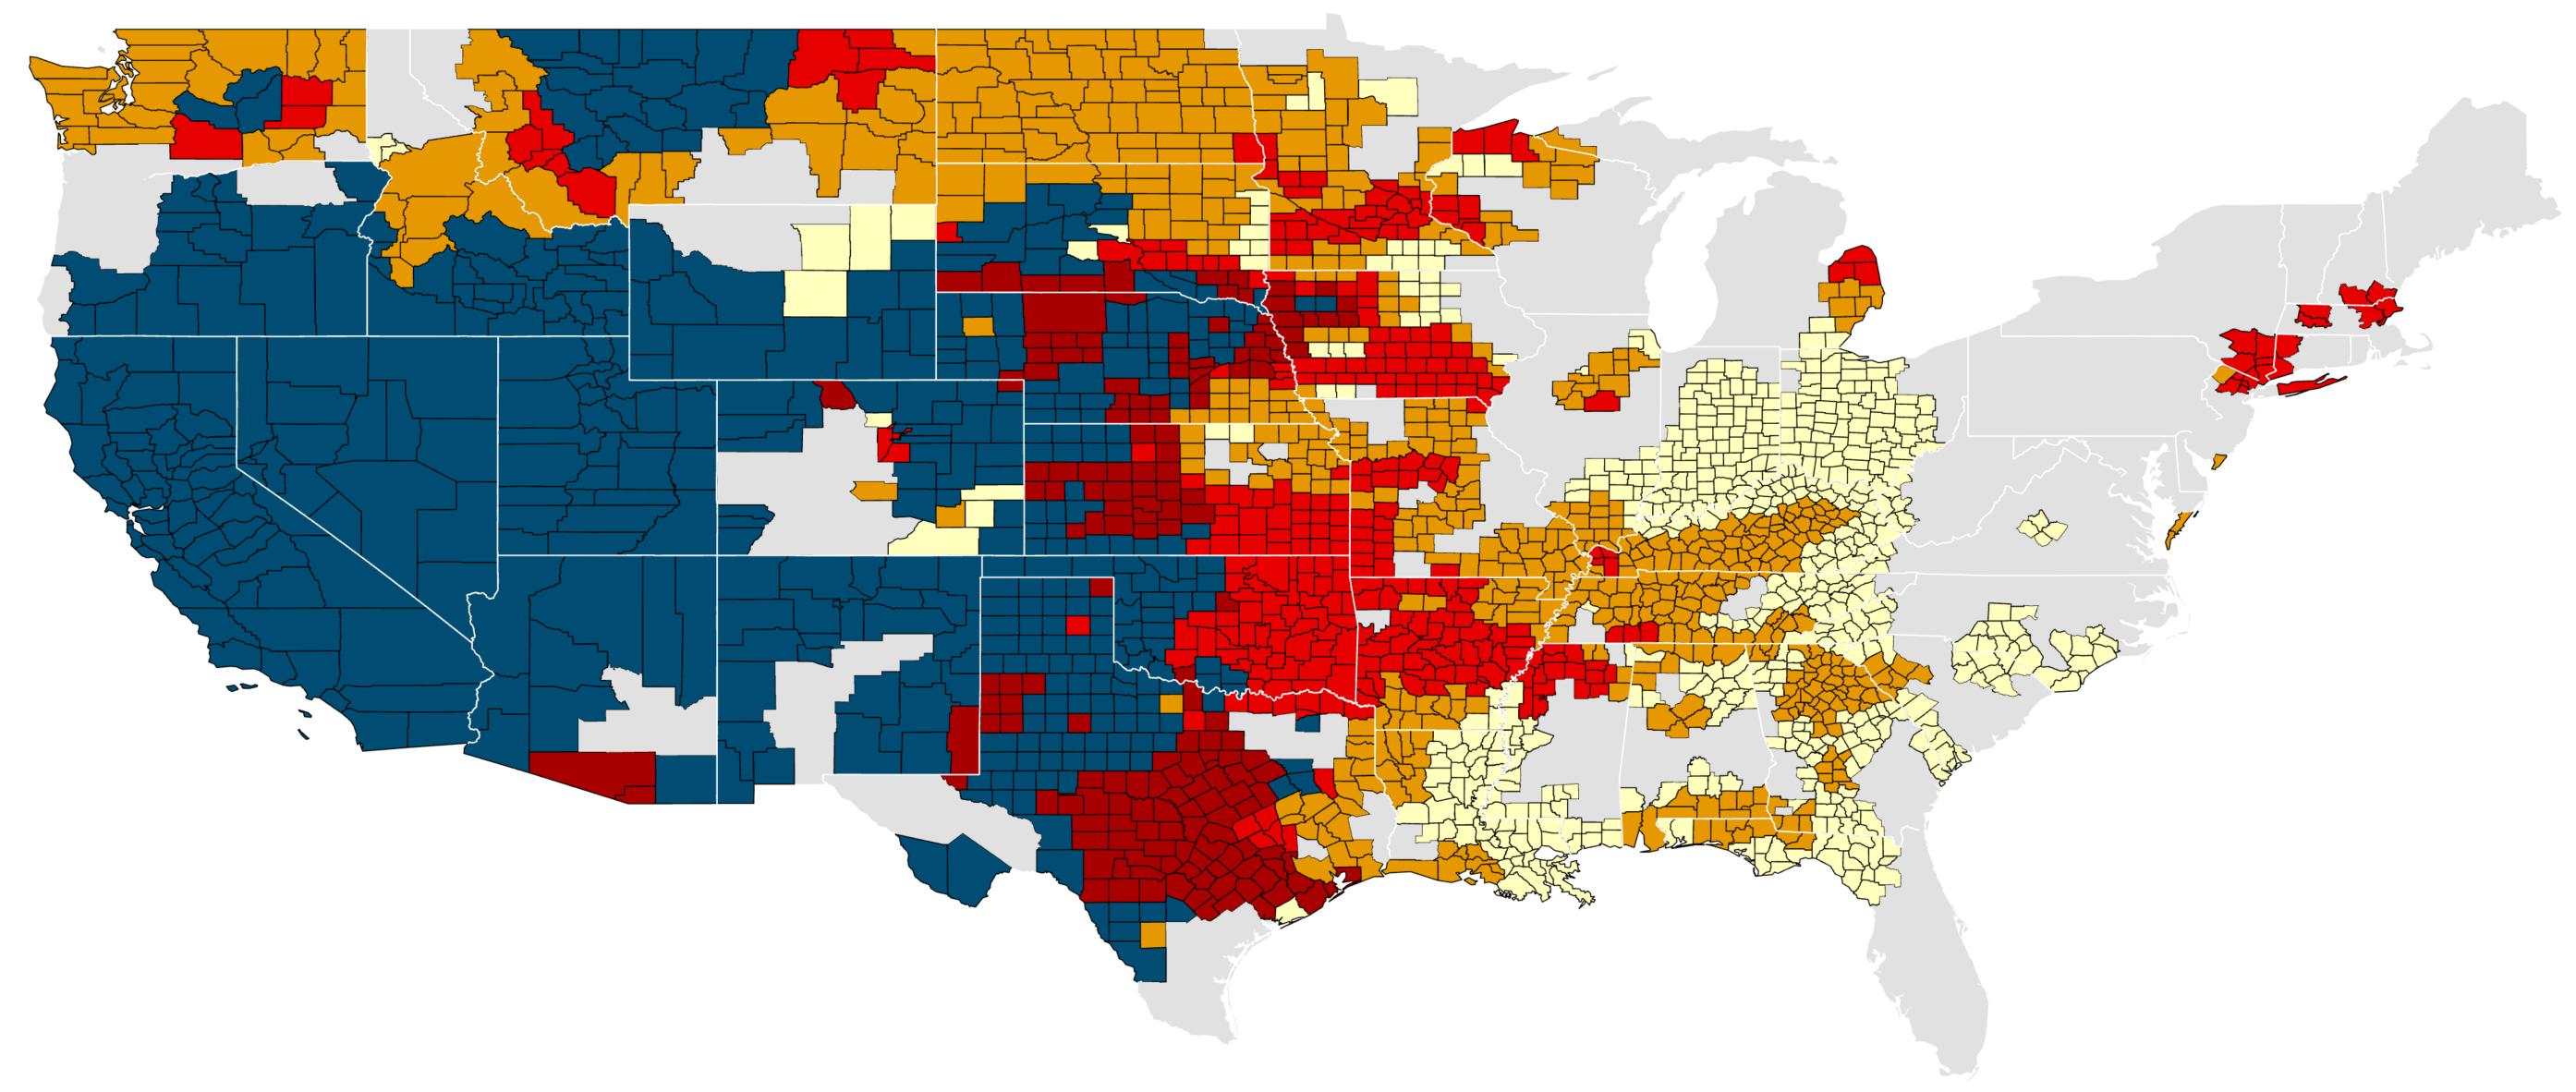
Senate Ag GOP Analysis, USDA FSA Less than 25% 25% to 50% 50% to 75% 75% to 90% Greater than 90% Percent
Food Supply
Exposure
Natural
Frequency of USDA Disaster Declarations, 2012 to 2021


Ag
Duration Of The Current Drought Consecutive Weeks Of D1 (Moderate) Drought Or Worse, As Of November 8, 2022 Senate Ag GOP Analysis, U.S. Drought Monitor 0 1 to 2 Weeks 3 to 10 Weeks 11 to 26 Weeks Consecutive Weeks 27 to 52 Weeks Greater Than One Year
Senate
Committee Republicans
Mississippi River At Memphis Water


-10 0 10 20 30 40 50 31 61 91 121 151 181 211 241 271 301 331 361 Senate Ag Committee Republicans
Level Memphis Gage Height, Feet Senate Ag GOP Analysis, USGS, National Weather Service Minimum and Maximum Range From 2015 to 2021 2022 Day Of The Year Projection The Agreed-Upon Benchmark Water Level

Senate Ag Committee Republicans Federal Crop Insurance Program Farmer Premiums, Federal Cost-Share, and Total Indemnities, Million Dollars Senate Ag GOP Analysis, Congressional Budget Office -$5,103 $4,598 $3,945 -$3,763 $3,725 $3,712 $3,734 -$3,774 $3,808 $3,809 $3,813 -$3,802 $8,580 -$7,845 $6,683 -$6,353 -$6,290 $6,270 -$6,310 -$6,379 $6,440 $6,443 -$6,460 $6,451 $11,631 $10,577 $9,033 $8,599 $8,513 $8,485 $8,537 $8,630 $8,711 $8,714 $8,732 $8,715 $(15,000) $(10,000) $(5,000) $$5,000 $10,000 $15,000 2021 2022 2023 2024 2025 2026 2027 2028 2029 2030 2031 2032 Farmer Premium Federal Cost-Share Indemnity


Senate Ag Committee Republicans Senate Ag GOP Analysis, Congressional Budget Office Conservation Reserve Program, $25,160 , 41% Environmental Quality Incentives Program, $19,373 , 32% Conservation Stewardship Program, $9,180 , 15% Agricultural Conservation Easement Program, $4,385 , 7% Regional Conservation Partnership Program, $2,690 , 5% Government Conservation Efforts Projected Conservation Program Outlays , CBO May 2022 Baseline, 2023 to 2031, Million Dollars


Senate Ag Committee Republicans Government’s Expanded Role In Climate $40B In Agriculture Funding In Inflation Reduction Act, Million Dollars Senate Ag GOP Analysis, Congressional Budget Office Conservation, $18,470 , 44% Rural Development, $13,277 , 32% Forestry, $5,000 , 12% Debt Relief, $5,029 , 12% E.g.: Increased Funding for Farm Bill Programs Such As EQIP, CSP, RCPP, and ACEP With An Emphasis On Carbon Sequestration E.g.: Debt Relief For At-Risk Borrowers & Support For Underserved Producers E.g.: Hazardous Fuels Reduction Projects E.g.: Assistance For Rural Electric Cooperatives To Invest In Renewable Energy


Senate Ag
U.S. Agriculture Is Successful Percent Of Total GHG Emissions By Economic Sector in 2020 (Agricultural Categories Based on IPCC Totals) Senate Ag GOP Analysis, EPA 27% 25% 24% 14% 10.0% 5.3% 2.3% 1.4% 0.5% 0.3% Transportation Electricity Generation Industrial Sector Commercial, Residential & Territories All Agriculture Agricultural Soil Management Beef Production Milk Production Pork Production Rice Cultivation 10% Agriculture’s Share Of U.S. GHG Emissions
Committee Republicans
Consistently Improving Soil Health

No-Till and reduced till are the top land use practices with more than 200 million acres. Maintenance and fuel costs savings possible, but could increase weed management and disease risk.

Senate Ag Committee Republicans
Senate Ag GOP Analysis, USDA NASS
Soil Management Practices, Million Acres, 2017
2
3
4 202 15 13 80 56 4450 100 150 200 250 No-Till or Reduced Till Cover Crop Conservation Easement Conventional Land Drained by Tile Land Articifically
There were more than 15 million acres of cover crops planted in 2017. Cover crops have an upfront cost with seed and planting, may reduce fertilizer & herbicide costs if successful.
Conventional soil management has fallen by more than 25 million acres since 2012.
Drained
1
Voluntary environmental credit markets are being developed to help farmers offset costs for new practices to mitigate emissions and sequester carbon.


Senate Ag Committee Republicans Successful Efforts Occurring In Private Sector Anaerobic Digesters Operating on U.S. Livestock Farms Senate Ag GOP Analysis, EPA -50 0 50 100 150 200 250 300 2000 2001 2002 2003 2004 2005 2006 2007 2008 2009 2010 2011 2012 2013 2014 2015 2016 2017 2018 2019 2020 Operational 1/ Newly Operational 2/ Shut Down 1 Data provided in the table for Operational digester projects are inclusive of Newly Operational digester projects. 2 Newly Operational digester projects are projects that began processing feedstock in the corresponding calendar year. The marketplace has helped to bring more than 260 methane digesters online to help destroy methane. 5% of methane emissions destroyed annually. 1 2 Would government standard setting, i.e., market protocols or soil carbon sequestration, or other intervention be beneficial or stifle innovation? Considerations:
Measuring


Senate Ag Committee Republicans
Senate Ag GOP Analysis, USDA NASS, EPA Beef Cattle Enteric Fermentation, MMTCO2e 105 110 115 120 125 130 135 140 1990 1995 2000 2005 2010 2015 Grain Consuming Animal Units, Million Animal Units Measuring livestock-based emissions can be difficult. Reasons
operation
cow-calf
feedlot, measurement type,
1 How
productivity
feed additives,
milk per
yield
2 60 70 80 90 100 110 Measuring
3
And Verifying Is Difficult
include
type, e.g.,
vs.
e.g., actual or modelbased.
does the change in livestock
using
e.g.,
cow or
per mature animal, balance with the need to add more grain consuming animal units.
and verifying carbon sequestered on farms or GHG emissions associated with certain agriculture is not only difficult, it can be costly. Who makes these investments in the supply chain? In many cases it is pushed down the supply chain to the farmer or rancher. Economic sustainability is key.
Considerations:
What About Additionality?


Acres
0

Less than or equal to 1,000
1,000 to 5,000
5,000 to 10,000
Greater than 10,000
Ag
Senate
Committee Republicans
Senate Ag GOP Analysis, USDA FSA
Cover Crop Acres Planted In 2021
Farm


0.9 1.4 1.9 2.4 2.9 1948 1949 1950 1951 1952 1953 1954 1955 1956 1957 1958 1959 1960 1961 1962 1963 1964 1965 1966 1967 1968 1969 1970 1971 1972 1973 1974 1975 1976 1977 1978 1979 1980 1981 1982 1983 1984 1985 1986 1987 1988 1989 1990 1991 1992 1993 1994 1995 1996 1997 1998 1999 2000 2001 2002 2003 2004 2005 2006 2007 2008 2009 2010 2011 2012 2013 2014 2015 2016 2017 2018 2019 Senate Ag Committee Republicans
Productivity
Indices of farm outputs and inputs for the United States, 1948-2019, (1948 = 1) Senate Ag GOP Analysis, USDA ERS Total Livestock Output Total Farm Inputs Total Crop Output
Helps Conserve Resources


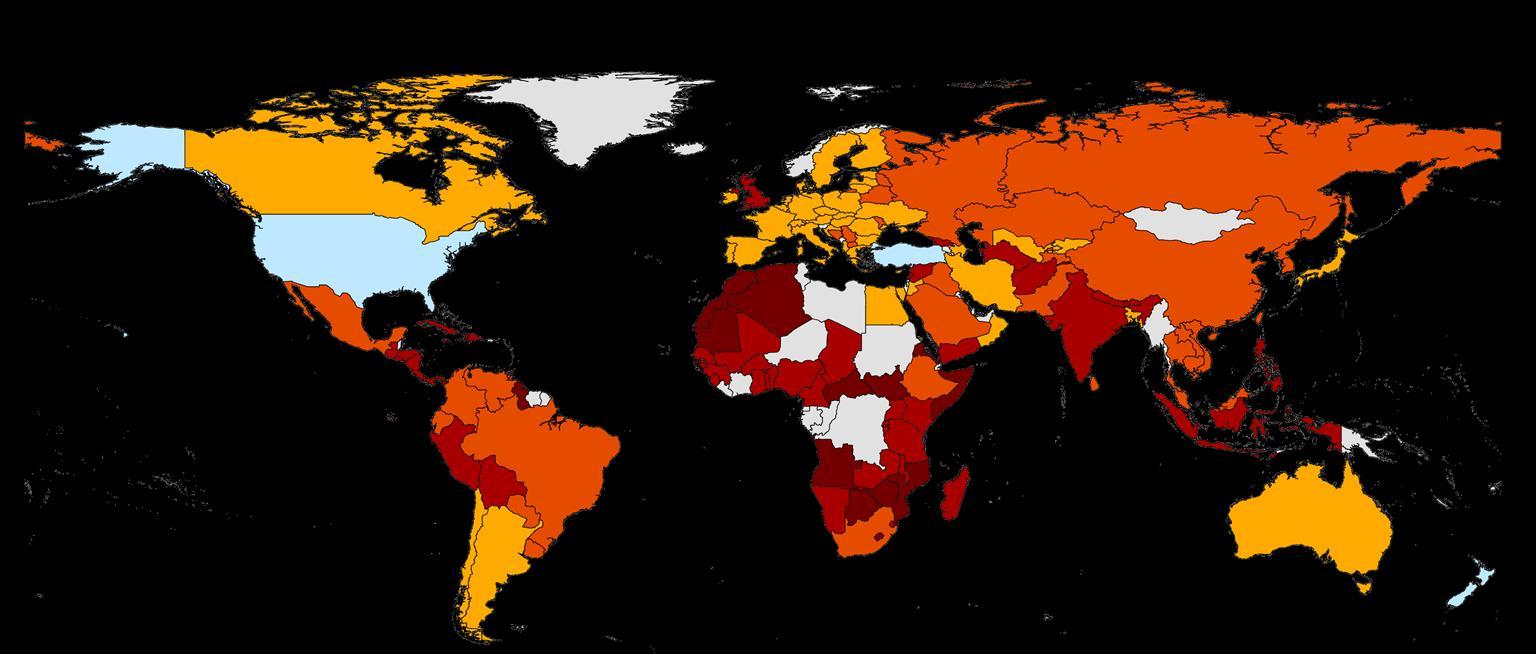
Senate Ag Committee Republicans Working Lands Conservation, Keep U.S. Farmland In Farming Acres Needed To Match U.S. Corn Production Per Acre Senate Ag GOP Analysis, USDA FAS PSD Online, Based on 2021/22 and 2022/23 Yield Estimates No Data Less than or equal to 1 Acre 1 Acre to 1.75 Acres 1.75 Acres to 3 Acres 3 Acres to 10 Acres China 1.76 Acres Canada 1.1 Acres EU-27 1.54 Acres Japan 1.47 Acres South Korea 2.11 Acres Acres Needed Mexico 2.87 Acres Brazil 2.03 Acres Colombia 2.77 Acres More Than 10 Acres Russia 2.04 Acres Ukraine 1.54 Acres India 3.38 Acres Australia 1.47 Acres


SNAP, $1,104 , 1.44% Crop Insurance, $80 , 0.10% Farm Income Support, $71 , 0.09% Conservation, $59 , 0.08% Social Security, $17,288 , 23% Medicare, $14,287 , 19% Medicaid, $6,437 , 8% Defense, $8,969 , 12% Other Discretionary, $11,158 , 15% Other Mandatory, $9,147 , 12% Net Interest, $8,075 , 10% Senate Ag Committee Republicans Food & Conservation Is A Small Share Of Spending Billion Dollars, Fiscal Year 2023 to 2031, Total Spending $76.7 Trillion Senate Ag GOP Analysis, Congressional Budget Office 1.7% Federal Spending On Farm & Nutrition Programs


