5 minute read
CATTLEFAX TRENDS


UNDERSTANDING THE CATTLE CYCLE
The IBBA is proud to bring you the CattleFax Trends Publication. Look for this article each month in the Brangus Journal and Frontline Beef Producer. If you would like to learn more about CattleFax, please go to www.cattlefax.com.
Price is a function of two variables – supply and demand. Predicting demand in the beef industry is no easy task. Although, one must assume demand will remain strong for the foreseeable future after its performance during the pandemic. There are several components that makes forecasting the supply side of the equation less challenging. Currently, most factors point to a smaller beef cowherd the next two to three years. Fluctuations in cow numbers is a key variable that creates cattle cycles and ultimately calf price trends. Historical data can provide some context regarding what to expect with the cowherd in the early stages of contraction.
Profitability and/or grazing resources drive producers’ decisions about whether to expand or contract the cowherd. For example, margins were very tight for the cow-calf segment in the 1980s. After two consecutive years, 1981 and 1982, of being in the red, a steep downtrend in cow inventory began in earnest in 1983 and did not end until 1990. The last few years of that cycle were also fueled by very intense drought conditions. Financial losses during the mid-1990s caused the cowherd to peak in 1996 before contracting into the early 2000s. Record profits, up to that point, from 2004 to 2006 ended liquidation and numbers grew slightly. This was followed by declining profitability and severe drought early in the last decade that resulted in a beef cow inventory that dropped to the lowest levels in over 40 years. This allowed for the highest cattle prices in history and record profitability in 2014 and 2015.


(continued from page 60)
Since supply dictates half of the price equation, price patterns naturally develop with changes in the cowherd size. The accompanying chart shows that there is basically an inverse relationship between price and supply. Looking closer at the price trends, a consistent cycle is noted. The elapsed time from high to high and low to low is roughly 10 to 12 years. The calf market came off a high in 1979 to 1980 and made another annual peak around 1991. The early 2000s threw a head fake and stretched the interval out slightly longer to the next high in 2005. However, the most recent cycle high, 2014 to 2015, returned to the historical pattern of 10 to 12-year intervals. The first major low in the past 40 years occurred in 1986 followed by a bottom in 1996 into 1997. The next low was about 12 years after the previous in 2008 to 2009. 2020, averaging $159/cwt for 550-lb. steers, will mark the current cycle low which is 11 to 12 years later. Strictly based on the historical sequence, the calf market should trend higher at least through 2024 to 2025 – 10 years after record prices.
Another thing that can be gleaned from the long-term prices is how the spread between segments changes depending on the stage of the cycle. When prices are at their lows, the calf to feeder and calf to fed spread narrows significantly. At a cycle bottom in 1986, calves averaged 11% higher than fed cattle, and 1996 they were at a discount to fed prices – corn prices were a major factor. In 2008 and 2009, calves had a 23 and 29 percent premium. The narrower spreads compare to a 46% spread at the 2005 high, and the calf to fed premium in 2014 and 2015 was 57% and 69%, respectively.
The reason for the wide spreads near cycle peaks is due to leverage between the segments shifting to those at the beginning of the supply chain. If feedyard bunk space is constant, but the calf and feeder cattle supply shrinks, competition increases causing prices to rise. When calf and feeder supply is abundant relative to bunk space, like the past few years, retaining ownership becomes a common practice. Because the cowherd is projected to contract the next few years, cow-calf producers will likely be better off selling calves compared to owning them through the backgrounding/ stocker or feeding phase. It is still important to evaluate this strategy each year, and your decision will depend heavily on your cost structure.
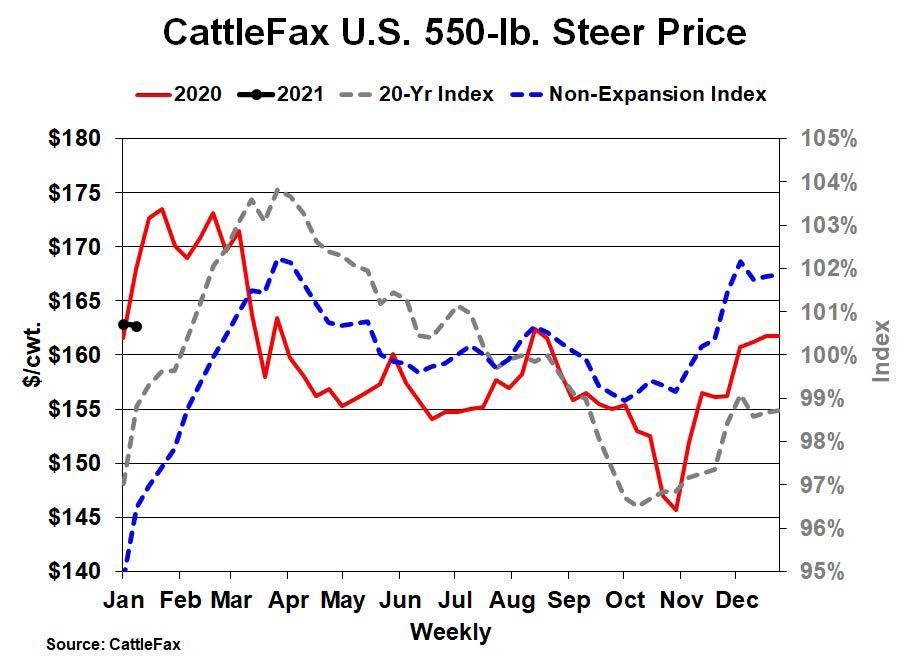
Historical cattle cycles can also provide insight about calf market trends during a calendar year. By classifying “expansion” years, those that see a year-over-year increase in the cowherd, and “non-expansion” years, when the cowherd declines, seasonal indexes can be built. The accompanying chart compares the long-term seasonal pattern (20-Yr Index) versus the non-expansion analog years (Non-Expansion Index). There are two main differences between the indexes. In non-expansion years, the spring rally falls short relative to the long-term index. In the second half of the year, nonexpansion years, on average, do not get as cheap during the fall run and end the year much closer to the spring peak. Since the index is essentially an average of the historical price pat-terns, there is variation around the lines on the chart. Nonetheless, 2021 could follow very close to the Non-Expansion Index. High grain prices and potentially dry conditions due to the La Niña weather pattern may limit demand and the spring rally. Because of the smaller expected calf crop, and if major winter grazing regions receive abundant, timely rains, the fall low may not have to get as deep. Early projections are for the calf market, basis the U.S. average 550-lb. steer price, to average $168/ cwt in 2021, with the fall low about $10 to $15 above 2020. After cow numbers peaked in 2019, the current cattle cycle is in the early stages of contraction, with a modest decline expected to continue for two to three years. Consequently, last year will mark the cycle low in annual calf prices. The market should trend higher, leading to improved profitability and top in the middle of the decade – following the historical cattle cycle pattern.