

Thank you to the residents of the City of Greenville, elected officials, the City Manager’s Office, Recreation and Parks Commission Board Members, Recreation and Parks Department Staff, and stakeholders for your participation in interviews, workshops, and surveys. This feedback was critical in the creation of a master plan that will serve as a guide for the future of recreation and parks in the City of Greenville.
City Council Recreation and Parks Commission Board
Mayor P.J. Connelly
District 1 Council Member, Monica Daniels
District 2 Council Member, Rose H. Glover
District 3 Council Member, Marion Blackburn
District 4 Council Member, Rick Smiley
District 5 Council Member, Les Robinson
Council Member At-Large, Will Bell
Ann E. Wall, City Manager
Michael Cowin, Deputy City Manager
Ken Graves, Assistant City Manager
Kimley-Horn
Ballard*King
ETC Institute
Adopted: May 8, 2023
City of Greenville Recreation and Parks Department
2000 Cedar Lane, Greenville, NC 27858
www.greenvillenc.gov
Chair: Gordon Darragh
Vice-Chair: Darin White
Derrick Clark
Deborah J. Sheppard
Montez Bishop
Najiyyah Lewis
Kevon Gainer
Joel Sweeney
Recreation and Parks Department
Don Octigan, Director
Darris Sawyer, Superintendent
Dennis Vestal, Superintendent
Heather White, Superintendent
Mark Nottingham, Parks Planner
Courtnee McGrath, Administrative
This document has been prepared by Kimley-Horn on behalf of the City of Greenville Recreation and Parks Department. Reproduction or distribution of this document and its contents are prohibited without approval of the City of Greenville Recreation and Parks Department. All contents of this document are the property of the City of Greenville, NC
All pictures and images are property of the City of Greenville, NC.


To advance parks, recreation, and environmental conservation efforts that promote mental and physical health, serve as a deterrent to illegal or inappropriate behaviors, and enhance Greenville’s quality of life.
We envision our department as being a viable and recognized force in positively impacting the health, economy, natural environment, and well being of the Greenville community and its people.


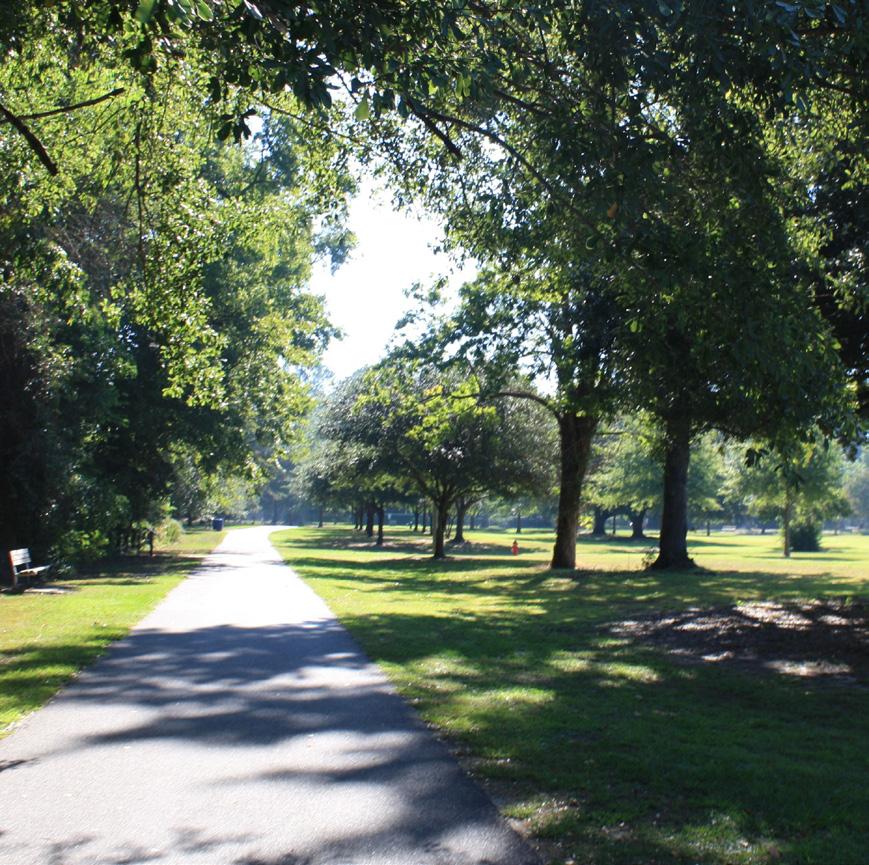


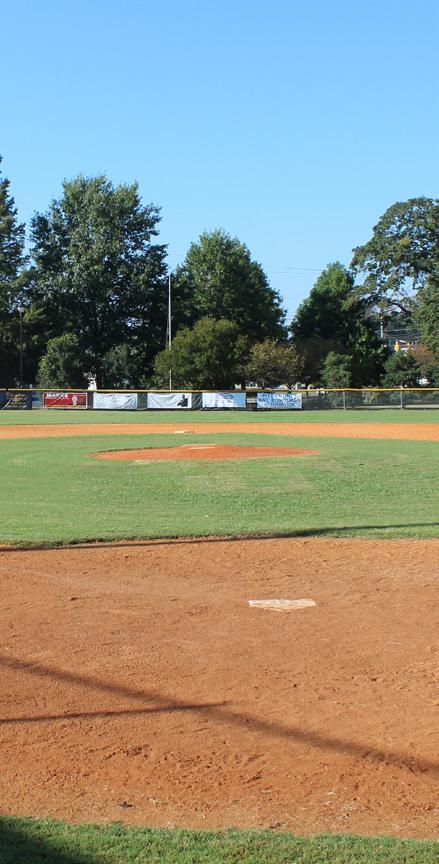
The purpose of recreation and parks master planning is to create well-designed, functional, and sustainable parks and recreation facilities that meet the needs of residents and visitors. This type of planning aims to balance the demands for healthy lifestyles, environmental protection, social equity, and cultural preservation. Master planning involves the strategic allocation of services and infrastructure to help ensure efficient use of resources, minimize environmental impacts, and foster healthy and livable neighborhoods. The ultimate goal of recreation and parks planning is to create communities that are safe, accessible, and enjoyable places to live, work, and play for all residents.
This recreation and parks master plan was developed as an update to Greenville’s prior 2008 master plan. Over the last 15 years, incredible changes have occurred including multiple recessions, tremendous growth, and a global pandemic. Through these impacts, needs and priorities for recreation and parks have evolved. This planning process was structured to identify current needs and priorities as well as project needs over the next 10 or more years.

This master plan is intended to be referenced regularly to identify community needs for parks and recreation facility development and investment, align goals with other community-wide goals, and gauge progress towards meeting community needs.
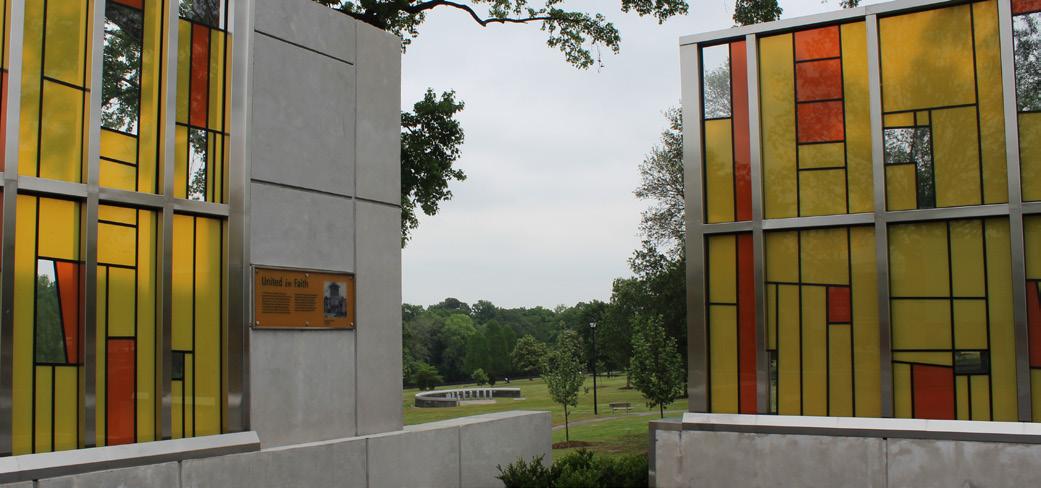
During and after the COVID-19 pandemic, support for public parks in the United States significantly increased. As people spent more time at home, many looked for ways to stay active and maintain their mental health. The importance of parks as a community resource has become more apparent. This has led to an increase in both public awareness and funding for parks. Many communities have recognized the role that parks play in promoting health and well-being, and have advocated for increased funding to support park maintenance, programming, and access.
Additionally, the pandemic highlighted the disparities in access to parks and green space in low-income and marginalized communities in many cities. This led to calls for more equitable distribution of park resources and funding, as well as efforts to create new parks and improve existing ones. Furthermore, many local governments and private organizations stepped in to support public parks as an outcome of the pandemic. These organizations have provided additional funding, volunteers, and resources to help maintain parks and ensure that they remain safe and accessible for all visitors. This increased support for public parks has helped to ensure that these valuable community resources are able to continue to serve the needs of the public.
The Benefits of Recreation and Parks: The benefits associated with recreation and parks have been well studied over the last few decades. Some of the most well documented benefits include:
1. Promoting Physical and Mental Health: Parks are essential for promoting physical and mental health. Regular exercise in parks has been linked to reduced risk of chronic diseases like obesity, heart disease, and diabetes. Additionally, parks offer a serene and peaceful environment, which can provide mental health benefits such as reduced stress, anxiety, and depression.
2. Enhancing Environmental Sustainability: Parks are crucial for enhancing environmental sustainability. They serve as natural buffers against climate change, absorb carbon dioxide emissions, mitigate the impacts of air and water pollution, and reduce urban heat island effects. Parks provide habitats for wildlife, promote biodiversity, and protect natural resources such as water, soil, and vegetation. Parks also are excellent for stormwater management by acting as sponges during large storm events and disasters.
3. Providing Economic Benefits: Parks provide economic benefits to the communities
they serve. They generate revenue for local businesses and create jobs in the areas of park maintenance, tourism, and recreation.
4. Fostering Social Cohesion: Parks play an essential role in fostering social equity and promoting community inclusion. They provide a space for people to come together, build relationships, and participate in community events and activities.
5. Preserving Cultural Heritage: Parks can help preserve cultural heritage and promote cultural identity. Parks can also be used to celebrate cultural events and traditions, promoting cultural awareness and understanding
6. Increasing Property Values: Parks and green spaces can increase the value of nearby properties, which can help to attract new businesses and residents to the area.
7. Promoting Tourism: Parks can attract tourists to an area, which can boost the local economy through increased spending on lodging, food, and activities.


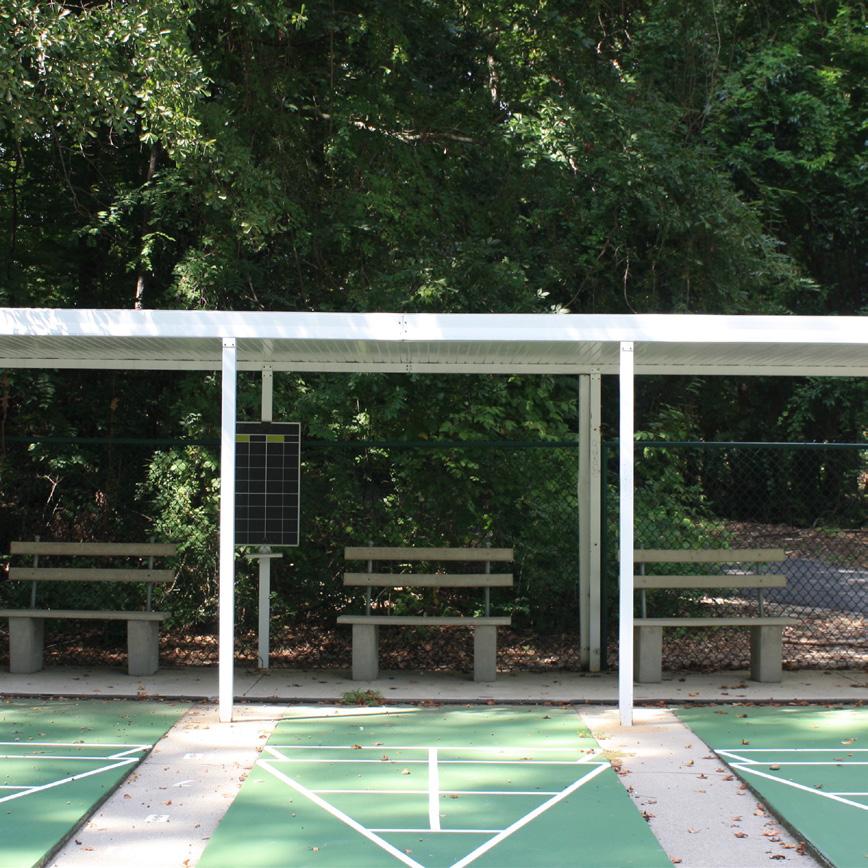


Previous efforts by the City of Greenville and its partner agencies have produced several plans and studies which form a base of knowledge and a vision that this master plan will seek to build upon. The section includes summaries of key plans, relevant goals, and strategies with specific applications for this master plan. The following reports and plans were reviewed upon the initiation of this master plan and again during implementation planning in order to leverage prior efforts by the City:
Prior Comprehensive Recreation and Parks Master Plan (2008)
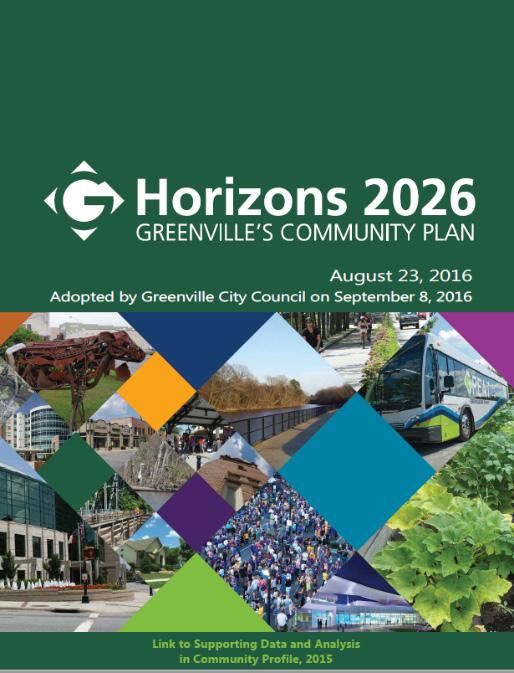
• Horizons 2026: Greenville’s Community Plan (2016 Comprehensive Plan)
Greenville City Council Goals and Priorities (2022 Update)

• Greenville Urban Area MPO’s 2045 Metropolitan Transportation Plan
Greenville Flood Land Reuse Plan (2004)
• Bicycle & Pedestrian Master Plan; Greenville Urban Area MPO
Active Transportation Plan; Greenville Area MPO
• Neuse River Basin Regional Hazard Mitigation Plan (2020)
Pitt County 2015 Comprehensive Recreation and Park Master Plan
• Pitt County Greenway Plan 2025
Pitt County Open Space Management Study (2001)
• Comprehensive Parks and Recreation Master Plan for Town of Winterville (2016)

• Winterville Greenway Master Plan
• Greenville’s Horizons 2026 Comprehensive Plan includes vision framework and sustainability themes which overlap with the benefits that parks and recreation provide.

• The implementation of the prior recreation and parks master plan (2008) was significantly hampered by lack of funding, particiularly the largest proposed source, $35 million in bond funding. Most unfunded capital projects from the 2008 master plan remain as needs today.
• Team and outdoor sports are most desired activities for youth (under age 17), while fitness, aquatic, and outdoor sports were primary desired activities for adults.
The City’s award-winning comprehensive plan was adopted in 2016 and serves as the primary long-range plan. The City has had a long history of developing communitydriven plans to guide growth and define their vision with the most recent version consisting of an update to the City’s prior Comprehensive Plan from 2010.
The long-range plan established two driving elements that combine vision with sustainability goals. The following are elements of each:

1. Building Great Places
2. Enhancing Mobility

3. Maintaining Fiscal Responsibility
4. Growing the Economic Hub
5. Creating Complete Neighborhoods
6. Fostering a Resilient City
7. Growing a Healthy City
8. Growing Together
1. Interwoven Equity
2. Resilient Economy
3. Strong Fiscal Responsibility
4. Livable Built Environment
5. Affordable Cost of Living
6. Harmony with Nature
7. Healthy Community
8. Responsible Regionalism
Parks and recreation have a particular role within Greenville to bring together each theme and framework of the long-range plan. The ability to advance the community’s vision and sustainability goals demonstrates the power parks and recreation provide residents. Investments within parks and recreation, therefore, provide a high level of return on investment through the advancement
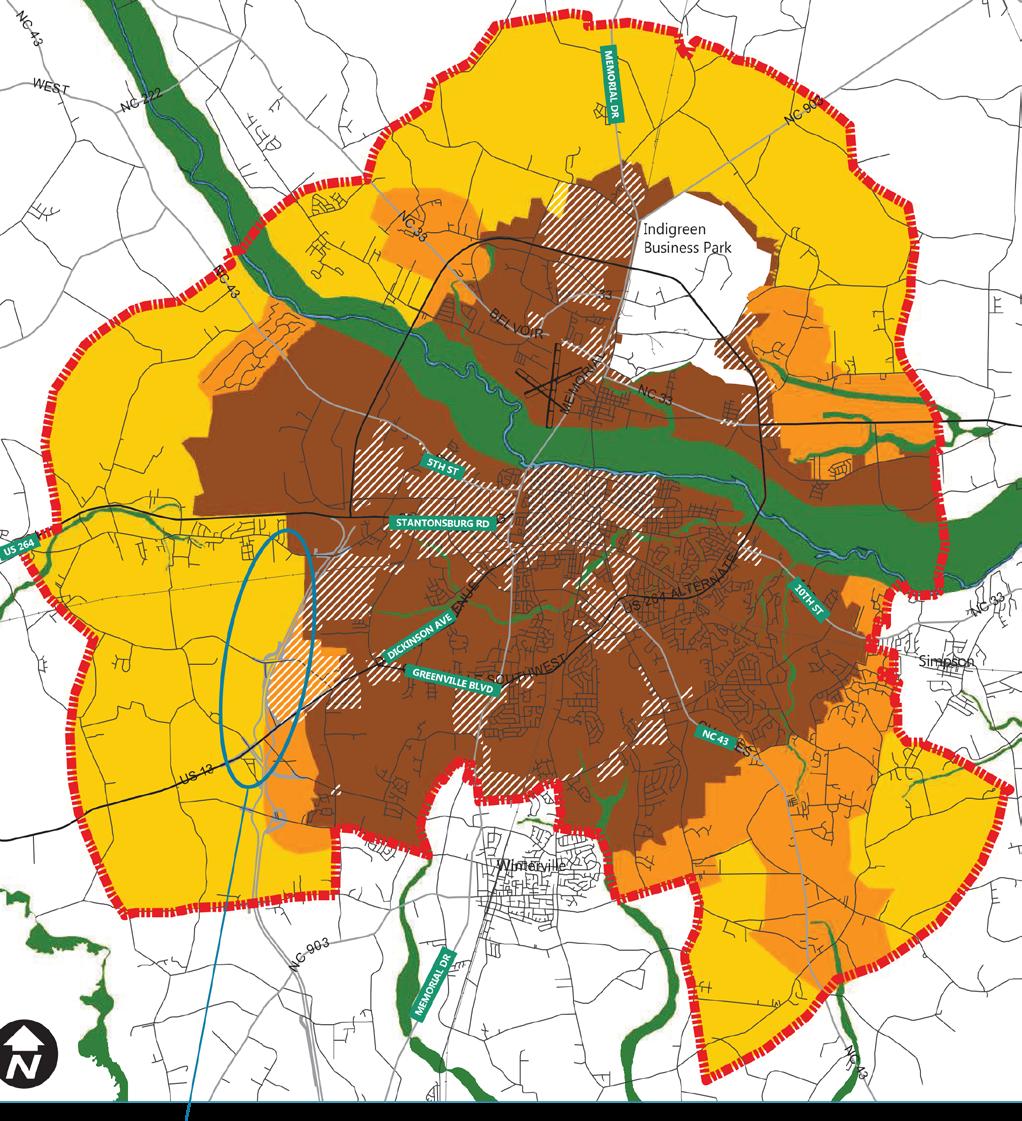
of many vision and sustainability goals. As a long-range vision document, Horizons 2026 provides a tiered growth plan (Map A1) for the City that identifies neighborhoods as primary, secondary, or future service areas. Furthermore, the plan includes an overlay for neighborhoods designated as Preferred Growth Areas. This information is important to the master plan for:
• Aligning future resources in designated growth areas
Identifying short-term and long-term growth areas
• Determining future search areas for acquisition of parkland

Adopted in 2008, the City’s prior recreation and parks master plan was an update from the 2000 master plan which had a 20-year horizon. Review of this plan was focused on success of implementation. The master plan included an implementation plan which recommended over $53 million in capital improvements, equal to nearly $75 million in 2023.
Historically, the Recreation and Parks Department (Department) has had challenges in obtaining ample funding to implement such a robust capital improvement program. On average, the Department has received funding for approximately 15% of total capital improvement requests. This compares to Public Works which on average receives 68% of capital project funding requests and Community Development which receives 58% of requested funding.
A significant amount of capital improvement recommendations remain unfunded from the 2008 master plan. Specific projects in the 2008 plan included:
Land acquisition in West Greenville of 50 acres for a new community park
Acquisition of land for six additional neighborhood parks:
West Central
• West
• South West
South Central
• South East East
• Acquisition of 14 sites for mini parks
• Development of an existing community park site in East Greenville
• Development of a new community park in West Greenville
• Development of seven new neighborhood parks
• Development of 14 mini park sites
• Development of a new recreation center
• Development of a new swimming pool
Development of a spray-ground
• Development of 10 miles of greenways
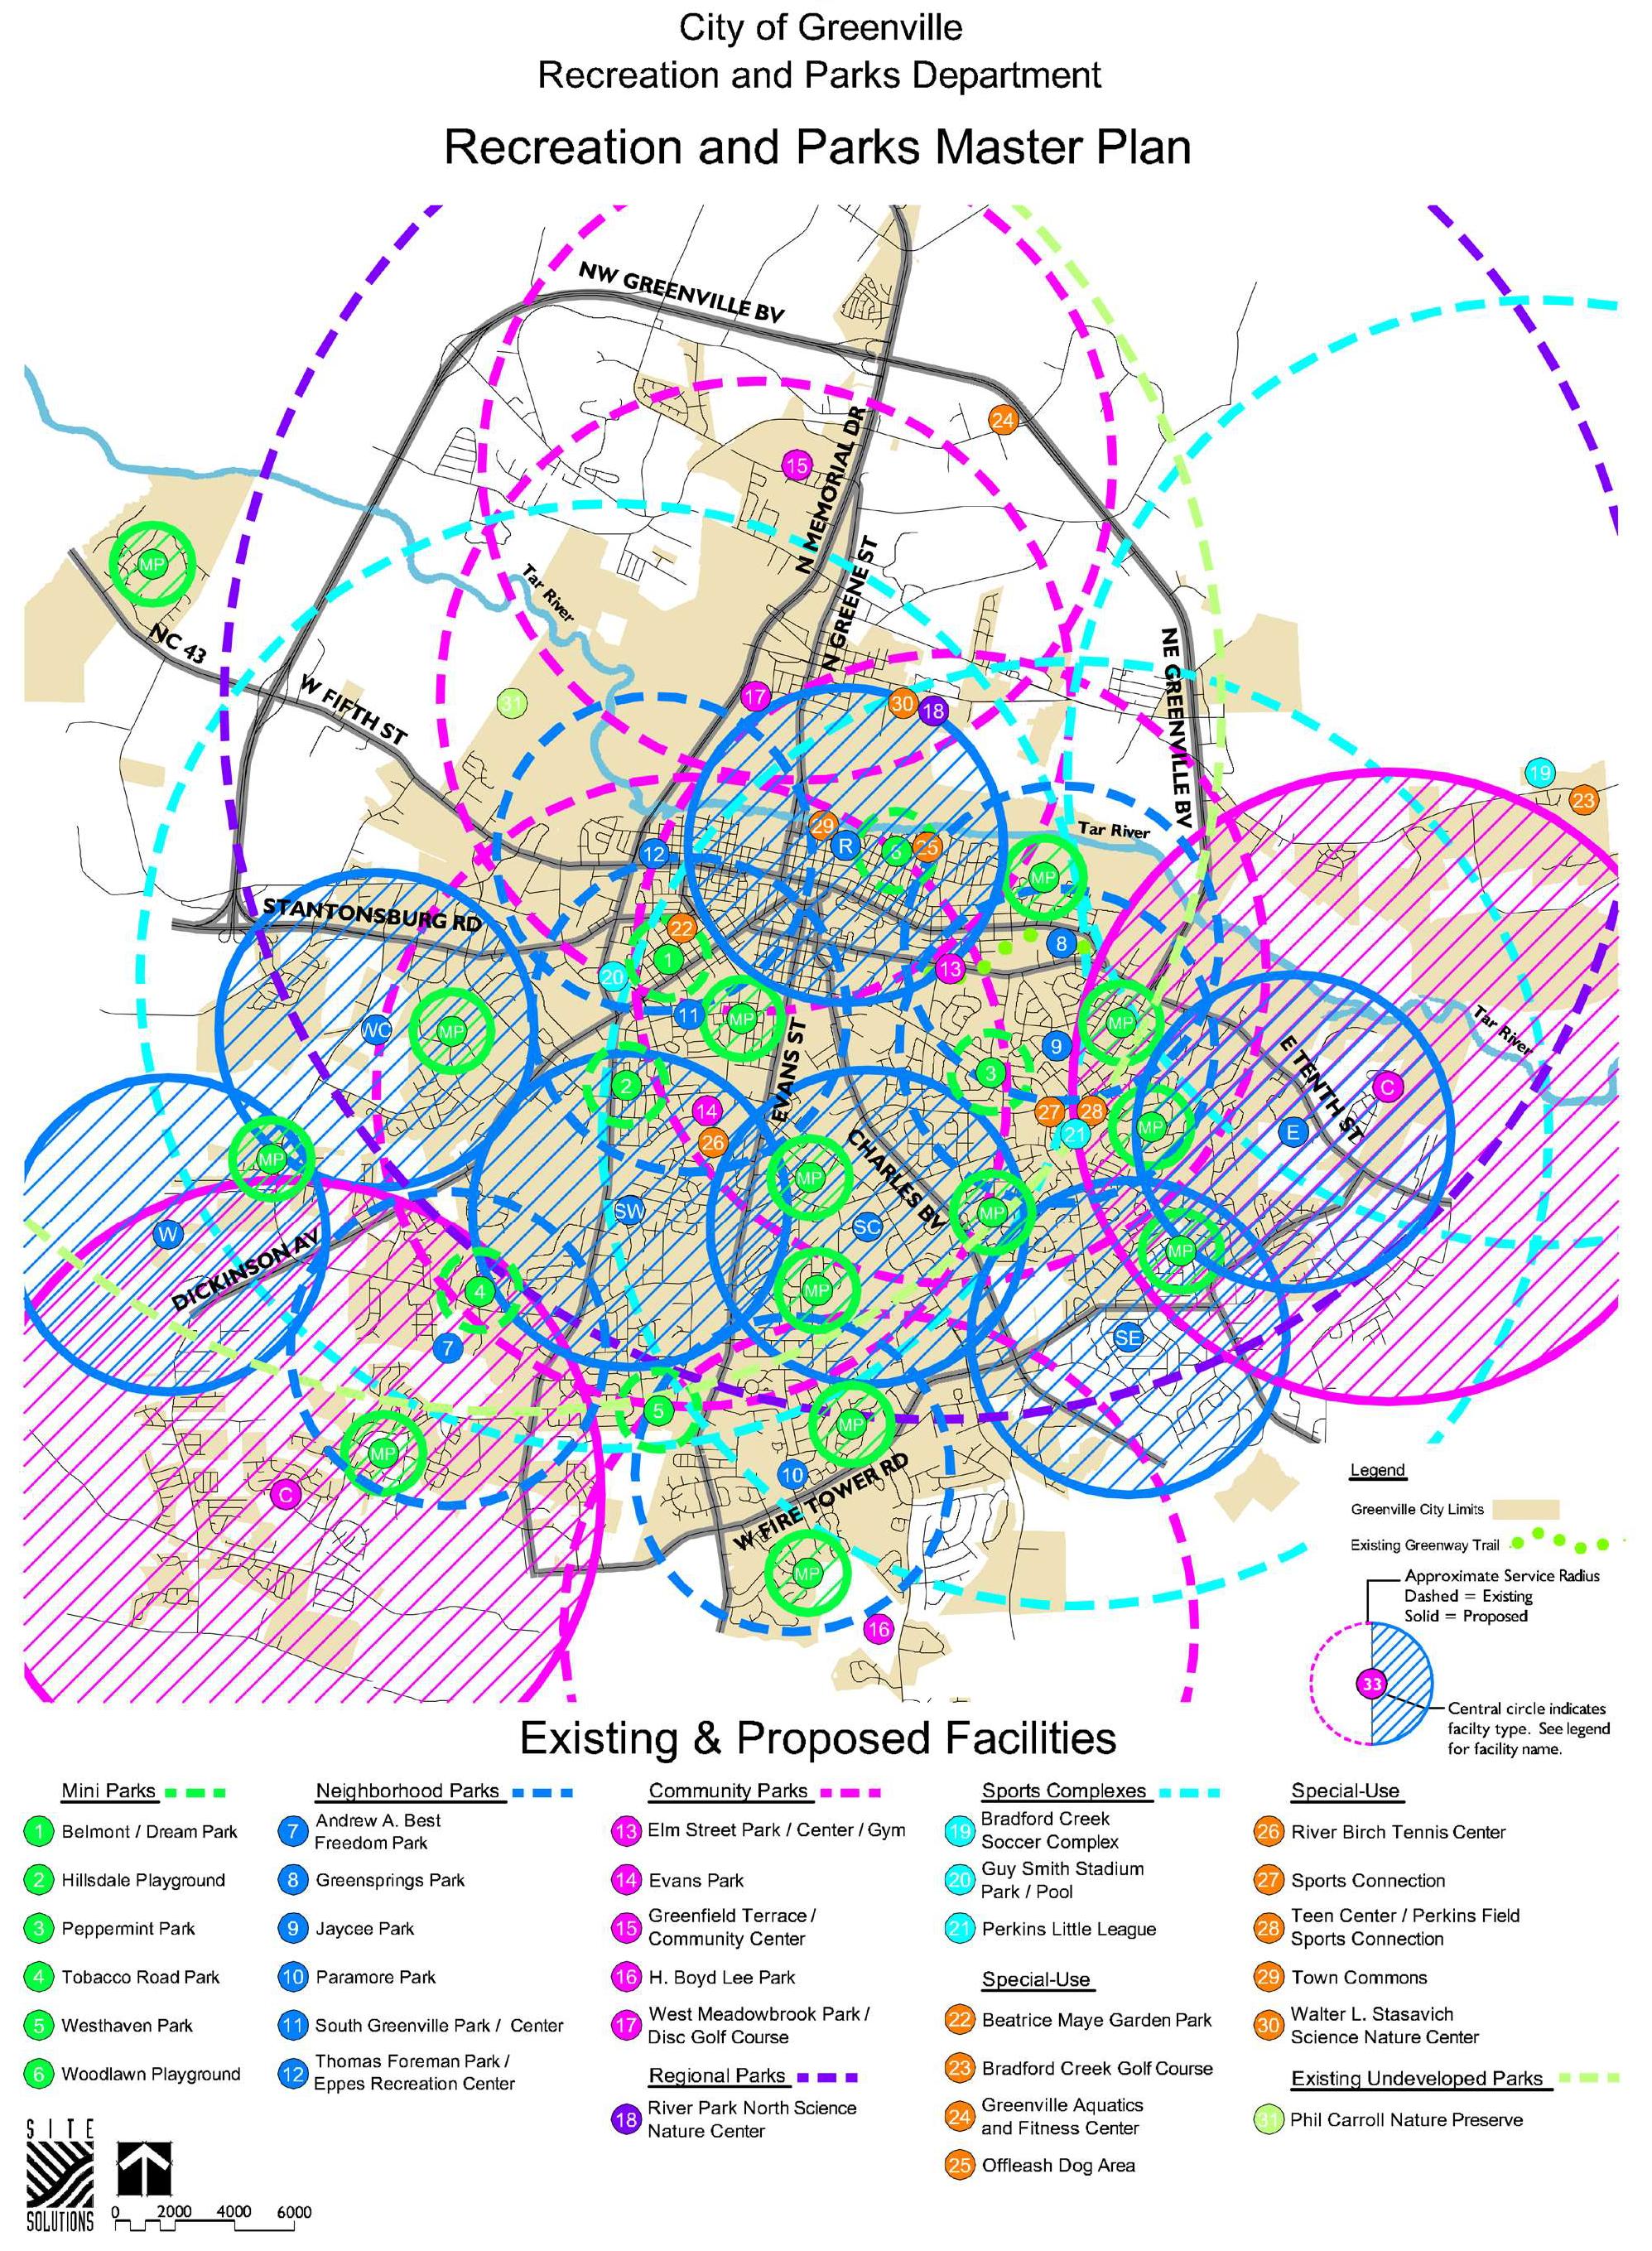
Unfortunately, most of the above recommended land acquisitions and park development projects (Map A2) have not been completed. Out of this list, a new neighborhood park (Westpointe Park)opened on the west side of the city, a renovated recreation center (South Greenville), and the City recently celebrated the opening of a new pool at Thomas Foreman Park. One primary challenge to the progress of the 2008 master plan capital projects was lack of funding. As noted earlier, the Department has historically received funding for a small portion of requested capital projects, averaging $800,000 annually. This amount matches the amount identified in the 2008 master plan’s implementation strategies, providing roughly $10 million over the 12-15 year period.
The largest proposed funding source included in the 2008 master plan, however, was $35 million in general obligation bonds (GOBs); followed by $2 million in user fees, $3 million in donations, $1.5 million in sponsorships, and $2 million in grants. Of all the proposed funding strategies, only the GOBs source was not realized. The fact that 2/3 of all proposed capital funding depended upon GOB that was not provided, greatly impacted the City’s ability to fully implement the 2008 master plan’s capital recommendations.

It is important to understand national trends with recreation and leisure interests and programming over the last ten years. However, an important note is that each community is unique and the region of the country has a bearing on trends and other operational factors.
Changing trends in recreation and leisure have resulted in an increase in demand, a desire for inclusiveness, a cost-effective approach to service delivery, and the need for

measurable outcomes. In an effort to respond to these trends, agencies have developed strategies to become more efficient and effective with the delivery of services, in order to respond to challenges unique to changing recreation needs. Table A3 identifies recreation and leisure activity trends nationally.
Trends in recreation, in addition to populationbased measurements, should be considered when identifying future programming needs for parks. A primary industry standard source for trend data includes the annual Sport & Fitness Industry Association (SFIA): Sports, Fitness, and Leisure Activities Topline Participation Report. The following summary includes data from the SFIA 2023 report.
Sports
Fitness/ Wellness
Youth lacrosse, adult soccer, adult cricket, youth/adult rugby, pickleball, youth camps/clinics, individual sports (fencing), adventure/non-traditional (BMX, mountain biking, disc golf, ultimate frisbee), youth sports specific training
Functional training classes, personal/ small group training, yoga, nutrition, healthy lifestyle education, drop-in pay as you go classes, more Saturday class, introduction of some Sunday classes
Cultural Music production for youth, digital media, programs oriented toward specific ethnic groups
Youth Before/After school programs at recreation centers (specifically summer camps), non-school day events, extended break events/programs.
Education Camps
Outdoor Eco-tourism, environmental education
Seniors Fitness/Wellness, Baby Boomer focused activities
Aquatics Therapy, triathlon training
General Interests Personal finance
Special Events
Family-oriented community-wide events; outdoor dining, farmer’s markets, movie nights, Halloween/ Christmas walks
The SFIA Topline Participation Report provides insight into which activities are most popular by age group and which are growing in popularity. An important note is that the 2023 edition of the report includes impacts to recreation participation during COVID. Understanding how trends have been impacted by the pandemic is vital to long-range planning and are included in this analysis.
In general, the national participation rate in sports and fitness activities continued to increase to 77.6% of all US residents over age six (6) in 2022. Though the national participation rate increased, activity rates by sports category (see list of categories on pg. 15) have experienced more fluctuation between 2017-2022 (Figure A4), with racquet sports (+23%) and outdoor sports (+12) with the most increase while individual sports (-10%) declined. Other sports categories such as fitness (+3), team sports (+2.6%), and water sports (+4.3%) experienced more modest growth. Relevant highlights include:
• Yoga (+10.4%) and Pilates (+11.6%) were the top increasing fitness sports in the last three years, while weight/ resistance machines (-17.1%) experienced the largest decline in participation.
• Basketball (+13.0%) and outdoor soccer (+9.3%) were the top team


sports that experienced growth while softball (-14.6%), rugby (-16.2%), and rollerhockey (-15.3%) had the largest declines in the last three years.
Skateboarding (+36.4%), trail running (+20.5%), golf driving range/indoor simulator (+56.9%) had the largest increase in participation for individual sports, while traditional triathlons (-11.0%) and bowling (-6.8%) declined.
• Sport and boulder climbing (+164.7%), tent camping (+32.8%), birdwatching (+23.4%), day-hiking (+19.9%), BMX bicycling (+14.6%), and road bicycling (+10.6%) experienced significant increases in participation since the impacts of COVID-19.
• Pickleball (+158.6%), tennis (+33.4%), cardio tennis (+12.4%), and badminton (+6.5%) experienced the largest increases while all racquet sports increased in participation rates in the last three years.
Surfing (+24.6%) and recreational kayaking (+19.1%) had the greatest level of growth for water sports, while canoing and snorkeling had the greatest number of participants.
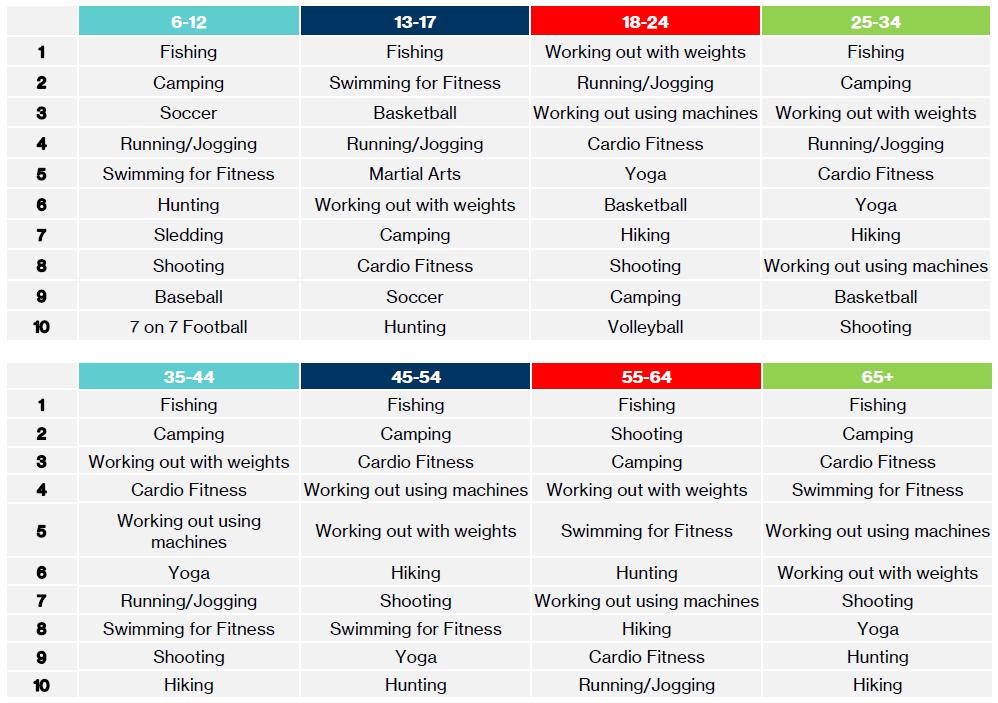
Historic participation levels provide an insight of past trends, while analyzing the sports and activities that non-participants would like to participate in can provide insight into future trends. Whether impacted by barriers to participation such as lack of access to facility, lack of programming, no transportation access, etc., Figure A5 illustrates the top activity each age group aspires to participate within the next 12 months.
• Across all age groups, except 18-24, the top aspired activity was fishing.
• Camping was the second most aspired activity for adults 25 and older as well as youth aged 6-12.
• Active recreation activities primarily populate the list for age groups under 17, while fitness, aquatic, and outdoor sports were primary desired activities for adults.
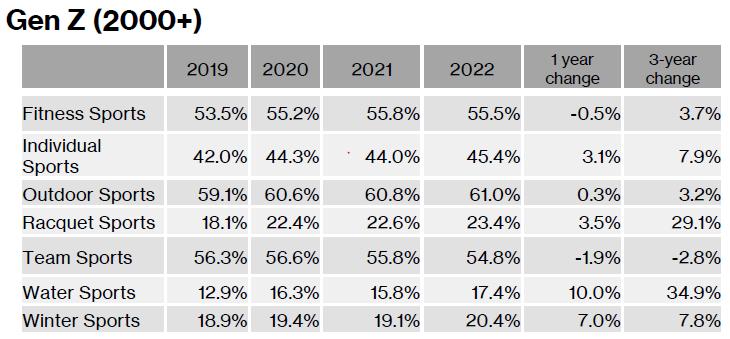
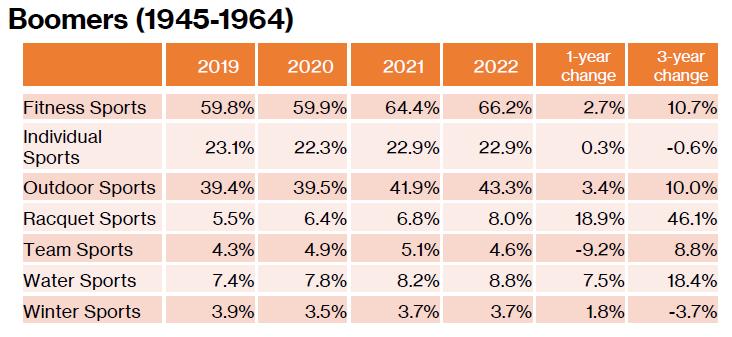
Participations trends were also analyzed by generations types, see Figure A6. Participation rates of population older than age six (6), as well as, one-year and three-year trends are identified. For the Boomer generation (19451964), the highest participation was in fitness (66.2%) and outdoor sports (43.3%), however, the highest growth was in racquet sports (+46.1%). For Gen X (1965-1979), fitness and outdoor sports remain the highest in overall participation rates, but trends indicate racquet sports (+30.2%), water sports (+23.5%), and team sports (+20.2%) experienced the largest growth. Millennials (1980-1999), participated in individual sports (43.4) at twice the rate of Boomers (22.9%), however, fitness and outdoor sports still remained the top two categories. Millennials increased participation in water sports (+25.2%) and racquet sports (+20.4%) the most in the last three years. Gen Z (2000+) participated most in outdoor sports (61%), followed by fitness (55.5%) and team sports (54.8%). For the youngest generation included in the study, Gen Z, the greatest growth in participation rates were experienced in waters sports (+34.9%) and racquet sports (+29.1%).
• The top two (2) most participated sport categories for every generation were fitness and outdoor sports.
Team sports participation rates were highest for Gen Z and Millennial generations.
Fitness sports and activities participation rate for the Boomer generation increased 10.7% and racquet sports participation increased 46%.
• Outdoor and team sports were the most participated categories for the 6-12 age group. Beyond age 12, fitness sports and activities had the most participation followed by outdoor and team sports.
Racquet sports was the top growth category for Boomers and Gen X and the second highest for Millennials and Gen Z.

Recreation and parks have played a critical role in advancing the goals outlined in many of the City’s guiding documents. Despite these roles, funding to grow and reinvest in existing parks and facilities has been limited. Requests for funding are typically provided at much smaller proportion when compared to other departments managing critical community infrastructure. Alternative funding sources such as GOBs have been utilized to advance capital projects throughout the city, but they have not included significant investment in parks and recreation facilities comparable to transportation or safety. Many of the unfunded
recommendations of the 2008 Master Plan are still needs today and will carry forward.
Highest growth trend has been in racquet (+23%) and outdoor sports or activities (+12%) such as rock climbing, BMX, birdwatching. Individual sports declined in participation, however, skateboarding (+36.4%), trail running (+20.5%), golf driving range/indoor simulator (+56.9%) have grown. Fishing and camping are the most desired activities for nonparticipants, while team and outdoor sports are most desired activities for youth (under age 17). Fitness, aquatic, and outdoor sports were primary desired activities for adults.


Sports Categories:
Fitness Activities: Aquatic Exercise, Barre, Bodyweight Exercise & Bodyweight Accessory Assisted Training, Boot Camp Style Training, Cardio Kickboxing, Cross-Training Style Workouts, Dance, Step, and Other Choreographed Exercise to Music, Elliptical Motion/Cross-Trainer, Barbells, Dumbbells/Hand Weights, High Impact/Intensity Training, Kettlebells, Pilates Training, Rowing Machine, Running/Jogging, Stair-Climbing Machine, Stationary Cycling (Group/Recumbent or Upright), Swimming for Fitness, Tai Chi, Treadmill, Walking for Fitness, Weight/Resistance Machines, and Yoga.
Individual Sports: Adventure Racing, Archery, Bowling, Boxing for Competition, Boxing for Fitness, Golf on a 9 or 18-hole Golf Course, Horseback Riding, Hunting (Bow, Handgun, Rifle, Shotgun), Ice Skating, Martial Arts, MMA for Competition, MMA for Fitness, Roller Skating (2x2 Wheels, Inline Wheels), Shooting (Sport Clays, Trap/Skeet), Skateboarding, Target Shooting (Handgun, Rifle), Triathlon (non-Traditional/Off Road, Traditional/Road).
Outdoor Sports: Adventure Racing, Archery, Backpacking Overnight, Bicycling Adventure Racing, Archery, Bowling, Boxing for Competition, Boxing for Fitness, Golf on a 9 or 18-hole Golf Course, Horseback Riding, Hunting (Bow, Handgun, Rifle, Shotgun), Ice Skating, Martial Arts, MMA for Competition, MMA for Fitness, Roller Skating (2x2 Wheels, Inline Wheels), Shooting (Sport Clays, Trap/Skeet), Skateboarding, Target Shooting (Handgun, Rifle), Triathlon (non-Traditional/Off Road, Traditional/Road).
Racquet Sports: Badminton, Cardio Tennis, Pickleball, Racquetball, Squash, Table Tennis, Tennis.

Team Sports: Baseball, Basketball, Cheerleading, Football (Flag, Tackle, Touch), Gymnastics, Ice Hockey, Lacrosse, Paintball, Roller Hockey, Rugby, Soccer (Indoor, Outdoor), Softball (Fast-Pitch, Slow-Pitch), Swimming on a Team, Track and Field, Ultimate Frisbee, Volleyball (Beach/Sand, Court, Grass), and Wrestling.
Water Sports: Boardsailing/Windsurfing, Canoeing, Kayaking (White Water, Sea/Touring, Recreational), Jet Skiing, Rafting, Sailing, Scuba Diving, Snorkeling, Stand-Up Paddling, Surfing, Wakeboarding, and Water Skiing.
Demographic trends can provide valuable insights for long-range planning by helping to identify potential shifts in population, age distribution, and other key factors that can impact a community or organization’s future needs and priorities. Analyzing population growth or decline can help the City to anticipate changes in demand, recreation programming, or amenities. Similarly, examining age distribution can inform decisions about new programming needs. By taking into account demographic trends, the City can better anticipate future challenges and opportunities and develop more effective strategies to meet the needs of residents.
The future remains bright for the City of Greenville when it comes to population growth. Between 2000 and 2010, the City enjoyed significant growth which plateaued in 2020. This slowdown in growth appears to be short lived as projections across all guiding documents point to long-term population growth. Figure B1 identifies estimates for population growth for both Pitt County and the City based on various tracks of projection by different guiding documents. For the purpose of this master plan, the City’s estimates based upon the Horizons 2026 Plan are utilized. For all projections regarding Pitt County, North Carolina Office of State Budget and Management (OSBM) information is cited. Greenville is projected to increase in population by over 14,000 residents, a 16%+
Greenville is projected to grow at twice the rate over the next decades as compared to previous decade.

• Additional population growth will necessitate additional parkland.
• Late teens and college aged youth (15-24 years old) are the largest age group in the city at 23.8% of all residents.
• Seniors, aged 65+, are the fastest growing age group in the city, nearly double the growth rate as the state average.
Neighborhoods are highly segregated; so there is an increased need to provide neighborhood-level unique offerings.
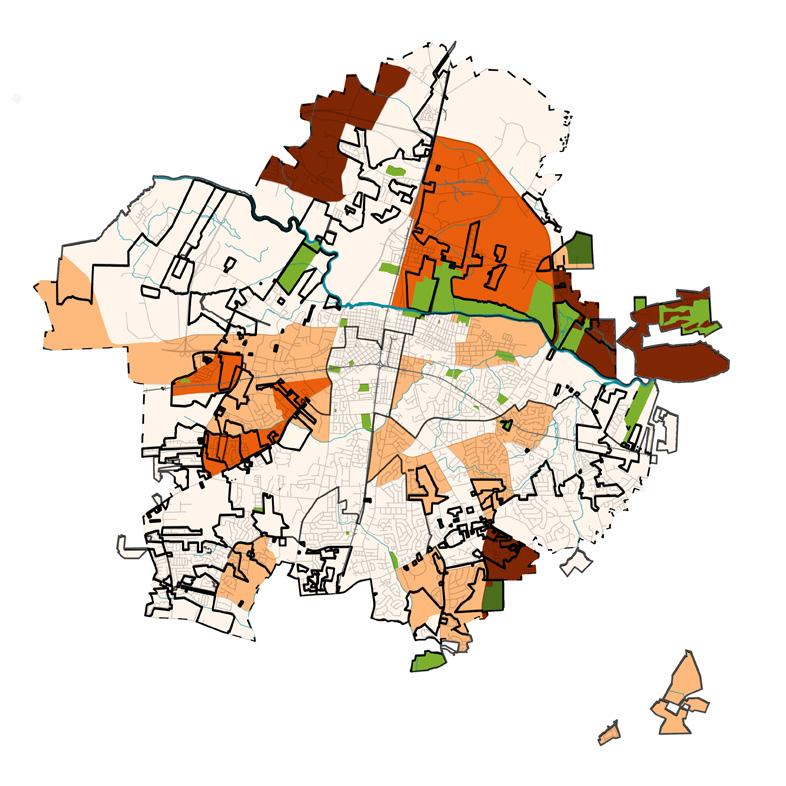
• Household wealth is concentrated in the periphery neighborhoods where there are fewer opportunities and access for recreation in public parks.
increase by the year 2040. This represents twice the rate of growth as experienced between 2000-2010. As the City’s population continues to grow, additional parkland will be needed to maintain existing quality and access to recreation opportunities for residents.
Sources: N.C. State Budget and Management (2022); U.S. Bureau of Census (2020); Pitt County Economic Development Plan (2017); City of Greenville Horizons 2026 Plan (2016); American Community Survey (2015); U.S. Bureau of Census (2010); Pitt County Transportation Plan (2009); and Greenville Thoroughfare Plan (2005)

Age group trends assist in informing programming for recreation facilities and parks. Figure B4 presents age group trends that are notably above or below state rates. Population trends show there is a 45% growth rate of residents in the 65+ age range, which is more than 20% higher than the state average growth rate from 2010 to 2022. Conversely, there is a higher than state average loss of residents age 10-19 and 20-24. Despite the negative trend of residents ages 10-24, residents age 15-24 make up the majority of all residents at nearly 24% of the total population. Figure B3 indicates the percentage of age groups in comparison to state averages. Map B2 geographically identifies the density of youth population in relation to park locations. Concentrations of youth population can be observed in neighborhoods with limited or no existing parks.
Figure B5 contains three maps illustrating density of the African-American, Hispanic/ Latino, and White populations across the City based on data from the 2020 Census. The highest density of the African-American population is located in the southwestern quadrant of the city, while the highest density of the Latino population is located in a few separated areas on the edges of the City and centrally in the northeast quadrant. Areas with the highest density of White population are primarily the southern outskirts of the city and in the east.
These maps are key to evaluating equity of park access and park quality. The largest of Greenville’s existing natural parks are along the Tar River, which is most directly accessible to the Hispanic communities. Larger sports facilities are located on the


outside edges of the City, making them more accessible to visiting teams but less accessible to residents located centrally in the city. Neighborhood parks are concentrated centrally to the City making them most accessible to those attending ECU and a portion of the African-American population.

Map B6 shows the dispersion of wealth across the city by Median Household Income based on the 2020 Census. The wealth mostly exists along the outside edges of Greenville with the highest averages in the northwestern quadrant. The higher income areas have few neighborhood and community parks. This suggests that there may be fiscal support for new park facilities or program fees to support further development of more immediate park facilities. The lower income areas of Greenville are concentrated centrally, consistent with where there are the highest levels of parks.
Figure B7 identifies the percentage of population by annual household income, the largest of which, 26.4%, is less than $24,999 annually. Although the highest concentration of parks is in the central neighborhoods of the city, these areas are the most densely populated. Residents in these areas are also more likely to be able to walk to a park. Additionally, these parks are likely more heavily utilized but will face capacity challenges as redevelopment in the area continues.
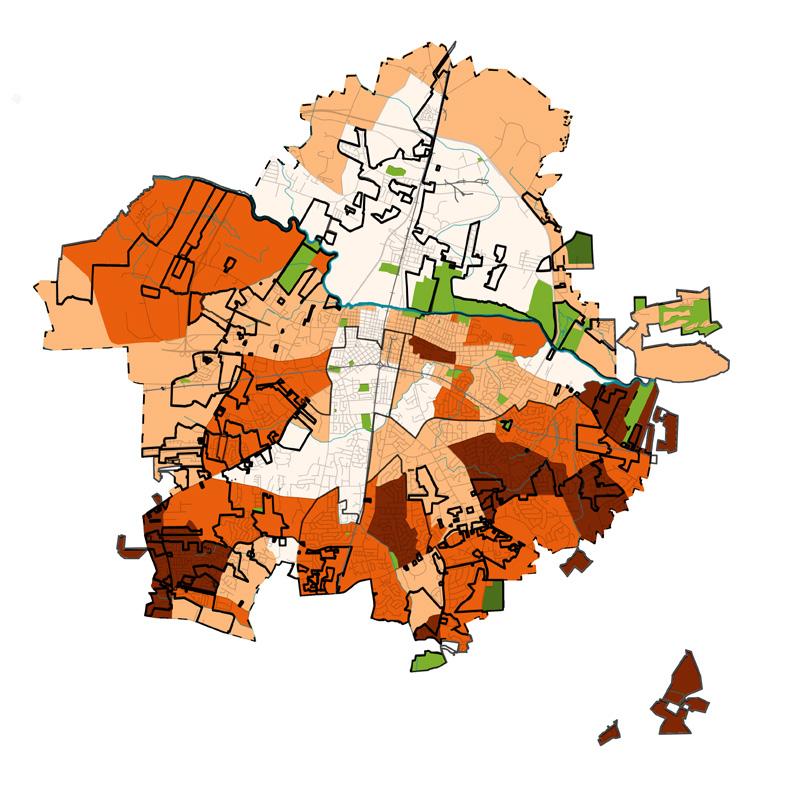
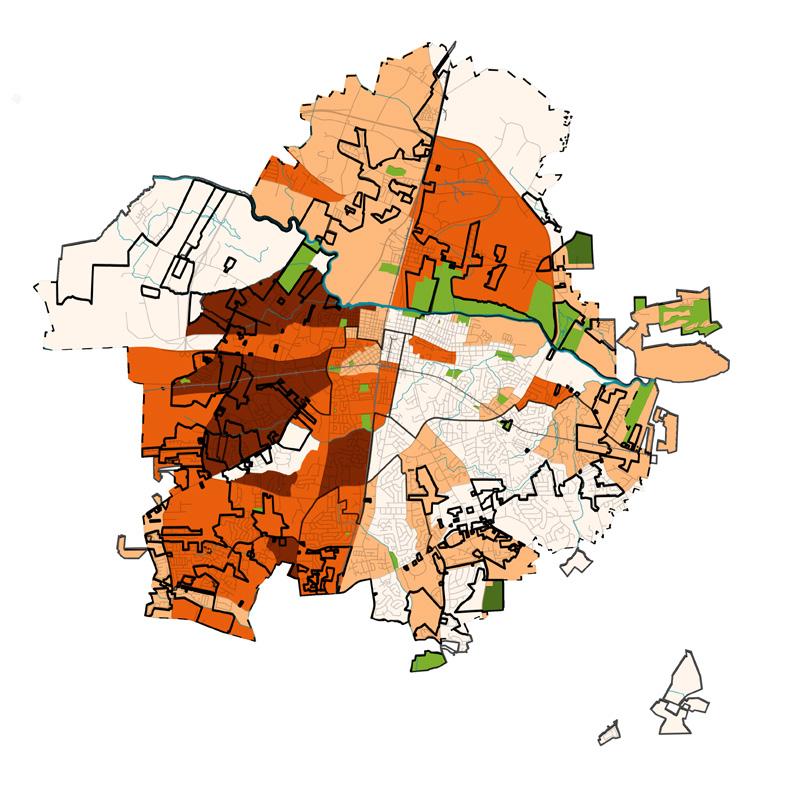
Demographic analysis indicates Greenville will grow to a population of more than 100,000 by the year 2040. As the population of the city continues to grow, so will the need for the parks and recreation system. Emphasis should be placed on providing new facilities where growth occurs as well as reinvestment and diversification of opportunities throughout the city.


Park evaluations were completed as qualitative and quantitative inventories of existing park facilities. More than 1,400 acres of City parks were evaluated and categorized by park classification based on programming and size. These typologies include:
Mini Parks
• Neighborhood Parks Community Parks
• Regional Parks
• Sports/Facilities
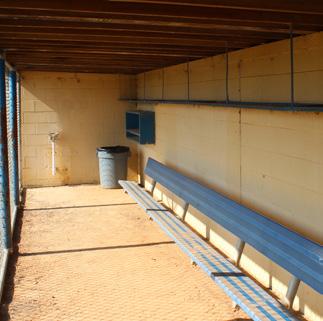
Map C1 identifies existing parks. All parks were visited and rated against a set criteria in order to evaluate quality and inventory of existing facilities.
Parks in Greenville scored expectionally high in condition, representing a highlevel of maintenance and standards of operations.


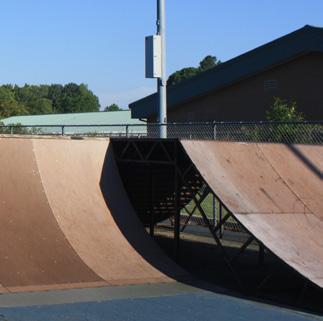


Generally, newer parks, and parks with the most amenity options, and parks available to visitors that include enhancements to pedestrian connectivity scored the highest.
Areas of sustainability and resiliency represent the majority of opportunities for improvement across the city’s parks; followed by access and linkages.
Highest Scoring Parks
Lowest Scoring Parks

Public parks in the United States have evolved significantly over time, both in terms of their functions and their use. In the early days of the country, parks were primarily seen as a way to preserve natural landscapes and provide a respite from the hustle and bustle of urban life. During the 19th century, many large parks were established in major cities, such as Central Park in New York City, with the goal of providing a place for people to enjoy nature, relax, and escape the crowded conditions of the city.

Over time, the functions of public parks expanded to include a wide range of recreational activities. Parks have become an important resource for health and wellness, with many offering walking trails, fitness classes, and other opportunities for physical activity. Parks have also become a destination for cultural events and festivals, with many parks hosting concerts, art shows, and other community events.
The use of public parks has also changed over time. Historically, parks were primarily used by the wealthy and middle class, who had the leisure time and means to enjoy them. However, as the working class grew, parks became more accessible to a wider range of people. Today, parks are used by people of all ages and backgrounds, and they serve as an important resource for people of all income levels.
Parks have also played an important role in the history of social and political movements in the United States. Many parks have been the site of protests, rallies, and other public gatherings, and they have been an important venue for the exercise of free speech and the right to assemble. Additionally, parks have been an important resource for marginalized communities, providing a space for socializing and gathering, and have been an important tool in the fight for racial and social justice.
Despite the evolution of public parks functions and use, challenges remain. Parks have been underfunded in the past, and many are in need of repair and maintenance. Additionally, access to parks is not equal across all communities, with low-income and marginalized communities often having less access to parks and green space. Furthermore, in recent years, the use of public spaces has increased, leading to overcrowding and social distancing challenges during the pandemic.
Overall, public parks in the United States have evolved over time, from being primarily a place for the wealthy to enjoy nature, to being a vital community resource. Today, people of all ages and backgrounds enjoy a wide range of recreational activities, while parks serve as a platform for cultural events, political movements, and community gatherings. Though challenges remain, public parks continue to be an important resource for the health and wellbeing of individuals and communities.


Size: <0.5 acres


Service Area: 0.5 mile
The smallest park classifications, mini parks may have benches, shade trees, or small playgrounds accessible to immediate residents by walking or biking.
Small neighborhood parks to large regional parks serve the visitors differently. Defining park classifications assists in the evaluation of how each park is meeting community needs.
Size: 0.5-5.0 acres
Service Area: 0.5 miles
Size: 5.0-20 acres
Service Area: 1 mile
Community parks provide open space to residents across the city. These types of parks may have community centers, restrooms, or regularly scheduled programming.
Size: 5.0+ acres
Service Area: 3 miles
Sports and Sports Facilities may have several regulation size athletic fields, courts, lighting, restrooms, parking, and concessions. These parks may be focused on one sport or many.


Neighborhood Parks serve nearby residents by providing recreation opportunities within walking distance. These parks may have small athletic courts, playgrounds, or open lawn space.
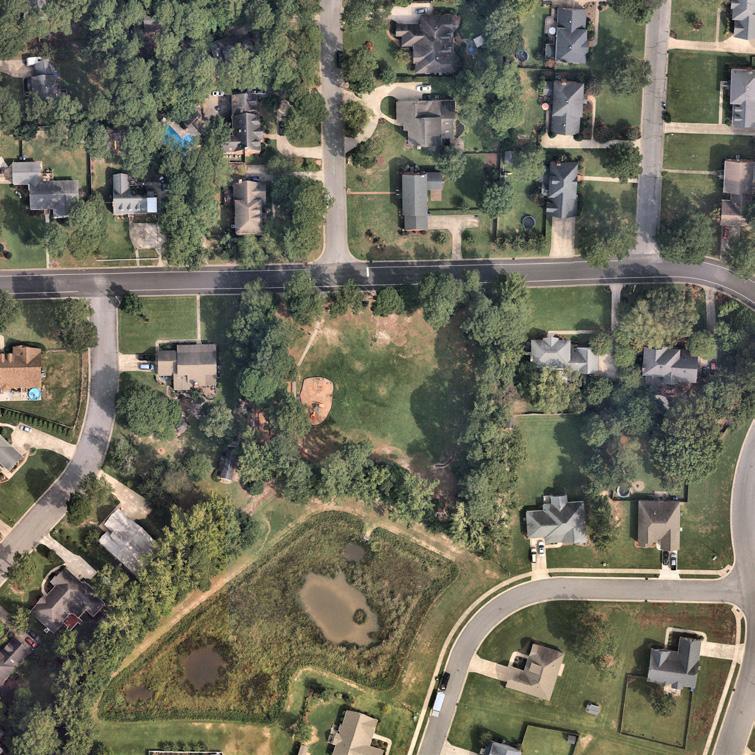

Size: 20+ acres
Service Area: 3 miles
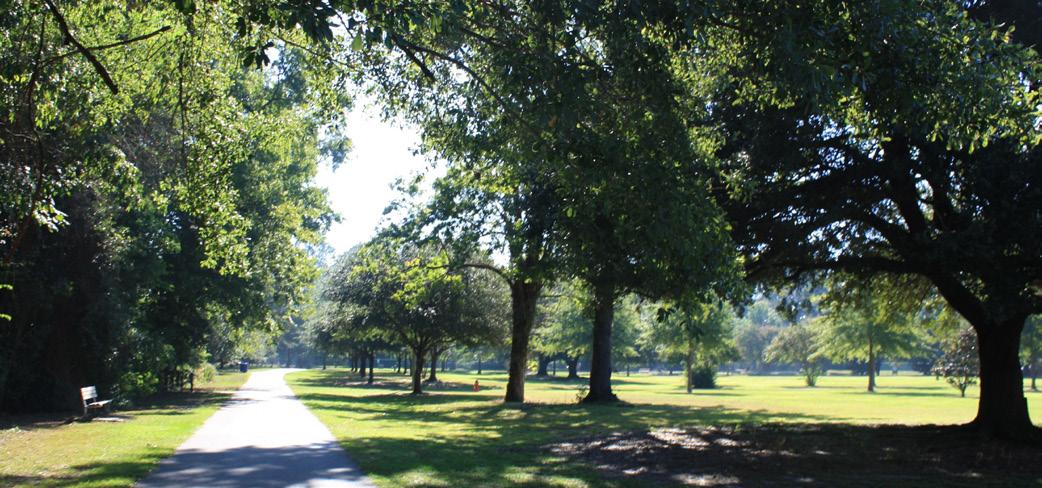
Regional Parks are the largest park classification recognized as a county or state resource. These parks may be large natural areas programed as passive recreation with seasonal programming.


Park evaluations are an extension of a quality Level of Service measurement. During an evaluation, each park’s performance is rated across six categories and 40 topics. The final product provides a weighted score from 0-100 for each park which is mapped (Map C2) and geographically evaluated for neighborhood-level and city-wide trends. The criteria is intended to objectively observe parks both individually and as a system.
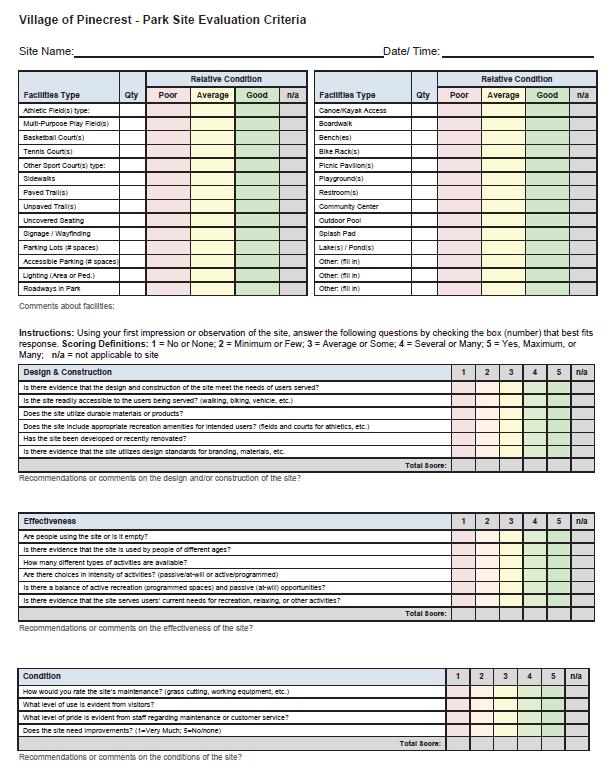

The criteria used is based in part on guidelines developed by Project for Public Spaces (PPS), a non-profit organization dedicated to helping communities create and sustain public spaces that build stronger communities. For each question, parks are assigned a rating based on observation at the time of the park visit. Ratings are based on a scale of 1-5, with 1 representing the lowest and 5 representing the highest. A rating of “n/a” indicates that the criteria was not applicable and is not included in final ratings.
Final ratings are weighted to a scale of 0-100, with 100 being the highest possible. Ratings are based on observations made during a limited time period and are intended to provide information regarding trends for individual parks or across the park system only. Map C2 shows individual evaluation scores for parks. The following section details the scoring range of evaluations. The six catogries of evaluation include:
• Design and Construction Effectiveness
• Condition Comfort and Image
• Access and Linkage
• Sustainability and Resiliency

Parks with scores in this category are defined as parks that have new or recently enhanced facilities or features, that are readily accessible through multiple modes of transportation, exhibit multiple features that enhance the comfort and experience of park users, and exhibit a maintenance quality that meets or exceeds standards of the city.
Parks with scores in this category are defined as parks that have serviceable facilities or features providing functional recreational access for the public, and are accessed primarily by vehicle with some connections to adjacent neighborhoods. These parks exhibit few features that enhance the comfort and experience of park users beyond a minimal recreational access capacity. They also exhibit a maintenance level sufficient for the uses in the park, but may benefit from additional maintenance.
Parks within this score category are generally defined as parks with facilities or features that have exceeded their functional life span and/or need enhancement or replacement to provide functional recreational access for the public. These parks exhibit few, if any, features that enhance the comfort and experience of park users and exhibit a maintenance level insufficient to continue to provide the desired uses and recreational access.


Condition 89/100
• High quality maintenance
• High level of pride and satisfaction
• Minimum site improvements needed
Effectiveness 81/100
• High level of use
• Range of choices in activities
Balance of active & passive options
Design & Construction 81/100
Recent improvements
Clear branding
Meets needs of users
Comfort & Image 78/100
Adequate places to sit
Clean and free of litter
Minimum vehicle presence in site
Figure C3 highlights categories with the highest and lowest scores across the city. The categories with the highest scores represent successes while the lowest scores represent opportunities for improvements.
Across all park typologies, parks are notably well maintained and are actively being improved. Parks are heavily used but are not well connected for pedestrian access. Sustainability is where the largest opportunity for improvement exists within existing parks.
Economic Sustainability 41/100
• Create revenue generating opportunities

• Promote or support permanent jobs
• Contribute to increasing property value
Environmental Sustainability 54/100
Improve water quality
• Contribute to biological diversity
• Enhance environmental knowledge
Access & Linkage 72/100
Clear and useful wayfinding
Easily accessible to pedestrians
Connect to nearby transit stops
In general, Greenville offers a great mix of park types. Newer parks and/or those which offer the greatest range of amenity choices and the best connections to surrounding neighborhoods scored the highest. Parks which are typically older and/or single use with little choice in amenities scored lowest. Improvements to lower scoring parks can typically consist of evaluating choices in offerings, adding additional amenities to better serve a diversity of needs, enhancing pedestrian connectivity, and implementing lifecycle capital replacement of existing amenities.


The purpose of a Level of Service (LOS) Analysis is to quantify how well the existing parks system is meeting the needs of residents. The National Recreation and Park Association’s definition of LOS analysis is “an allocation mechanism for the delivery of park land and basic recreation facilities throughout a community. By adoption of such a standard, a community in essence says that all citizens
, [...], will have an equal opportunity to share in the basic menu of services implicit in the standard and accompanying spatial distribution and allocation of policies.”
LOS analysis was measured based on four concepts:
• Acreage (Amount of Park Land)
Every resident should have similar opportunities to park land.
• Facilities (Number of Facilities)
Every resident should have similar opportunities to use recreation facilities.
• Funding and Staffing
Every resident should enjoy comparable level of funding spent on capital and operations.
• Access (Distance or Travel Time)
Every resident should be able to access specific park facilities within similar walking, bicycling, public transit and/or driving distances.
KEY TAKEAWAYS:
Key Takeaways:
• Greenville provides twice as much parkland as in-state peer communities and 60% more than national averages.
• Future development of existing Cityowned parkland will meet a majority of passive park use needs by 2040 as the city grows. An additional 66+ acres of pocket, neighborhood, community, and sports parks will still be needed.
• Passive regional parks represent 66% of all parkland in Greenville.

• There is a current shortage of multipurpose fields compared to national averages.
• Future recreation facility needs include multipurpose fields, pickleball courts, playgrounds, picnic shelters, and basketball courts.
• Staffing levels are below peer communities (6 FTE) and national (17 FTE) averages.
• Funding is 8-16% below peer and national averages respectively.
• The Greenville Recreation and Parks Department is currently maintaining a park system that is twice the size of peer communities with less staff and lower funding per capita.
• Access to parkland is most limited in the southern and western neighborhoods of the city.

The most common way to measure LOS for existing acreage is number of park acres per 1,000 residents in a community. What does this measurement mean? A general lack of national standards in definition of what should count as parks results in difficulty in comparing figures with peer communities or establishment of a national benchmark. Analysis, however, can identify local trends and result in standards that meet the needs and desires of residents for the long-term vision of the community.
The best acreage LOS standard for the City is ultimately based on public input and what the community desires. By using population estimates and acreage figures, an acreage LOS calculation can be obtained, see Figure D1 The current Acreage LOS for Greenville is 15.0 acres of developed park land per 1,000 residents.
The Phil Carroll Nature Preserve (181 acres with no public access), Eastside Park (119 acres with public access) and Staton Road Park (5 acres) are undeveloped parkland owned by the City and lack any amenities. If developed,
two of the sites would fall within the regional park typology as they are natural areas and with planned passive recreation uses, similar to River Park North. Additionally, both sites are prone to significant impacts from flooding due to their location adjacent to the Tar River.
The City’s acreage LOS is currently higher than both national (9.20 acres per 1,000 population) and peer communities (7.19 acres per 1,000 population) averages. As the City’s population is projected to grow, the existing acreage LOS will decrease unless additional parkland is developed. In order to maintain the currently provided Acreage LOS, the City would need to provide an additional 66.88 acres of neighborhood, community, and sports parks by 2040. The largest future need for 138 acres of regional parks can be met by developing the existing undeveloped parkland at Phil Carroll Nature Preserve and Eastside Park.
Comparatively, Greenville is currently providing more than twice the acreage LOS than peer communities. This underscores the high local demand for parkland and the higher percentage of regional parks that represent parkland in Greenville compared to other communities.
The second LOS measurement analyzes the provision of facilities on a per capita basis. From fishing docks and trails within Wildwood Park, to recreation centers in H. Boyd Lee Park, to the many playgrounds across neighborhood parks, existing parks provide a wide range of recreation facilities.
Similar to the acreage LOS analysis, there are no national standards for facility LOS goals. Each community’s provision of facilities is intented to meet local needs; however, the measurement can be utilized to compare Greenville to national averages.

Facility LOS is determined by quantifying the number of facilities provided per capita. Data collected through park evaluations and from Department staff populated an inventory of existing recreation facilities.
Figure D2 compares the City’s existing facilities to national standards and projects needs for 2040 as the city continues to grow. Results indicate that residents enjoy a surplus of recreation facilities when compared to 2022 National Recreation and Park Association (NRPA) average. Compared to national average, the City is only in need of additional multipurpose fields, playgrounds, and pickleball courts. Highest needs are for multipurpose fields and pickleball courts, with both potentially currently needing six additional and growing to seven each as 2040 population projections are included. Playgrounds have the next highest facilities with three needed currently, growing to seven by 2040.
By maintaining existing facilities LOS as the city continues to grow or benchmarking local standard to national averages, both
actions would result in the need for most types of outdoor athletic facilities, as well as, picnic shelters, restrooms, and indoor recreation facilities and community centers will be needed. Other providers, such as the NC Wildlife Resources Commission’s Port Terminal boat and kayak launch facility, are examples of partnerships that can provide public access to recreation amenities.

The third LOS measurement analyzed was staffing and funding. Figure D3 identifies developed acres per full-time equivalent (FTE) staff member, FTE per 10,000 residents, and expenditures per capita compared to national and peer averages. This measurement method helps to identify how Greenville is funding and staffing parks and recreation facilities compared to other providers.
Though Greenville provides twice as many acres of parkland per 1,000 population than peer communities, and 60% more than national averages, staffing and expenditures on a per capita basis in Greenville are lower. Additionally, as noted in the park evaluations, the condition of parks and recreation facilities is noted as exceptionally high in Greenville. In essence, Department staff are maintaining
twice as much parkland as peer agencies and doing so at a high level of quality. The City has acquired a significant amount of passive parkland in the last ten years, but staffing levels have remained consistent. Comparing staffing levels to average peer communities, Greenville has 6.7 FTE fewer positions, and 17.8 FTE positions below national averages.
Expenditures on recreation and parks (salaries, fringe, and capital investment) on a per capita basis for Greenville are similar to staffing, below both peer communities and national averages. Compared to peers, Greenville would require $670,693 in additional funding to match per capita levels. This does not factor that with less per capita funding, Greenville is maintaining and operating twice as much parkland. Compared to national averages, this deficit in funding grows to $1.2 million. Greenville is therefore underfunding parks and recreation compared to peer communities and national averages by between 8-16%.
An important note is that Department funding for 2023, used in the above comparisons, was an increase of 10% from the average annual funding the Department has received since the prior 2008 master plan. If comparing historic funding averages, the deficit from peer communities increases to $1.3 million and $1.9 million when compared to national averages.

The final LOS analysis is related to access to parks and recreation facilities. This measurement answers the vital question, How well can residents get to parks? This is typically measured as a distance, either in miles or travel time. Being able to analyze access to parkland and recreation facilities is important for Greenville for the following reasons:
1. The City provides an above-average amount of parkland to residents compared to peers, but not all residents share in ease of access.
2. As shown in the demographic analysis, the City remains highly segregated by neighborhoods. Ensuring each neighborhood has access to parkland and recreation opportunities is an important step toward improvements in social inequities.
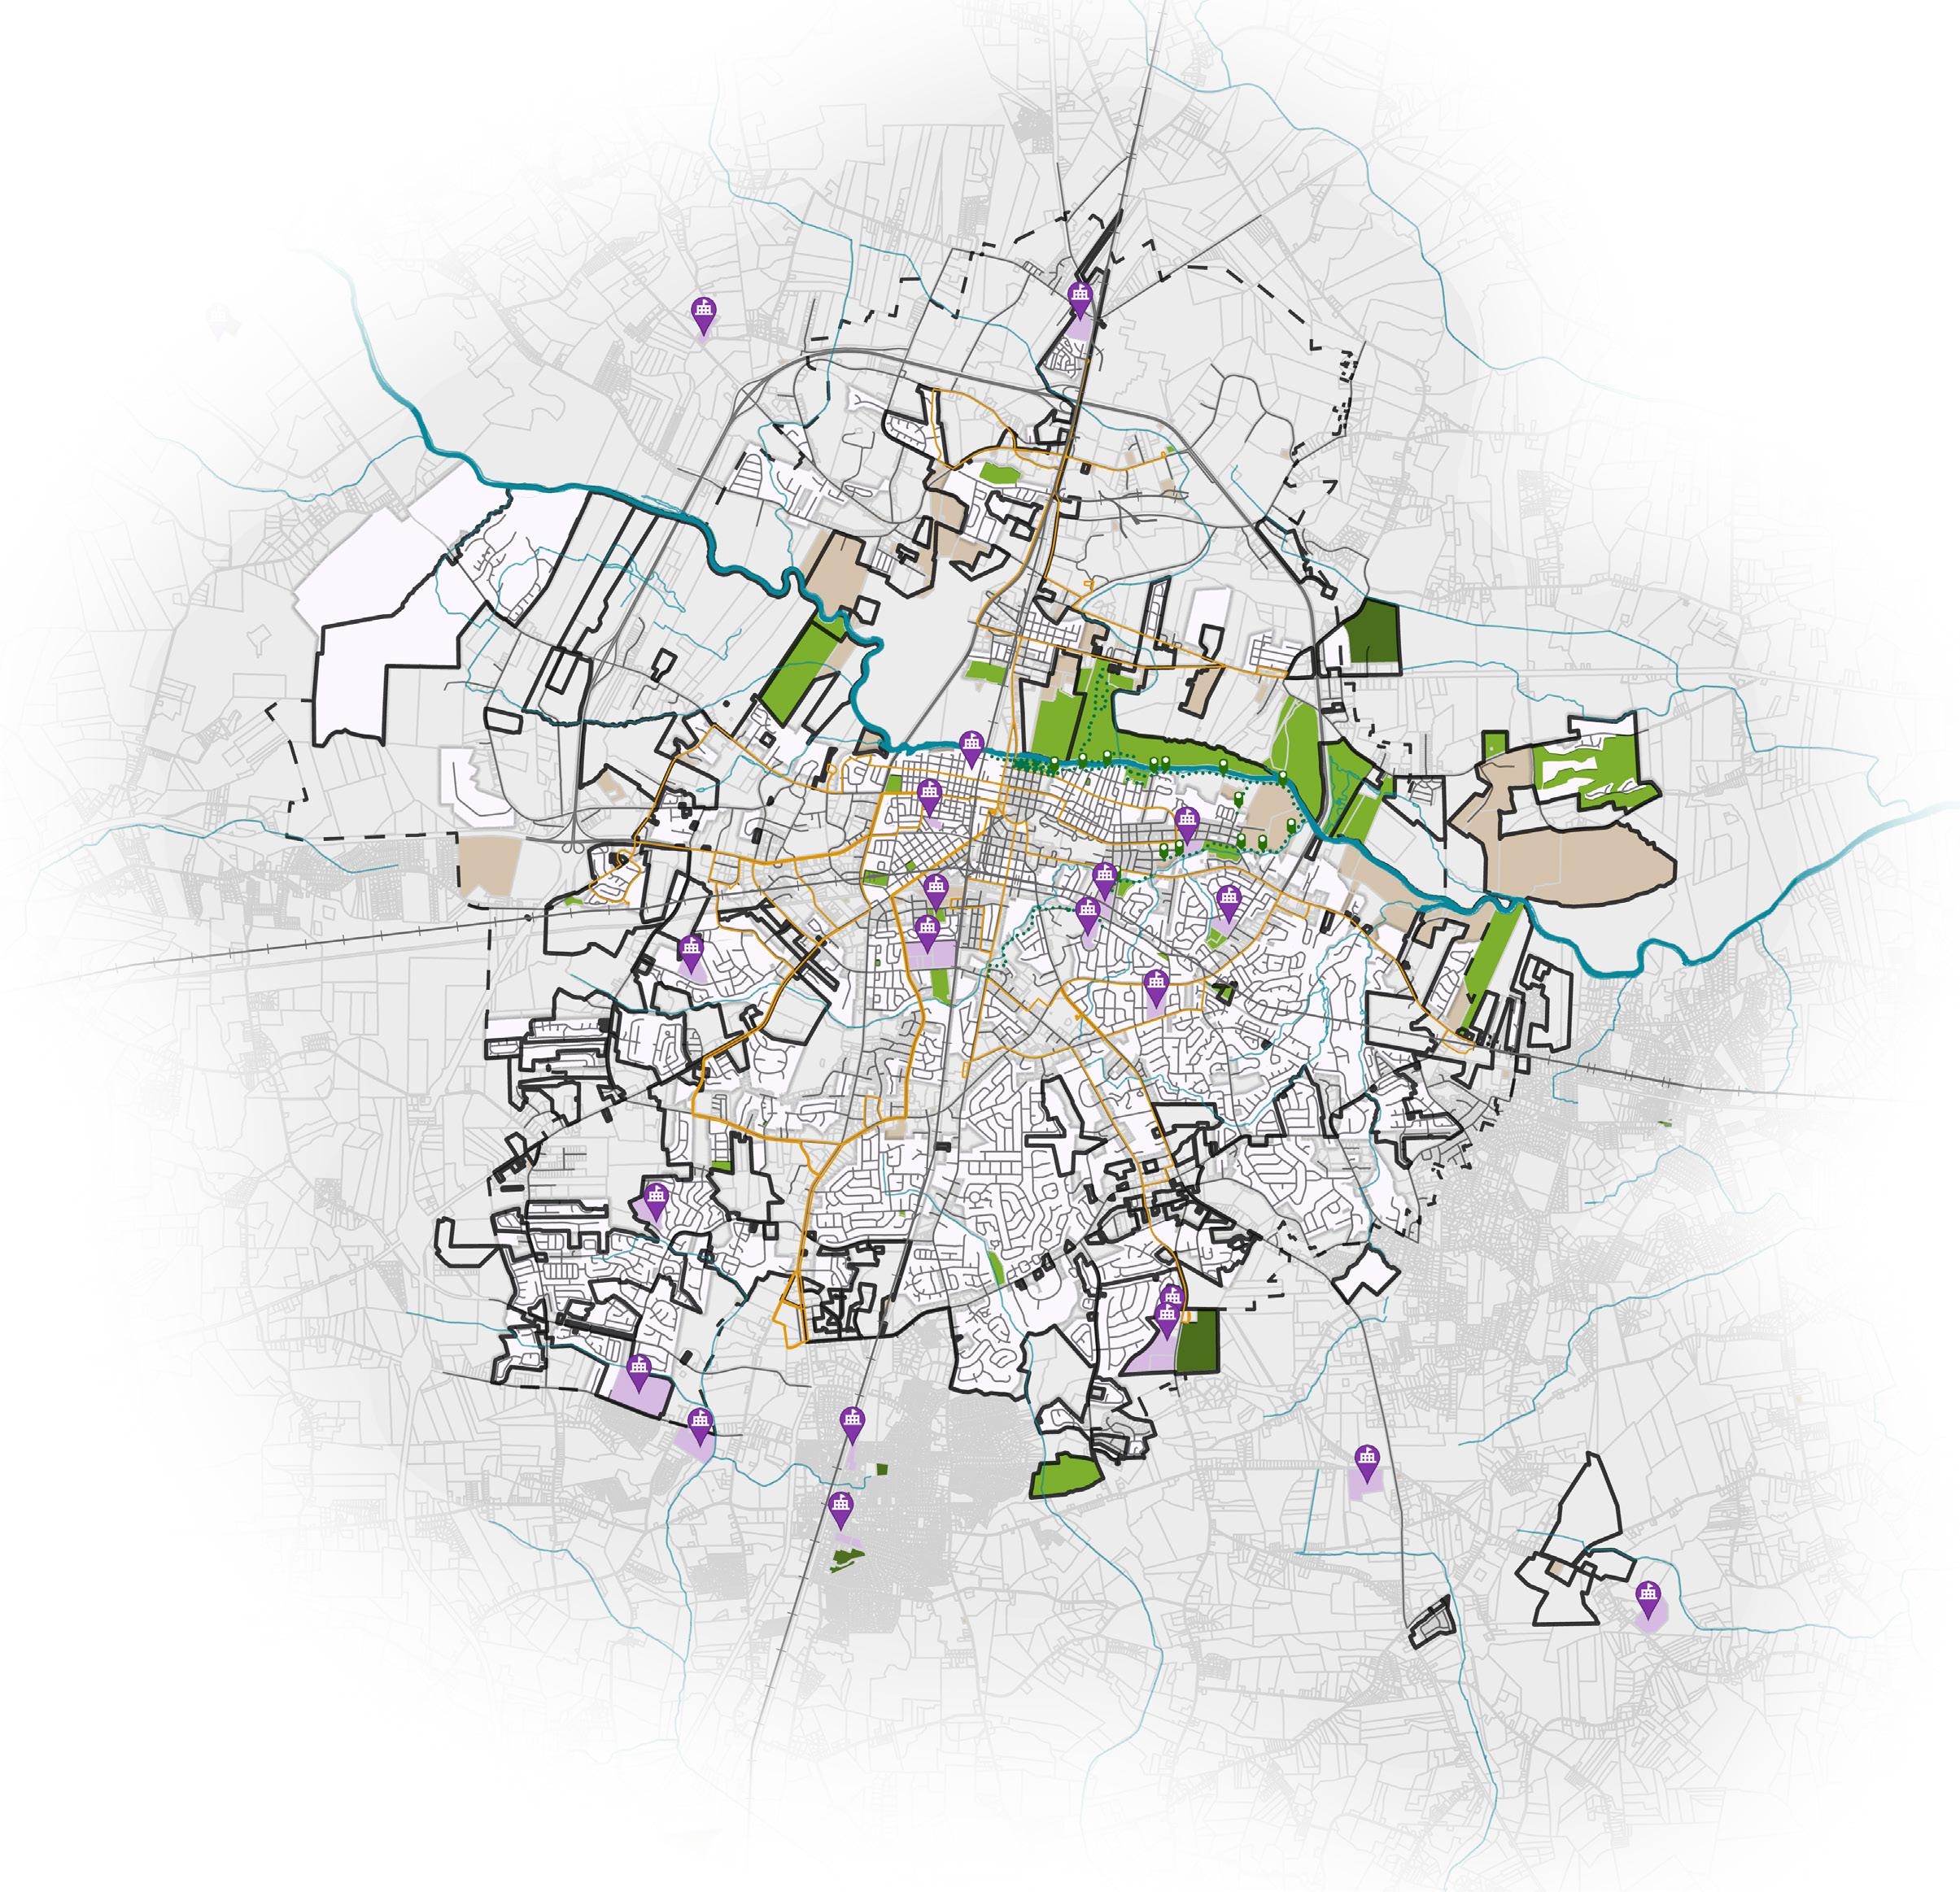
Access LOS can be analyzed by using the City’s GIS street network data to measure respective travel distances (½ mile, 1 mile, or 3 miles) from park entrance. This creates each park’s or recreation facility’s service area, or the area in which someone could walk, bike, or drive a reasonable distance to each. Mini and neighborhood parks often have minimum to no parking and smaller programed areas, as they are meant to serve immediate residents; therefore, walking and biking distances are primarily used with these types of parks.
Larger parks or sports facilities are designed to accommodate larger numbers of visitors and, due to their uniqueness and cost to construct and operate, frequently serve a larger area of the community with an expectation that visitors drive, carpool, or take transit to these facilities. Natural barriers such as the Tar River and man-made barriers such as freeways impact the service area for each park or recreation facility and are included in the analysis. The result is a series of true walkshed, bikeshed, and driveshed for each facility.
23%
Peer communities average 30% for 10-min. walk to a public park
Percentage of the community within 10 min. walk (within 1/2 mile of a park)
45%
Percentage of the community within 20 min. walk (within 1 mile of a park)
84%
Percentage of the community within 15 min. bike ride (within 3 miles of a park)
Distances used for each park typology are based on typical ½ to 1 mile walking range for mini, neighborhood, and community parks. A 10 minute walk translates into a ½-mile distance while a 20 minute walk is typically a one mile distance. The ½-mile distance also translates into an average 5 minute bike ride. Regional parks and the sports facilities typology rely upon access by biking, driving or transit. Because of this, they are evaluated by a larger, 3 mile service area or a 15 minute bike ride.
Areas outside of the color shaded service areas are not considered to have reasonable access to the identified park or facilities.
Alice F. Keene District Park is a Pitt County owned and operated park but is included in this access LOS analysis under ‘Other Parks’ because of its location within the city limits.
The maps following the conclusion of this section present Access Service Areas by park typologies:
Map D5: Existing Parks LOS
Map D6: ½-mile & 1 mile Existing Parks LOS
Map D7: Mini & Neighborhood Parks LOS
Map D8: Community Parks LOS
Map D9: Regional Parks LOS
Map D10: Sports/Facilities LOS
Analysis based on park typologies shows overall park access is most limited to the southwestern and northwestern neighborhoods. The southwestern area is more notable, as it is also more densely populated. Parks accessible by walking or biking are concentrated in the central neighborhoods of the city, and larger regional parks primarily serve eastern neighborhoods of the city. Additional maps show access LOS of specific facilities within park space:
Map D11: Restrooms LOS
Map D12: Playgrounds LOS
Map D13: Wi-Fi LOS
Map D14: Tennis Courts LOS
Map D15: Pickleball Courts LOS

Map D16: Baseball & Softball Fields LOS
Map D17: Basketball Courts LOS
Map D18: Soccer & Multipurpose Fields LOS
Map D19: Picnic Shelters LOS
LOS analyses are measurements intended to evaluate the existing park system through comparison or service area. Through these measurements, Greenville has been identified as meeting or exceeding acreage and facilities per capita averages, specifically when compared to peer communities. As the city continues to grow, it will be important to continue to invest in additional parkland and recreation facilities to maintain LOS measurements.
Two measurements identified potential areas of need for Greenville: staffing/funding and access LOS. Greenville is below peer communities (9%) and national average (20%) for staffing, while current staff maintain a park system that is twice the size as peer communities. In addition, funding on a per capita measurement is also below peer communities (8%) and national averages (16%) for jurisdictions the same size as Greenville.
Analysis of access to parks identifies that Greenville trails peer communities when it comes to providing park space within a 10 minute walk of all residents 23% for Greenville compared to 30% for peer communities. Access does improve as the distance to parks is increased; however, on average, less than 10% of the public is typically willing to walk more than 10 minutes to a park.




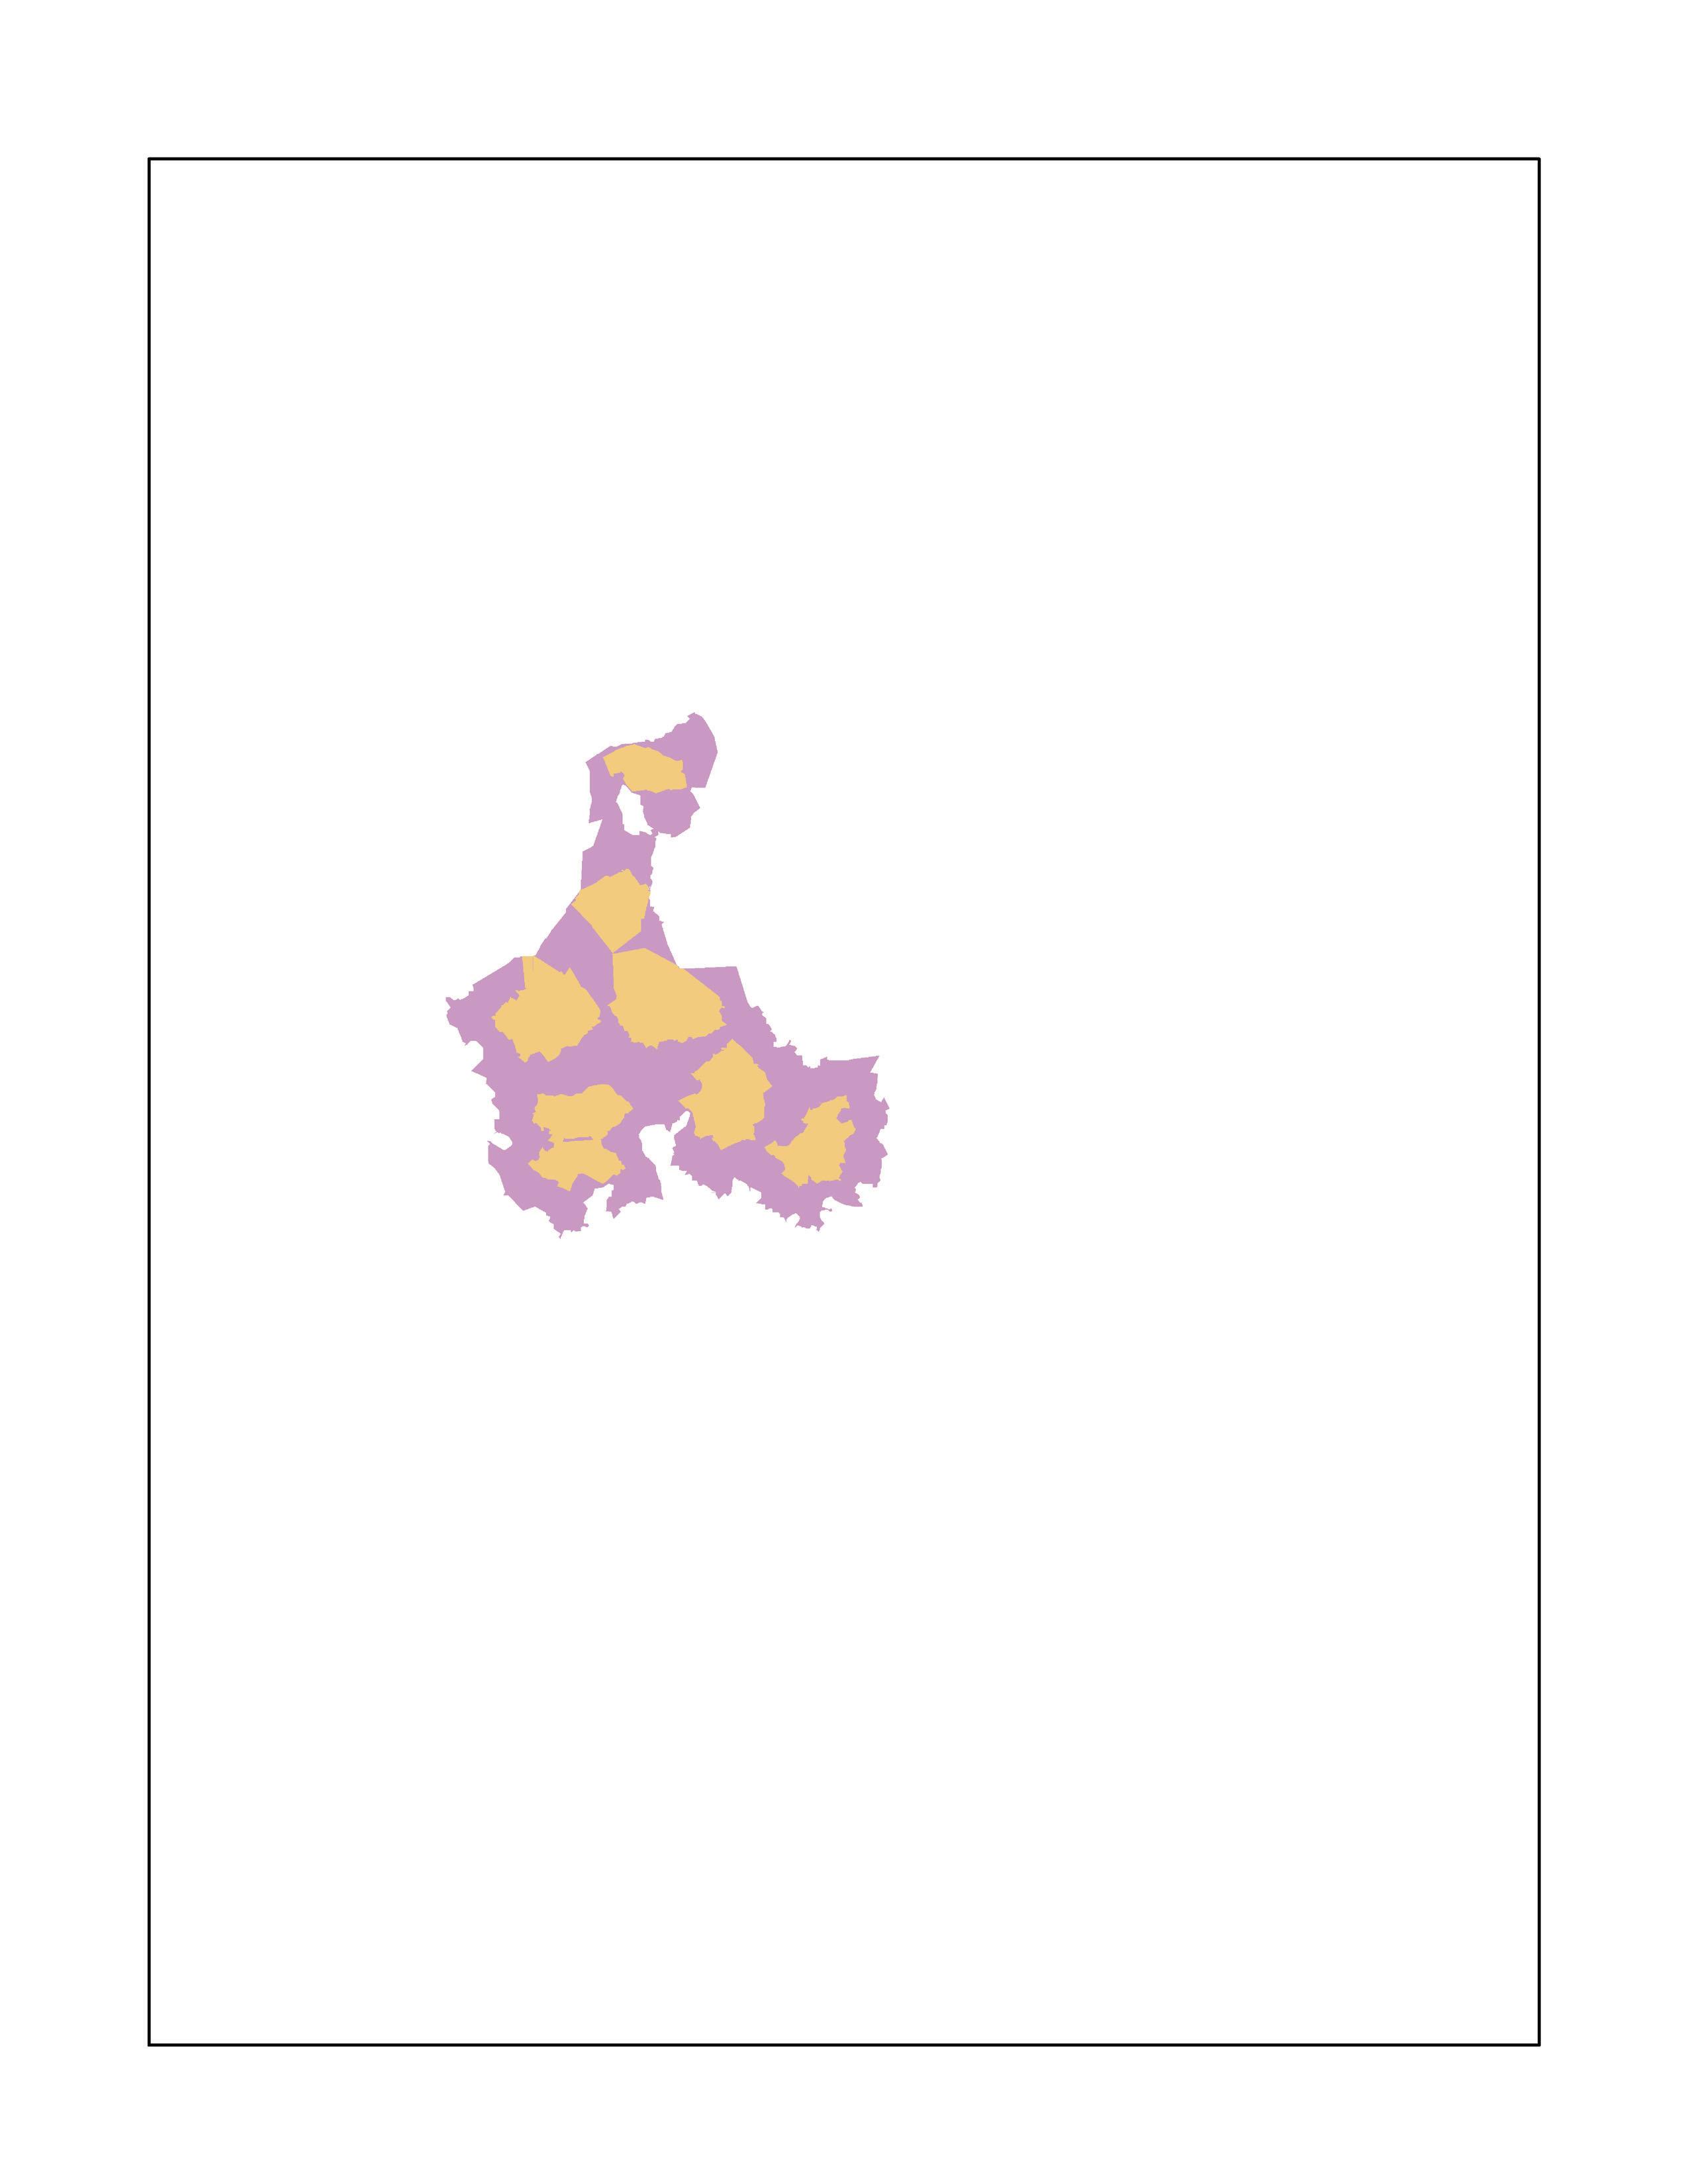


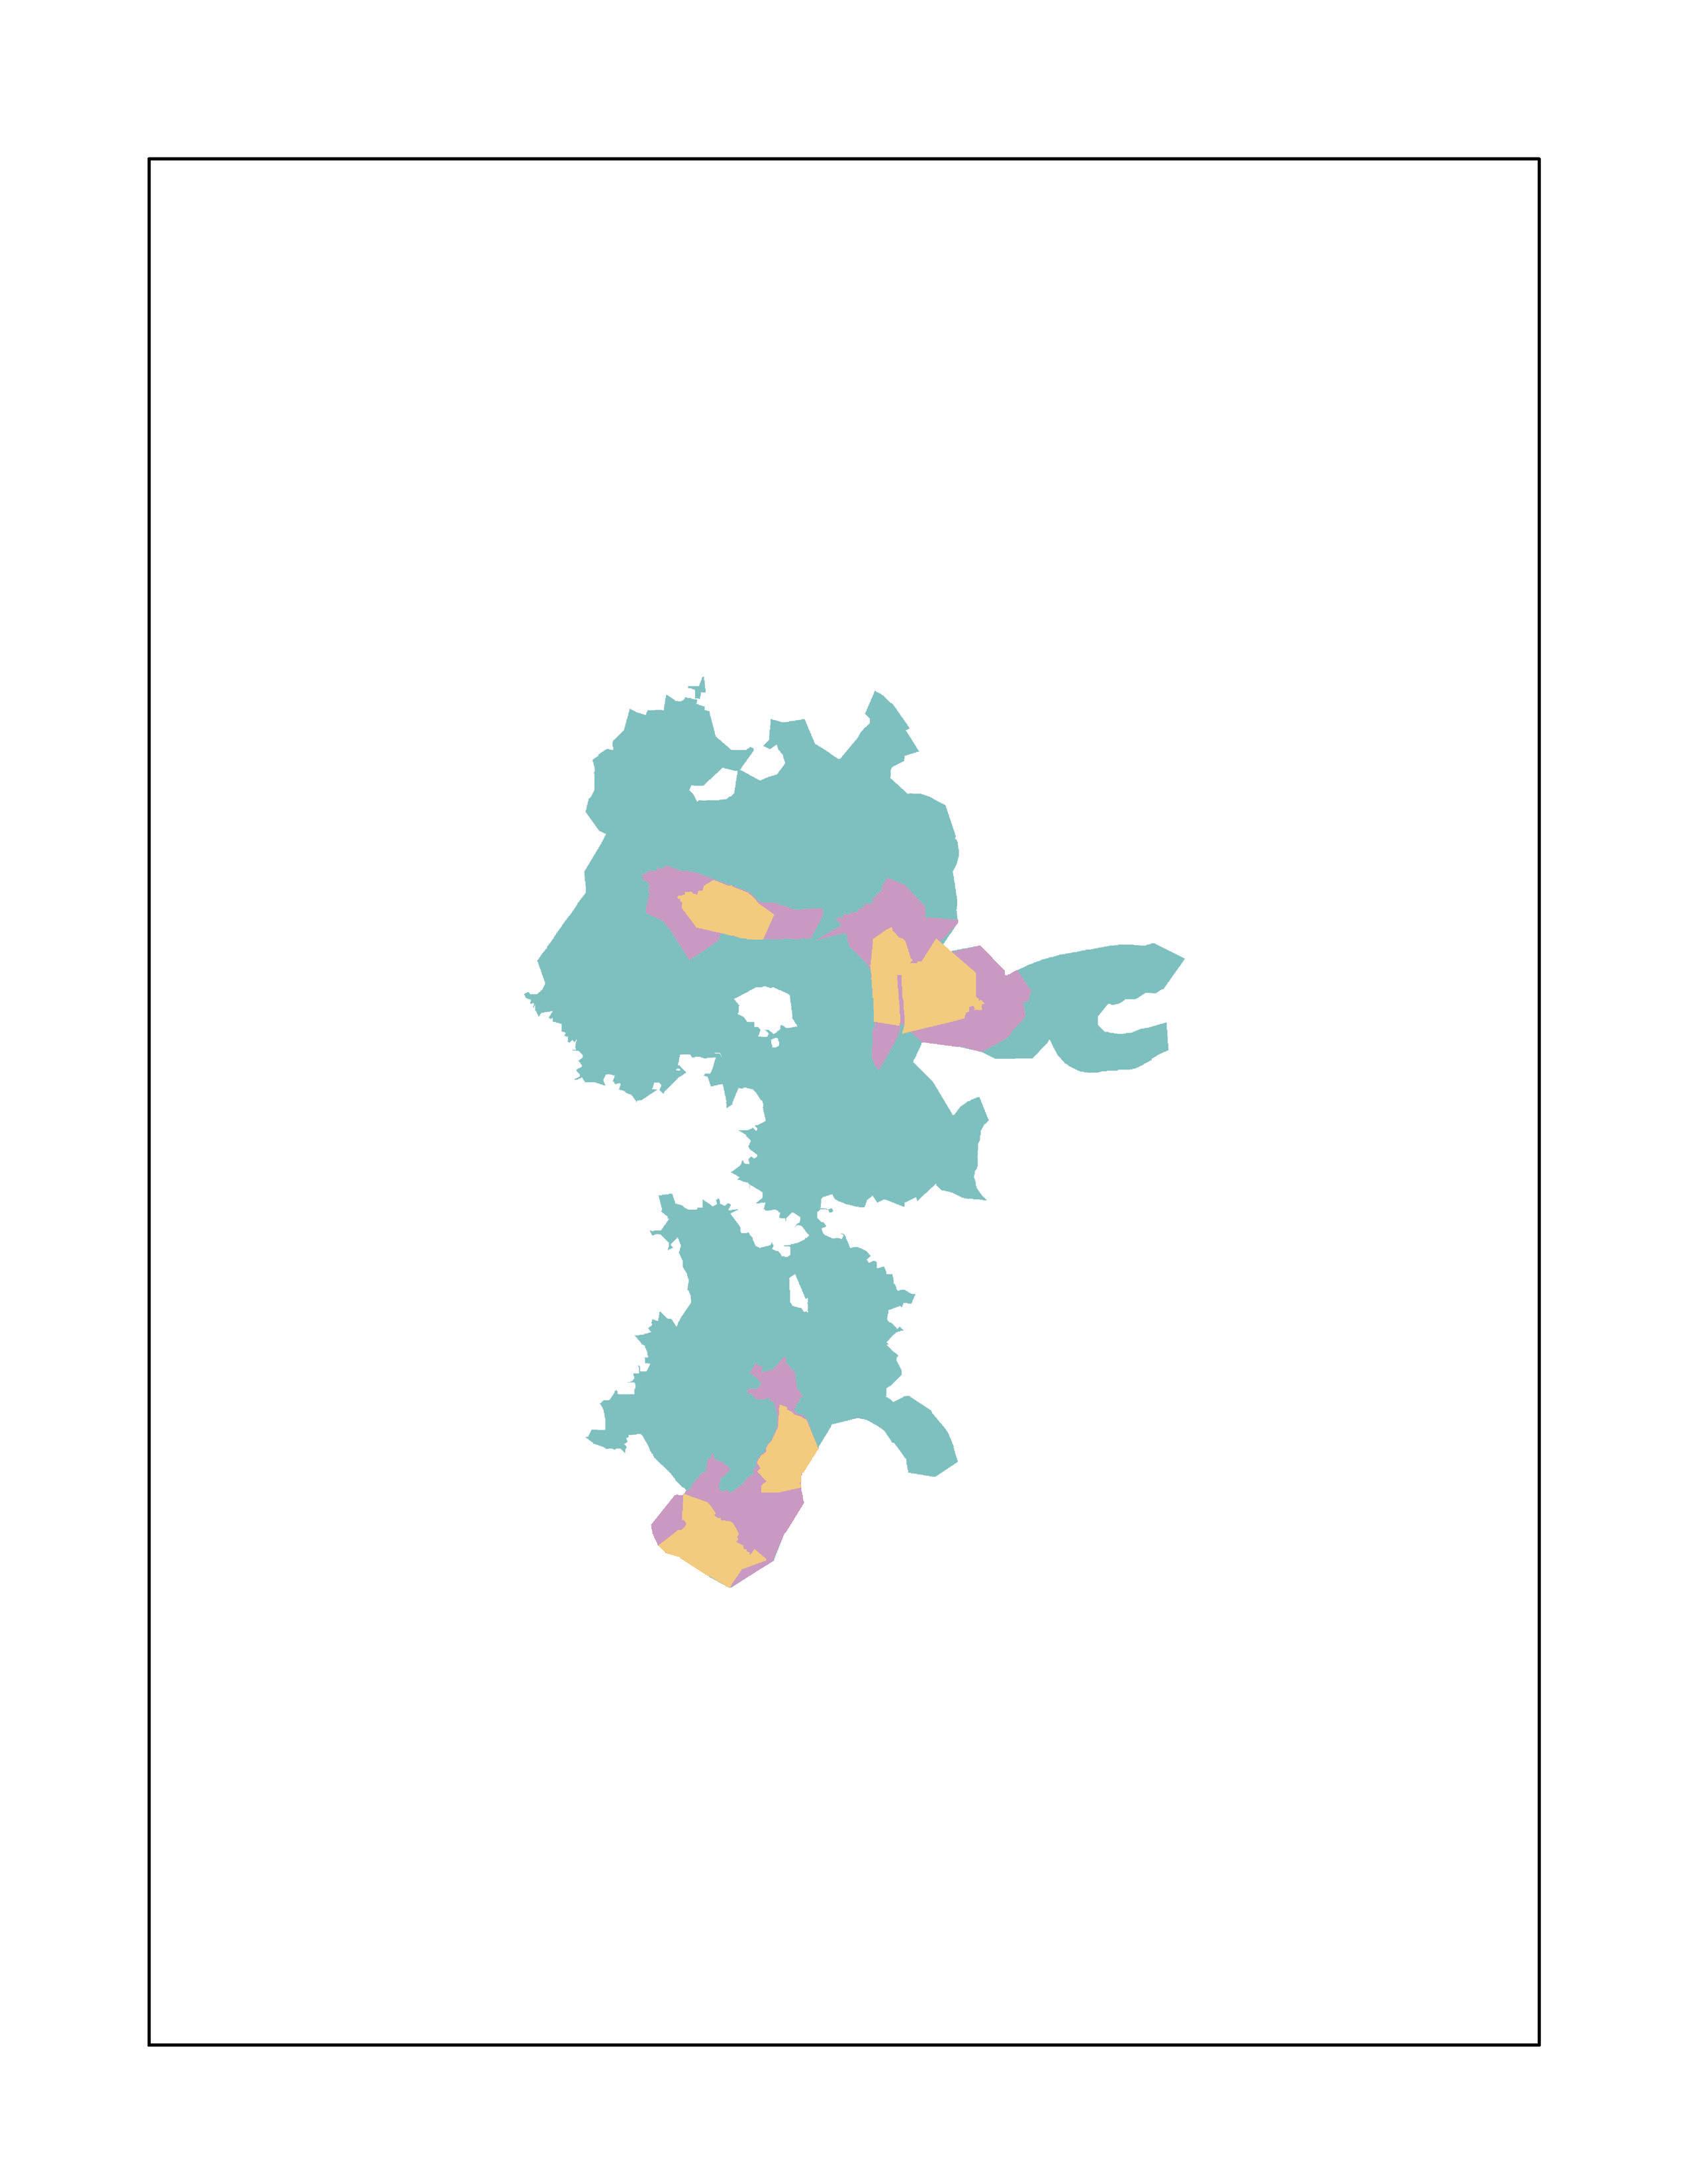


Assessment of recreation programming and services is a vital step in developing a comprehensive master plan. Information included in this analysis overlaps with the Department’s recent market assessment. The market assessment is an important source of information as it overlays demographics characteristics of the city with participation statistics. This assessment focuses on programs currently offered, demographic trends, expressed public needs and priorities, and Department resources.
The following areas are covered:
• Program Statistics and Core Services

• Rental Statistics
Program Delivery Model
• Staff Input and Recommendations
• Future Considerations
o New Program
o Program Evaluation
o Program Lifecycle
Key Takeaways:
• Core program types include youth, adult and family, active adult and senior, dropin recreation, memberships, and passive recreation.
Participation rates have rebounded to prepandemic levels for many programs; while some have even decreased from postpandemic boosts.
Quality of instructors and facilities are the top two areas of satisfaction by customers with over 85% satisfied or very satisfied.
Participants recognize a high value of currently offered programming with over 75% of survey respondents willing to pay additional fees to participate.
Cost recovery philosophy has shifted over the last ten (10+) years, decreasing from 33.5% in 2012 to a low of 12.5% in 2020, and increasing to 18.6% in 2022 and projected to be 20.7% in 2023.
Ability to recruit staff and timely marketing are the two most critical challenges identified by staff.
• Providing flexible indoor space for relocating programs during facility renovations, expansions, or replacements is critical for continued success of programs.


Statistics and participation (Figure E1) were compiled and reviewed to understand existing participation in recreation programs. It is important to note that the data reviewed was from 2019. Given the COVID-19 pandemic, it is important to base future recommendations on what the Department experienced pre-pandemic. In recent discussions with Department staff, program enrollment figures have already returned or in some cases are projected to exceed pre-pandemic registration figures.
The comparison of enrollment versus cancellations is very positive with less than 5% cancellations to all enrollments. This indicates programming staff are responding to the needs and desires of the community, and in doing so, are minimizing cancellation rates. This finding is also consistent with statistical
survey results which mirror national averages for ‘lack of interesting programs’ and ‘program not offered’ as barriers to participating in recreation activities.
The primary focus groups of programming for the Department are:
• Youth
Adult & Family
• Active Adults & Seniors
Within those groups, programs fall into the following categories:
Athletics
• Aquatics
Arts & Crafts
• Card & Board Games
• Clubs
Education
• Exercise
Health Learning & Wellness
•
The lists above, for both focus groups and program categories, are referred to as the Department’s core services. In addition to those listed, review of program offerings and enrollment figures suggest the following are additional core services of the Department:
• Drop-In Recreation
• Membership
• Passive Recreation
While these 3 categories are common to the recreation industry, it is important to note that drop-in use of facilities, passive
use of parks and park land, and offering memberships to facilities are in fact programs.
Other important characteristics of programs offered by the Department include:
• Location – Based on conversation and research, all programs offered by the Department are offered in Cityowned facilities. It is not uncommon for communities the size of Greenville to have the facilities and infrastructure to offer this depth and breadth of programming, all at City-owned facilities.
• Fees – Almost all programs that are listed in the Department’s program guide have fees associated with them. At the same time, the fees fluctuate by program and instructor/program intensity. It is also important to note that the associated fees appear to be market-based to facilitate high levels of participation.
•
It is also important to note that for most programs where there are fees, there is a standard rate and Greenville residents receive a discount. In the case of programs that are taking place at the Greenville Aquatic & Fitness Center, members of that facility receive an additional discount from the resident rate. The application of fees and standard versus resident and member rates are both within industry standards and should be continued.

• Registration – All programs that require a fee also require registration. That registration process can be completed online and at select facilities within the Department. Having the option of registering both online and in person is within industry standards and should be continued.
Q11. Rate your satisfaction with the following program services provided by the City of Greenville Recreation and Parks Department.
Very Satisfied
Very Dissatisfied Dissatisfied Satisfied
An additional service the Department provides is facility rentals, which could be considered a core service. Given the number of indoor and outdoor facilities the Department operates, being a rental provider in the community provides a vital service at an affordable cost to residents and visitors.
Rentals, as a category, is one that can generate significant revenue for many agencies. The biggest challenge in generating revenue from rentals is balancing rentals, programing, and drop-in use. Greenville appears to accommodate a significant number of rentals in both the shelter and facility categories as shown in Figure E3 It is important to note that the Department employs resident and non-
resident rate structures, in addition to profit and non-profit. This is an industry standard that should continue.
The Department currently uses multiple models to deliver programs to the community. The two (2) primary models can be described as follows:
• Staff Run: These programs are offered by the Department and are run by staff, both full-time and part-time, and can take place on a seasonal or annual basis.
Benefits: The Department has maximum control over the program, its content, and the instructors. They can also maximize revenue generation.

Challenges: The Department is responsible for managing and maintaining the staff.
Examples: swim lessons, summer camps, etc.
• Rental: These programs may or may not appear in the Department’s seasonal program brochure and are run by an outside group that is renting facility space from the Department.
Benefits: The Department is only renting the space, there is minimal staff time required, and it is transactional in nature.
Challenges: The programs taking place during the rentals can be associated with the Department which can cause challenges if not done properly.
As the Department continues to evolve and work to solve existing staffing challenges, they may consider using a third-party model.
• Third Party: These programs may or may not appear in the Department’s seasonal program brochure but are run by a thirdparty contractor. These instructors are paid on a contract basis, and there is typically a revenue split between the contractor and the Department.
Benefits: Using contract instructors/ programmers allows the Department to pivot as trends shift. It also means that the Department does not have to hire additional part-time staff.
Challenges: The biggest challenge in managing third party contracts is how the program will be a reflection on the Department.
Examples: Healthy cooking for kids, children’s garden.
It is important to note that the program delivery model does not impact whether a program is a core service.
As part of evaluating the programming that the Department offers, program staff were engaged in a series of interviews. Meetings with staff focused on the level of current programming, areas they would like to expand/contract, and challenges with offering programs to the community. The following are themes from those meetings.
Discussion Themes:
1. Pandemic Impacts:
• Memberships are back to pre-pandemic levels.
• Youth sports have recovered to prepandemic levels. In some cases that means that participation has decreased, as outdoor activities saw a surge during the pandemic.
Outdoor recreation has returned to pre-pandemic levels.
2. Adult Sports: Challenged by decreasing rates of participation that can be attributed to a number of factors such as the pandemic, difficulties in hiring officials, time commitment, and affordablity. While overall numbers are decreasing, drop-in participation for adult sport related activities is increasing.
3. Youth Sports Partners: The Department works with several groups in the community to help deliver youth sports, in particular the competitive level teams. Some of those partners include:
PGSA – soccer

• Greenville Little League
Youth Lacrosse
• Babe Ruth – baseball
• Jackie Robinson Baseball
Youth Football
• Beach Volleyball
While these groups work alongside the Department there is some inconsistency
between which groups rent or pay for facilities and those that do not. Based on this feedback, a consistent facility rental policy for all user groups, sport, and nonsport would be best. This change in policy will need to be developed in alignment with the Department’s cost recovery philosophy.
4. Cost Recovery: There are different targets for cost recovery based on the type of programs that are offered. Figure E4 identifies statistical survey respondents’ willingness to pay additional user fees or charges for participating in their favorite events. Approximately 75% of respondents indicated a willingness to pay additional amounts, showing there is a recognition of value with current program and event offerings and support to potentially increase revenues in alignment with the Department’s cost recovery philosophy and affordability
goals. The following encapsulates the approach by program type/category:
• Memberships: Memberships are available at the Greenville Aquatics and Fitness Center. The membership rates at the facility are focused on helping the facility achieve 100% of its operating expenses. This is a common practice for a facility of this type. It is also important to note that programs within the facility also help offset operating expenses.
• Special Events: These are 100% covered by sponsorships and/or admission fees. It is common for municipal departments to seek sponsorships for special events, or for those to be subsidized from the City’s budget. It is also important to note that there are a variety of special events that the Department offers. Events such as a father/daughter
Q16. Additional amount in user fee or charges per person you would be willing to pay for your favorite recreation and parks activity or program which you or members of your household participate.
Over 75% of participants responded with a willingness to pay an additional user fee for their favorite programs.

event may have minor sponsorships, with an associated fee. In contrast; a Memorial Day Parade or 4th of July Festival (common examples) would be supported by sponsorships and the City.
• Arts Center: The goal of the center is for all expenses associated with offering programs to be covered by program fees. Additionally, a portion of that revenue should cover operating expenses of the facility.

• Programs (general): There is some fluctuation regarding cost recovery of all the other programming that takes place outside of the specialized categories previously outlined. Staff agreed that a minimum goal is to recover direct costs associated with running programs. Staff also agreed that some programs should be subsidized. Staff further agreed that subsidizing select programs provides a service for individuals that may be unable to afford to participate.
While discussing cost recovery, most managers had a very clear understanding of the cost recovery goals for their various areas. Outside of management-level staff, there was less clarity about the cost recovery goals for programs and the Department overall. Programs are a significant generator of revenue for the Department Because of this, all programming staff must understand cost recovery goals for their respective areas.
It is also important to note that within the framework of cost recovery, the Department has had some philosophical changes in the past 10-15 years, as shown in Figure E5. During the 2010–2012 timeframe, there was less focus on cost recovery and revenue generation. At that time the focus was on maximizing participation with minimal fees. Beginning in 2012-2013, the philosophy shifted with leadership, and there was more focus on cost recovery and revenue generation. Most recently the philosophy has shifted again with a more balanced approach of maximizing revenue where possible to help support other areas within the Department.
5. Staffing: The most critical issue expressed through staff interviews was staffing. The ability to recruit, hire, and retain staff, both full-time and part-time, is extremely challenging. That challenge has impacted the Department’s ability to staff and open facilities and to maintain or expand programming. This is a common concern across the country in almost every job sector, with no easy solutions to the problem. The common solutions that are being employed are increasing wage scales, expanding benefit opportunities, and increasing job flexibility.
6. Marketing: The second most critical issue expressed through staff interviews was the ability to market programs to the community. Almost every staff member felt that the Department could do more to market facilities and programs to residents. The current methods that staff use are:
• Website: The Department’s website is extensive with easy-to-navigate and easy-to-find information on programs and how to register for programs.
• Social Media: The Department has multiple social media outlets of their own that are used to push program information to the community. Staff also work with other City departments to help promote activities and bring attention to special events.
• Brochure: The Department continues to develop a program brochure. However, it is not mailed to all residents. The brochure is digitally available online through the website or via PDF download.
• Flyers: Department staff can work with other City departments to have flyers developed for programs that then can be distributed.

The staff’s concerns about marketing focused primarily on the development of flyers. The current process is for Department staff to submit a request for a flyer to be developed and include all necessary information. This is a fairly common practice. The challenge for staff is that the lead time for the flyer to be developed commonly takes weeks, possibly months. This significantly hinders the staff’s ability to be agile with their marketing. Given the depth and breadth of the Department, having an in-house graphic position to facilitate these types of requests could result in improved marketing efforts.
The development of a program brochure, while once standard practice, has evolved alongside technology. Some agencies do not produce brochures anymore, others develop brochures and make them only digitally available online, while other agencies develop brochures and make them available online and distribute them.
Provided the socioeconomics of Greenville, not all households have access to computers or the ability to register for programs online. Because of this, adopting a hybrid approach to program brochure distribution may better reach residents and increase participation. Three (3) steps may be followed:
• Continue to create the brochure on the seasonal basis currently used. Copies of the brochure should be printed and available at all municipal facilities. Based on participation information, brochures should be mailed to areas of the community that are underrepresented in program participation.
7. Facilities: The Department has a wide variety of facilities and facility types. This enables the Department to host a wide variety of programs for the community. However, in many cases, the Department has been or is in the process of outgrowing these facilities. This challenge becomes sequential in that time is needed to expand programming, but if that time does not exist expansion becomes impossible. Programs are difficult to relocate or shut down while renovation, expansion, or replacement of facilities occur. Developing plans to accommodate these needs will help to ensure consistent operations and allow for programs to retain participants.
Public engagement is essential in planning as it ensures that the community’s needs and opinions are taken into account when making important decisions. Engaging the public in the planning process allows for a transparent and inclusive approach, which can increase public trust and support for development projects. Additionally, involving the public can help identify potential issues and concerns early on, enabling the City to address them before they become major problems. By fostering a collaborative relationship between the City and the community, public engagement can lead to better-designed communities
20 Focus Group Participants
314
303 Statistical Survey Responses Online Survey Responses

1,000 Business Cards and 600+ Pieces of Candy Distributed
270+ hours of Public Engagement Participation
65 Write-In Comments
10,000 Facebook Ads
KEY TAKEAWAYS:
Key Takeaways:
• Planning efforts balanced qualitative (public input) and quantitative (data) engagement techniques.
Statistical survey was random (each household had an equal opportunity) and stratified to match the city’s demographics and confirmed online survey results.
Highest needs and importance for recreation facilities focused on mostly passive uses: trails and sidewalks, nature preserves, smaller neighborhood parks, and gathering spaces.

• Highest needs and importance for activities include nature enjoyment, history/museums, fitness/wellness, senior adults, and performing arts.
Development of trails (46%), maintenance of existing parks (45%), and acquisition of more parkland (34% neighborhood; 32% natural lands) were the top four supported actions, with a willingness to fund.
Over 78% of respondents are willing to provide additional tax funding to improve parks and recreation offerings.
• Majority of respondents support additional or higher user fees/charges (75%) and support use of park foundation (64%) and sponsorships (58%) for alternative funding.
that meet the recreation and park needs of residents and promote social, economic, and environmental sustainability. Ultimately, public engagement is crucial for creating livable, vibrant, and equitable park spaces that benefit all members of the community.
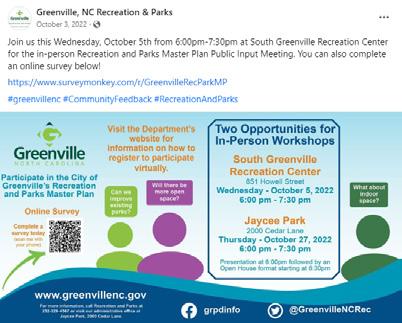
Public engagement has undergone significant changes in recent years, driven by technological advancements and shifting social and political dynamics. The rise of social media platforms has enabled individuals to easily connect and share information, leading to increased levels of online activism and grassroots movements.


Additionally, the COVID-19 pandemic forced many public engagement efforts to move online, with virtual meetings and events becoming the norm. This has allowed for greater accessibility and inclusivity, as individuals who may not have been able to attend in-person events can now participate from anywhere with some methods, at any time. However, there are also concerns about the impact of these changes on the quality and effectiveness of public engagement efforts, as well as social equity in access to technology. This master plan sought to balance techniques used by having in-person events as well as virtual and digital offerings.
The following provides a brief overview of the public engagement events facilitated during the development of this master plan:
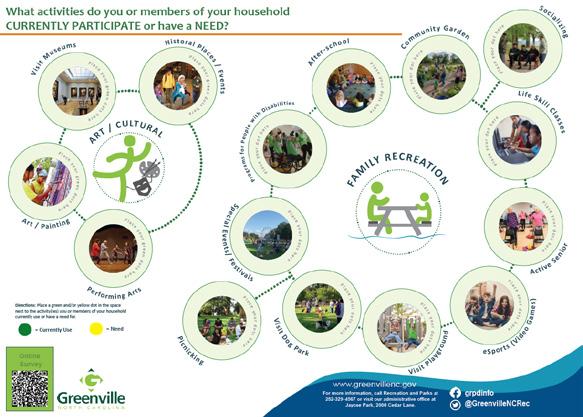
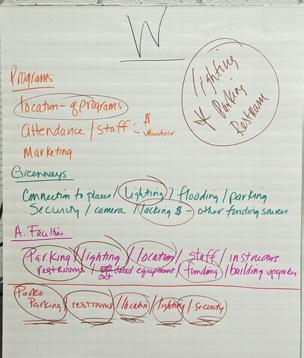
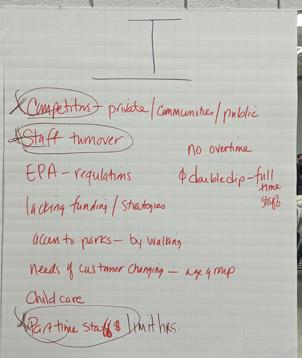
Two in-person Community Workshops were held to gather input for this master plan. The first was hosted on October 5, 2022 at South Greenville Recreation Center. Discussion was focused on specific recreation facilities. The second Community Workshop was held on October 27, 2022 at Jaycee Park. Exercise stations involved identifying recreation options participant households currently use and which they need as well as writing in thoughts on the best qualities of Greenville’s Parks and Recreation programs.
In early October 2022, a series of four (4) public online Focus Group sessions was held open to the public and one (1) Focus Group session was held in late November for City Staff. Sessions began with a presentation of the Master Plan project overview and timeline, park evaluation findings, and an overview of survey participation opportunities. Following the presentation, a series of questions prompted attendees to provide input on priority setting, vision for the recreation and parks system, the role the City plays in achieving that vision, opportunities for funding partnerships, and other park facilities and programs participants had experienced elsewhere that they would like to see in Greenville.

Stakeholder interviews with individuals were conducted to receive specific feedback of day-to-day functionality and challenges. Individuals were identified by Department staff and interviews were completed during October and November of 2022.
These three types of public engagement form the basis of the qualitative techniques. Additionally, two quantitative techniques were used and consisted of a statistical survey of city residents and an online survey open to all willing participants.

August 18, 2022
Stakeholder & Focus Groups Interviews

October 5-7, 2022
The Planning Team met with Department staff in Greenville to review project goals and schedule. A series of stakeholder interviews and focus groups was held to answer introductory questions about how parks are used and their goals for the system.



Community Workshop #2

Jaycee Park
October 27, 2022
Community Workshop #1

South
Sept. 22, 2022
Online
October 3, 2022
Center October 5, 2022
November 4, 2022
Statistical Survey Completed
November 6, 2022
Online Survey Completed



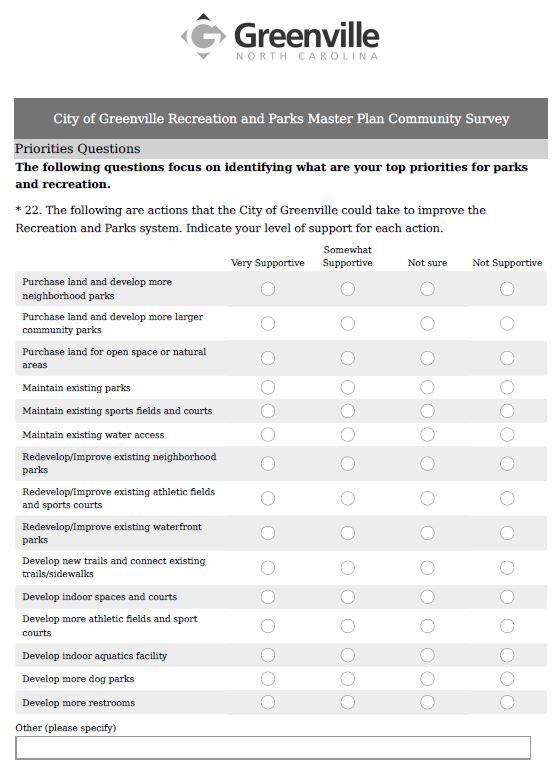
A statistical survey was mailed to over 2,000 randomly selected households across the city. Each household had an equal chance of being selected. Methods to complete the survey included by mail (return postage was included), by phone, or by website, with 314 completed surveys received. The survey was available in multiple languages and directions were provided with a toll-free phone number. Facebook ads were utilized with a geographic reference of the city’s limits. Respondents that completed a survey online were asked to provide an address which was reviewed to ensure the respondent was a city resident. Responses were limited to one per address. Results were weighted to match the demographics of the city.
Question topics included which programs and facilities participants currently use, satisfaction with existing recreation and parks, barriers that prevent them from using parks and programs, support for improvement actions, and input on funding and tax actions. The following pages present key results from the statistical survey. Full statistical survey results can be found at Appendix A.

An online survey was available to complete by any willing participant from late September to early November 2022. A QR code was included on handout materials and business cards for participants to scan with a smartphone, and a link was posted via social media and emails by the City. In total, 303 survey responses were collected. Demographic questions were included to qualify results and ensure the ability to cross-tabulate responses from city residents compared to all responses. Approximately 70% of responses were from city residents.
Questions were similar to those included in the statistical survey with a few additional. The Department’s website and social media accounts were used to distribute information for the survey. Staff handed out business cards at a community Trunk or Treat Halloween event at Greenfield Terrace Park. Results from the online survey were consistent and within the margin of error for most questions from the statistical survey and helped to confirm results. See online survey results at Appendix B


The public engagement outcomes are valuable to informing recommendations of this master plan to work towards a long-term plan that serves specific community needs. Information provided through public engagement can be best used to inform more specific decisions regarding projects, funding, and priority setting.
Q1a. Indicate if you use the following major parks and recreation amenity types provided by the City of Greenville.
Walking paths, trails, community pools, public restrooms, and small neighborhood parks are the most used amenities.
Q2. Which three (3) parks and recreation amenities/facilities do you think should receive the most attention from the City over the next two (2) to four (4) years?
Responses identify a priority to the most used amenities/facilities in the next two to four years.

Q3. Do you feel there are sufficient parks and greenspace areas within walking distance of your residence?
Access LOS Analysis identfies that 25% of residents are within walking distance of a park or open space when defining ‘walking distance’ as a 1/2 mile or 10 minutes. For this question, 33.9% of residents responded that they feel they have sufficient greenspace within walking distance of their residence, indicating a willingness to travel longer distances to visit greenspace.
Q4b. Overall, how would you rate the quality of the programs offered by the City of Greenville that you and members of your household participated in?
Residents of Greenville find a higher level of satisfaction (94.1%) from programs being offered by the Department than national averages (79%).

Q7. Reasons that prevent you or other members of your household from using parks, trails, recreation, and aquatic facilities or programs in Greenville more often. (Top 10 results)
Compared to national averages, City of Greenville residents are over three times as likely to not use recreation and parks facilities because of the distance from their residence.
City of Greenville National Averages (where possible)
Parks/facilities too far from residence
Lack of sidewalk or bike lane access
Security is insufficient/loitering
Lack of restrooms
I do not know what is being offered
I do not know locations of parks/facilities
Program or facility not offered
Lack of interesting amenities or programs
I have physical limitations
Lack of public transportation
Q17. Identify all the ways you prefer to learn about City of Greenville recreational programs and activities.
City/Department website

Social media (Twitter, Facebook, etc.)
Recreation brochures
From friends and neighbors
Newspaper ads/articles
Email blasts
Radio or cable television
School flyer/newsletter
City/Department Staff
Typically in the top three barriers for most communities. This shows how well the City communicates information for programming options.
The City/Department website, social media, and brochures are the ways that residents prefer to learn about recreational programs and activities.
Online and social media are preferred methods to inform residents of information.
Q5c. Number of households that indicated they have a need for the following park/recreation facility that is currently only being met 50% or less.
Walking paths/sidewalks, natural parks & preserves, and trails/multi-use paths/ greenways had the highest indicated need. Adult and youth softball and baseball fields, tennis courts, and multipurpose fields had the lowest indicated need.
Walking Paths/Sidewalks (43%) and Natural Parks and Preserves (37%) are the two highest needed recreation amenities by residents.

Q6. Which four (4) recreation facilities do you think are most important for you and members of your household? (Top 10 results)
The top four facilities identified as having a need are the same facilities identified as most important to Greenville households.
Top three results are consistent with facilities that have the highest level of unmet need.

Q8c. Number of households that indicated they have a need for the following park/ recreation facility that is currently only being met 50% or less.

History & museums, nature enjoyment, and performing arts had the highest indicated need. Special population activities, youth sports, and eSports had the lowest indicated need.
History/Museums (43.1%) and Nature Enjoyment (35.8%) are the two highest needed recreation activities by residents.
Q9. Which four (4) recreation activities are most important for you and members of your household? (Top 10 results)
When asked to rank importance, nature enjoyment became the leading activity by nearly 20% higher than the next activity.
Access to nature enjoyment is a clear priority for households in Greenville.
Q10. Which four (4) recreation activities do you currently participate in most often (Top 10 results)
Nature enjoyment was indicated as having the second most need, ranked as the highest most important activity, and most frequent use.
Residents in Greenville participate at high levels and desire more access to nature enjoyment.
Accessibility to senior adult activities and history/museum opportunities may be currently limited due to the number of offerings; however, residents desire more.

Q12. Rate your level of support of each of the following actions that the City of Greenville could take to improve the recreation and parks system.

The actions that received the most support are focused around maintenance of existing facilities, development of new trails/sidewalks, and redevelopment of exiting waterfront parks.
Maintain existing parks
Develop new trails & connect existing trails/sidewalks
Maintain existing water access
Maintain existing sports fields & sports courts
Redevelop/improve existing waterfront parks
Redevelop/improve existing neighbhorhood parks
Develop more restrooms
Purchase land for open space or natural areas
Purchase land and develop more neighborhood parks
Purchase land and develop more larger community parks
Redevelop/improve existing athletic fields & sport courts
Develop indoor/outdoor aquatics facilities
Develop indoor spaces & courts
Develop more dog parks
Develop more athletic fields & sports courts
Q13. Which actions would you be most willing to fund with your tax dollars?
Develop new trails & connect existing trails/sidewalks
Purchase land and develop more neighborhood parks Maintain existing parks
Purchase land for open space or natural areas
Purchase land and develop more larger community parks
Develop more restrooms
Develop indoor/outdoor aquatics facilities
Redevelop/improve existing waterfront parks
Maintain existing water access
Maintain existing sports fields & sports courts
Develop more dog parks
Redevelop/improve existing athletic fields & sport courts
Develop indoor spaces & courts
Develop more athletic fields & sports courts
The actions most supported by a willingness to fund with tax dollars focus on development of trails/sidewalk, maintaining existing parks, and acquisition of additional parkland.
Q14. Check the additional amount you would be willing to pay in additional taxes to fund the action that you indicated as most important to your household.

Over 78% of respondents indicated a willingness to pay additional taxes to fund improvements to parks and recreation.
Q15. Which choices of alternative funding for parks, recreation facilities/programs,and trails do you most prefer?
A majority of respondents support use of a parks foundation and sponsorships as alternative funding sources.
Through the completion of various public engagement and research techniques, a number of parks and recreation needs and priorities emerged. Figure G1 provides a summary overview of the findings from each analysis technique, which were further refined based on additional public input and analysis.

Three types of research were utilized in a mixed-methods, triangulated approach to a needs assessment process: observational, qualitative, and quantitative. Together, these research methods provided multiple opportunities to cross-check results and better determine an accurate understanding of Greenville’s needs and priorities for parks, recreation facilities, and programming.
The top ten facilities and programs needs are identified as a means to concisely present findings. These facilities and activities are ones identified through multiple techniques to have the highest level of importance and most unmet need by the community. In addition to the identification of the top community-wide needs from public participation and survey techniques, overall priorities have emerged and are listed in descending order to the right.
KEY TAKEAWAYS:
Key Takeaways:
• Recreation and park facility top needs include trails, additional parks, and select athletic facilities.
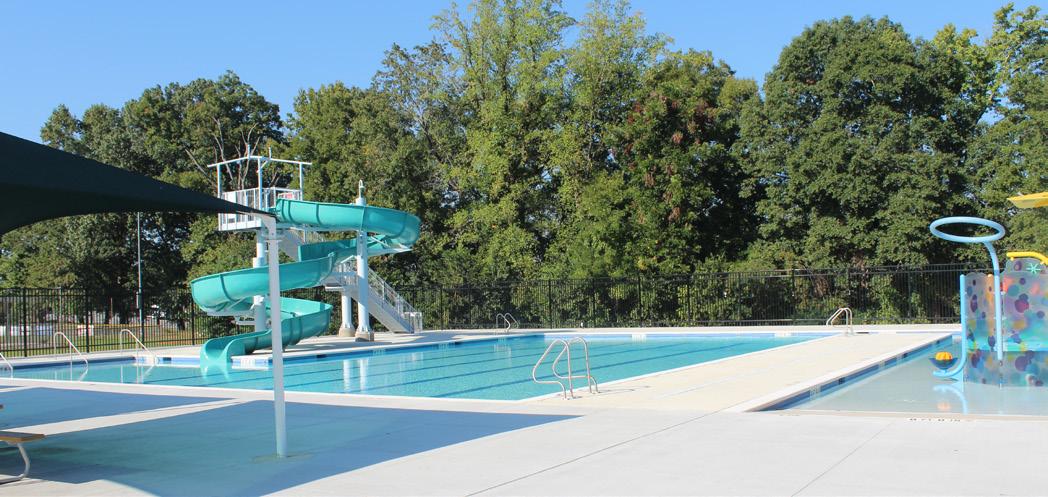
• Top recreation program and activities include diverse opportunities from fitness/wellness to nature enjoyment, racquet sports, and adventure recreation.
• Priorities focus on implementation of the City’s (MPO’s) bike and pedestrian connectivity projects, obtaining additional funding, and diversifying programming and facility offerings.
KEY TAKEAWAYS:
Top 5 Priorities:
1. Enhance bike and pedestrian accessibility, including to park destinations.
2. Provide equitable access to parks through connectivity and new acquisition or development.
3. Diversify programming to better meet changing demographics and interests.
4.Prioritize natural parks and blueway programming to better connect to water.
5. Prioritize alternative funding options to provide operational funding and additional capital improvements funding.
Facilities
= Indicates High Needs
= Indicates Medium Needs
= Indicates Lower Needs
Walking Paths / Sidewalks
Trails/Multi-Use Paths/ Greenways
Smaller Neighborhood Parks
Larger Community Parks
Natural Parks and Preserves
Pickleball Courts
Restrooms (Public)
Multi-Purpose Fields (Soccer, Lacrosse, etc.)
Outdoor Exercise Equipment
Canoe/Kayak Launches
Fitness and Wellness
Nature Enjoyment
Programs and Activities
Racquet Sports (Tennis, Pickleball, etc.)

Performing Arts (Dance, Theater, etc.)
Outdoor Adventure (Rock Climbing, etc.)
Special Events/Festivals (Movie Night, etc.)
Aquatics (Learn to Swim, Therapy, etc.)
Water-Related Activities (Fishing, etc.)
History and Museums
Yoga/Pilates/Zumba
Biking/Mountain Biking
Needs Assessment Techniques

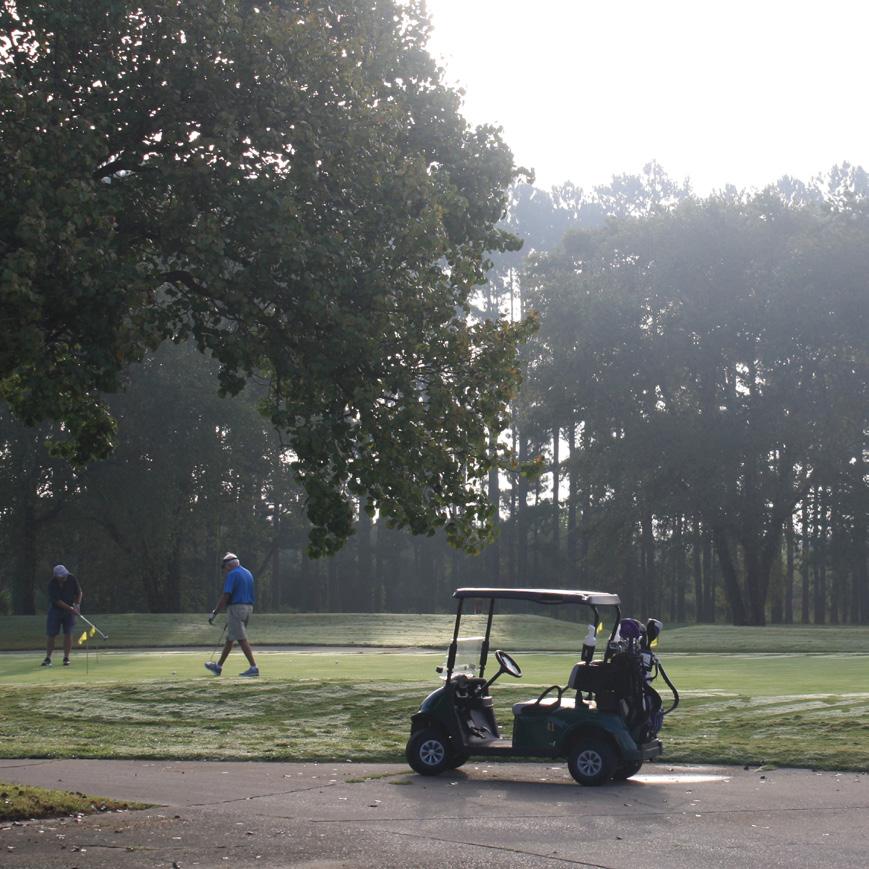


Long-range visions are crucial for effective planning because they provide a roadmap for development over time. By considering factors such as population growth, changing demographics, physical conditions of facilities, and public input, the City can create a blueprint that not only meets the current needs of residents but also anticipates future needs.
Long-range visions can help elected officials make informed decisions about park development, acquisitions, funding, and modifications to policies, among other things. Without a long-term plan, park and recreation systems risk becoming irrelevant to residents and negatively impact quality of life. Therefore, having a long-range vision is essential for creating livable, sustainable, and thriving neighborhoods that can adapt to changing needs and priorities while continuing to meet the needs of their residents well into the future.
The Recreation and Parks Department has a defined vision to ‘To advance parks, recreation, and environmental conservation efforts that promote mental and physical health, serve as a deterrent to illegal or inappropriate behaviors, and enhance Greenville’s quality of life.’ By extrapolating this vision statement to incorporate the framework distilled from

KEY TAKEAWAYS:
Key Takeaways:
• Greenville’s vision for recreation and parks builds upon the vision established by the City’s Horizons 2026 plan.

• Comprehensive Vision consists of five (5) components defined through public engagement and review of characteristics of the recreation and parks system.
• Working as an interconnected system, the five components identify clear initiatives that can be championed by advocates and progressed by staff.
Specific goals and objectives are defined to assist in progressing the overall vision.
public input and comprehensive analysis, a set of unique components (Figure H1) can be identified. Combined, these diverse components will guide the development of parks and recreation facilities across the city. Each component was developed through community input and analysis of the existing physical system. Guiding principles identified for each component describe the community’s aspirations for the overall system and physical attributes. Accomplishment of this vision will be dependent upon City staff, existing and future partners, and the support of residents.








Guiding principles for waterfront, natural, and passive parks include the following:


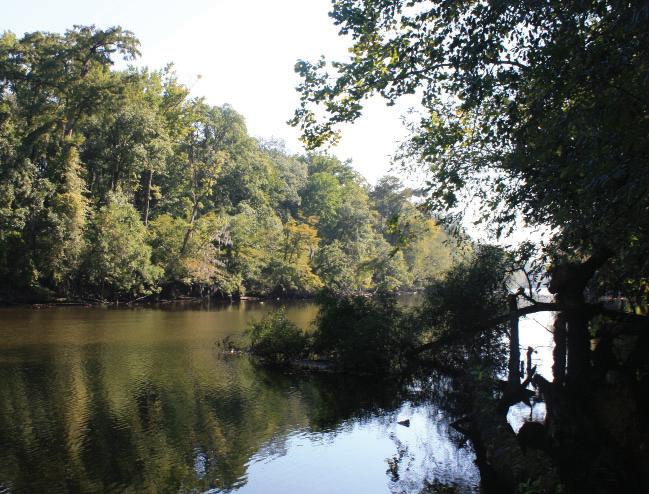
1. Increase Conservation of Biodiversity: Protection and preservation of unique ecosystems and biodiversity, providing a haven for endangered species and rare habitats.


2. Increase Recreational Activities: Offering of opportunities for hiking, bird watching, fishing, and other outdoor recreational activities, which promote physical fitness and mental well-being.




3. Promote Education and Research: Provide opportunities for scientific research, education, and interpretation of natural and cultural resources, enabling people to learn about the environment and history of a particular area.


4. Enhance Economic Benefits: Waterfront and natural parks often attract tourists, which can generate revenue, create jobs, and help to retain local leisure activity expenditures.
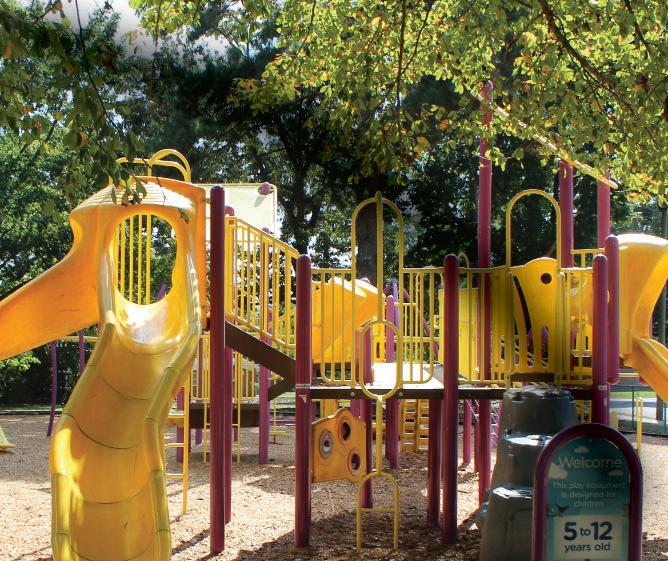
5. Improve Resiliency: Provide a vital role in enhancing resiliency by absorbing environmental shocks, mitigating hazards, and protecting local environments.


Guiding principles for community, neighborhood, and pocket parks include:

1. Promote Physical Activity: Provide a space for people to engage in physical activity, such as walking, running, and playing sports. This helps promote physical health and can reduce the risk of obesity and other health problems.
2. Enhance Mental Health: Spending time in parks has been shown to improve mental health and reduce stress levels. Parks provide a peaceful and relaxing environment for people to escape the stresses of daily life.


3. Foster Social Connections: Bringing people together and providing a space for community members to socialize and connect. This helps build a sense of community and can lead to increased social cohesion.
4. Provide Educational Opportunities: Providing opportunities for people to learn about nature and local environments. This can help foster a sense of environmental stewardship and promote sustainability.


5. Improve Property Values: Increase or sustain property values and make neighborhoods more attractive to homebuyers. This can lead to economic benefits for the community as a whole.
Guiding principles for indoor/outdoor athletic facilities include:


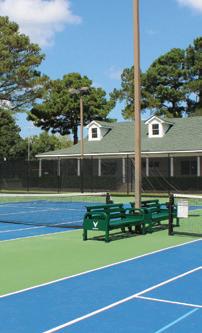




1. Improve Community Health: Municipal sports complexes can promote physical activity and encourage people to lead healthier lifestyles. They provide a space for people of all ages and abilities to participate in sports and recreation activities.


2. Increase Socialization: Sports complexes also provide opportunities for socialization, where people can meet new friends and interact with others who share their interests.
3. Enhance Economic Benefits: Municipal sports complexes can also have positive economic impacts, as they attract visitors and events to the community, generating revenue for local businesses and the City.
4. Improve Infrastructure: Sports complexes can also help improve the infrastructure of a community by creating new facilities and upgrading existing ones.
Guiding principles for greenways and blueways include the following:


1. Improve Recreation: Provide opportunities for people to engage in outdoor activities such as walking, running, cycling, and hiking. These activities can improve physical health, reduce stress, and promote social interaction.
2. Increase Environmental Benefits: Preserve natural areas and provide habitat for wildlife. Provide green corridors that connect larger natural areas, which is essential for maintaining biodiversity and reducing negative impacts of urbanization.




3. Enhance Economic Benefits: Attract tourists, which can bring economic benefits such as increased property values and can lead to the creation of new businesses.
4. Improve Transportation: Provide alternative transportation options, such as walking or cycling, which can reduce congestion and improve air quality.
5. Enhance Community Connectivity: Provide important connections between neighborhoods, allowing people to access parks, schools, and other destinations without dependence on vehicles.


Guiding principles for recreation programming include:


1. Promote Physical Health: Promote physical activity, which is essential for maintaining good health. Participating in activities like sports, dance, yoga, and fitness classes can improve cardiovascular health, strength, flexibility, and overall physical well-being.


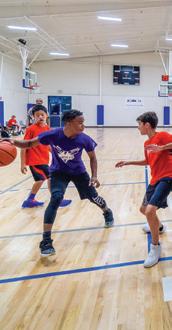
2. Improve Mental Health: Contributing to a positive impact on mental health. Physical activity has been shown to reduce stress, anxiety, and depression, while social activities can help individuals build relationships and a sense of community.
3. Improve Personal Growth: Provide opportunities for individuals to try new activities and challenge themselves to learn new skills. By learning, individuals can build confidence, self-esteem, and a sense of accomplishment.
4. Promote Community Building: Bring people together and foster a sense of community. By participating in group activities, individuals can meet new people, make friends, and feel a sense of belonging.
5. Promote Lifelong Learning: Provide opportunities for lifelong learning. Individuals can learn new skills and acquire knowledge in a fun and engaging way.
The implementation of recreation and park planning is crucial for the development and sustainability of neighborhoods. Effective planning enables the creation of welldesigned and functional park and recreation spaces that meet the needs of residents and visitors, while promoting social cohesion, improved health, and environmental sustainability. Effective planning also helps ensure that access to resources such as open spaces, playgrounds, athletic fields and courts are efficient and equitable.
Planning helps to ensure that the built environment is safe, accessible, and resilient to natural disasters and other shocks. Recreation and parks planning also plays a key role in shaping the character and identity of Greenville, reflecting its cultural, historical, and natural heritage. Overall, the implementation of recreation and park planning is essential for creating livable, prosperous, and resilient neighborhoods that meet the needs of present and future generations.
To advance the Long-Range Vision established for Greenville, implementation strategies must be defined and priorities established. Implementation strategies play critical roles in making the vision realistic and are intended to provide guidance in bringing the master plan vision to reality through four critical

• The Department cost recovery rate has rebounded to 20.6% for 2023, higher than the 2019/pre-pandemic rate of 18.3%.
Inflation has resulted in a reduction of funding value by 7.7% since 2012 while factoring numerical increases.
• Capital projects and land acquisition have been grouped into three (3) phasing timeframes: Short-Term (1-5 Years), Medium-Term (6-10 Years), and Long-Term (10+ Years).
• 65% of total costs are recommended for completion or substantial progress within the next ten (10) years.
• Historic trends in capital improvement funding may provide between $16.7$34 million over next ten years, 22-45% of needed funding, therefore requiring additional sources.
• Partnerships are key for implementation and may help to reduce projected costs.
• Short-term projects have a probable cost estimate of $40.5 million, with the Town Common bulkhead replacement deferred costs representing $22 million or 55%.
• Short-term projects require an additional $616,567 in operating and maintenance (O&M) costs annually resulting in approximately 5-6 additional FTE positions.
elements: funding analysis, probable cost estimate, phasing strategies, and prioritization.
The Long-Range Vision identified five (5) components, each defined through a series of guiding principles. Defining each component allows City staff to better understand how to address needs and priorities identified throughout the planning process, as well as individual park needs that resulted from the park evaluations and public input.
Utilizing this information, recommendations intended to satisfy system-wide objectives have been developed at an individual park level. These recommendations form a portion of the probable cost estimate. In addition to costs associated with visionbased recommendations, cost estimates also incorporate projects that have been previously identified by the Department, including requested or unfunded projects identified in the Capital Improvement Plan (CIP).

Revenues and expenditures over the last decade (Figure I1) have remained consistent. Many communities were quick to reduce expenditures as uncertainties arrived in early 2020, only to find out in some cases that revenues were not as impacted or were impacted in ways that balanced incoming federal and state subsidies.
Funding for fiscal year (FY) 2023 is 9% above the historic average; however, it must be noted that while funding has remained consistent numerically across the last 10+ years, when inflation is considered, funding is 7.7% below 2012 value. Since 2012, inflation has reduced values by 30%, wiping out all increases in funding realized by the Department.
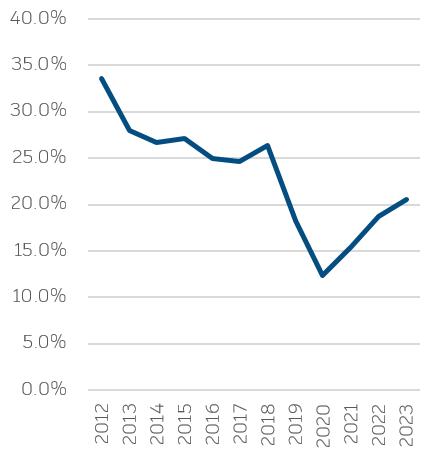
During FY 2020, revenues decreased approximately 30% from FY2019 levels. Expenses decreased 10% the following year in FY 2021 in response to facility and park closures. Before the pandemic, the Department’s cost recovery
YearExpensesRevenues
2012 $6,504,517$2,181,639
2013 $7,254,788$2,032,002
2014 $7,429,094$1,981,598
2015 $7,400,170$2,007,186
2016 $7,457,419$1,864,662
2017 $7,503,495$1,851,389
2018 $7,573,949$1,999,487
2019 $6,884,779$1,262,688
2020 $7,184,198$888,220
2021 $6,497,083$1,001,475
2022 $7,206,678$1,347,050
2023 $7,936,842$1,631,850
Avg. $7,236,084$1,670,771
Note: 2023 figures are projected
Note: 2023 figures are projected
was already decreasing, from 33.5% in FY 2012 to 18.3% in FY 2019, Figure I2. As the impacts of the pandemic reduced revenues, the cost recovery dropped to a low of 12.4% in FY 2020. Since reaching a low point in FY 2020, cost recovery has increased to a projected 20.3% in FY 2023.
Historic sources of funding for the Department have been the City’s General Fund (property taxes, sales tax, utility fees, transfers, etc.) and the Facilities Improvement Fund (FIP) which splits the funding of deferred maintenance capital projects between the Recreation and Parks Department and Public Works Department. Over the last 15 years, the average annual capital improvements funding has been $1.67 million. Over the last five years, a few significant capital projects have been funded which has increased the five year average up to $3.4 million annually, Figure I3. This increase is a result of the City receiving several grants and sizable donations used to fund capital projects. If these trends are assumed to continue over the next ten years, the Department could expect to receive between $16.7 and $34 million in funding for capital funding.
dollars for complete implementation of all five (5) components of the Vision (Figure I4). Replacement of the bulkhead at Town Common is an outlier as this project represents a significant unfunded deferred maintenance need and at an estimated $22 million in cost, is 55% of the total short-term capital projects.
Based on cost estimates derived from parks and open space evaluations and projects identified in Capital Improvement Program (CIP) requests and recommendations associated with the Master Plan Vision, the estimated probable cost is approximately $116.6 million in 2023
The total capital costs estimate includes system improvements anticipated to occur to establish and maintain park delivery within ten (10+) years. Estimated costs are aligned to park components. The full list of projects and estimated costs used to derive the total estimate includes over 130 line items. Escalation is an important consideration for medium-and long-term projects primarily. The US Bureau of Labor Statistics - Consumer Price Index was 9.49% in 2022 and was projected to be 4.5% in 2023 and 2.9% in 2024. Construction cost increases should be considered prior to a project progressing into the funding stage.

An additional cost consideration is the role that partnerships may have in reducing capital or acquisition costs for the City. Implementation of higher cost facilities such as greenways should first consider opportunities to partner with the Greenville MPO or other agencies. Partnerships have the potential to significantly reduce costs, while remaining projects could be further reduced through strategic use of grants.
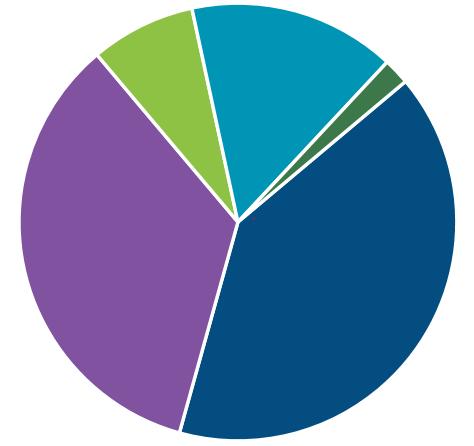

The following includes exerts of an article published by NRPA (Dec. 2021) and written by John L. Crompton, Ph.D, a noted professor of Park, Recreation, and Tourism Science at Texas A&M and elected council member for the City of College Station.
Courts have consistently endorsed and enhanced the principle of communities passing the costs of growth through to new residences that created the costs. The following information highlights the evolution of parkland dedication ordinances that has occurred over the past half century.
One the oldest approaches to obtaining parkland was through land dedication which typically included a fixed formula imposed mandating the dedication of land for parks. Developers are required to deed a specified amount of land on their site for a park. A primary challenge with this approach is that many development projects are relatively small in acreage, resulting in small park spaces being dedicated. These fragmented parks spaces offer limited potential for recreation and are relatively expensive to maintain. Additionally, the cost of development a park, which is typically much more than the value of the land, is not included.
This type of ordinance requires developers to pay a fee-in-lieu of the fair market value of the land that otherwise would have been required with a simple land dedication ordinance. A primary benefit of this type of ordinance is that it frequently means fees can be spent off-site and agglomerated to potentially target larger, more meaningful park acquisition opportunities. For many communities, this
type of ordinance expands options beyond acquiring land. Funds can typically be used to develop improvements on parkland and/ or to renovate or expand existing parks.
The emergence of park development fees over the last couple decades reflects a realization that providing only land requires existing taxpayers to pay the costs of transforming land into a functioning park. Thus, some communities have adopted park development fees as a mechanism to offset costs associated increased needs from new development. Development fees are frequently paired with parkland dedication ordinances.
Similar to most parkland dedication ordinances, park impact fees frequently consist of a fixed formula fee on a per dwelling unit basis for new construction. In North Carolina, city governments may impose impact fees for corporate limits as well as its extraterritorial jurisdiction districts (ETD). At the core of impact fees, is the purpose of placing equitable share of costs for new community facilities upon developers and inhabitants of newly developed areas. Whereas to fully capture the added burden of new development, a community would need to enact either a parkland or fee-in-lieu of parkland ordinance plus a park development fee ordinance, a park impact fee typically allows more flexibility to utilize fees for capital outlay items such as acquisition of land or development of parks and recreation facilities within the rational nexus of meeting the needs of the new development.
Although courts have embraced these ordinances, relatively few cities have adopted these measures. Consequently, the unrealized potential of parkland dedication ordinances is arguably the lowest hanging fruit of capital funding sources for parks.

The Phasing Plan for capital improvement projects is comprised of three (3) different phases based on community needs and priorities and input from Department staff. These phases, summarized in Figure I5, provide a framework for the implementation of over $116.6 million in capital improvements. Approximately 35% of total capital costs is included in the short-term phase, which means targeted for completion or substantial progress in the next 1-5 years. An additional 30% of projects is shown in the medium-term phase, to be completed in the next 6-10 years. Finally, the long-term phase includes projects that have a lower priority or take longer to identify funding or partners. These projects are likely to not be completed within the next ten (10) years and represent 35% of project capital costs.


With the addition of new facilities and increased park acreage, O&M costs can be expected to increase. This plan is conservative in the assumption that the replacement of existing park amenities or facilities will result in a minimal cost adjustment for O&M. Improving existing parks or adding new parks and facilities will commonly result in additional O&M costs, however, in some cases costs may be reduced. Figure I7 identifies the estimated phased annual increase in O&M costs for new and existing facilities.
Additional short-term O&M costs are projected to be $616,567 annually, resulting in approximately 5-6 additional FTE staff positions based upon a national average of $103,272 in funding per FTE position.
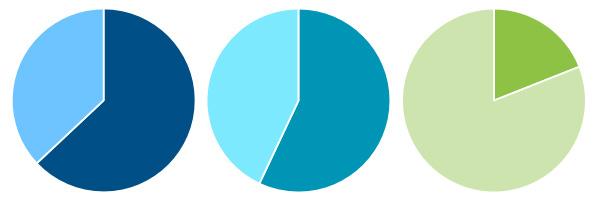
Full implementation of the Long-Range Vision is estimated to increase O&M by approximately $2.89 million annually, or 3% of capital improvements. This equates to an estimated $30,000 in O&M costs for each $1 million in capital investment, however, higher costs are associated with the addition of new facilities or amenities vs. replacement. Additional staffing needs from implementation of short and medium-term projects would result in 15-17 FTE positions. New positions would be spread across divisions and may include park rangers, special event staffing, trail and facility maintenance
In order for the Department to be able to prioritize projects, a criteria is needed that responds to community-wide needs and goals. The following criteria, Figure I8, can be used as a test for each opportunity or project in order to determine its level of priority in comparison to other projects. This will promote the maximum efficiency of limited resources for the Department.
When the prioritization criteria is applied to projects, the following are the highest scoring in descending order by phase timeframe. Figure I9 identifies the top 20 projects for completion within the next five years; Figure I10 identifies the top 20 projects to be completed within the medium-term timeframe or in the next 10 years. Figure I11 identifies the top 15 priority projects for the long-term timeframe or those that may take more than ten years to implement.


Utilizing multiple funding sources has become the most effective way of maximizing the amount of funding a community can obtain. Grant stacking allows a project to draw funding from several sources. The idea of grant stacking refers to grouping grants of varying levels (federal, state and local) to support one project. Careful selection of grants can result in one grant providing the matching funds requirement for another grant and the reciprocal as well. This process can address acquisition and development in phases to best meet a project’s intent and time schedule.
One specific capital project that may benefit from this strategy, is the Town Common bulkhead replacement. As a significant infrastructure project, seeking alternative funding sources such as state or federal appropriations leveraged by local match funding is recommended. Additionally, seeking hazard mitigation funding sources could utilize the same local match or appropriations.

Cost Recovery is not a philosophy, it is a strategy in the much larger context of how the Department secures and allocates resources, that allows it to maximize services. Fees and charges are considered a responsible and necessary means to supplement tax revenue, with a focus on mission and affordability of the Department’s most critical programs for the City’s most at-risk populations.
Dr. John Crompton notes in his article in Parks and Recreation magazine (January 2020), for fee-based services: “the appropriate policy is to charge the break-even price to higher income cohorts [using the Benefit Principle] and meet the Ability to Pay Principle by giving discounts to low-income users, rather than offering the service to everyone at a reduced price,” or charging everyone the break-even price and effectively excluding low income residents.
The Department should evaluate current policies and goals, and update as them relates to cost recovery. Goals should focus on a total for the Department but have subcategories and goals that feed into the total. At minimum the Department should break out the following facilities from an expense and revenue perspective, which could correlate to cost recovery goals. Greenville
• Recreation Centers (group together)
• Bradford Creek Soccer Complex Greenville Outdoor Aquatic Facility
• Jaycee Center for Arts & Crafts Perkins Baseball Complex
Based upon similar Departments, Figure I12 identifies comparable cost recovery rates for various facility types. The Department will need to continue to evaluate and monitor performance but setting targets for facility operations and disseminating that information outward into the Department is important. An aditional consideration for a change in policy should be to implement a targeted increase in cost recovery combined with a strategy to reinvest additional revenues (above a threshold) directly into the parks contributing.
Exploring potential complimentary providers in the Greenville area will help ensure that neighbors have enhanced and equitable access to recreation and program opportunities. Other organizations that provide facilities and activities include:
• Youth Sports Organizations – Should continue to be responsible for providing some team sports for youth. However, the Department will still need to provide most, if not all, the facilities for these activities. It is recommended that the Department establish a youth athletics council that meets monthly. This council would work to coordinate programs and activities, prioritize athletic facility usage, and promote coaches training
• Pitt County Community Schools –Coordinating with the school district to provide youth after school programs and services, education classes for youth (and even adults), as well as youth sports (location for practices and games), will need to be enhanced. All 33 schools in Pitt County are designated as Community Schools. Playgrounds are designated as school parks and many athletic facilities are utilized through collaboration and partnerships with the community. School trails are surfaced with fine screening and are accessible to wheelchairs, strollers and walkers. Trails and playgrounds are available to the public during non-school hours. Citizens are encouraged to use facilities for physical activity, fun and family activities.
• Other Government Providers – There needs to be strong efforts to partner with other governmental agencies in the area to develop programs and services. This is most likely to occur with Pitt County and neighboring communities. Program
areas that could be provided by other organizations through a partnership include special needs, special events, and outdoor recreation activities. Currently there are 19 additional parks, trails, and other recreation facilities provided by Pitt County, or Winterville, Ayden, Grifton, Farmville, Bethel, Grimesland, or Simpson.
• Non-Profit Providers – Coordinating with a variety of non-profit providers to deliver recreation services needs to continue to be pursued. Organizations such as the Boys & Girls Club, YMCA, cultural arts groups, etc. should be encouraged to continue to develop facilities and provide programs in Greenville. These types of organizations are well positioned to provide a variety of programs in different areas

• Private Providers – There are a considerable number of private recreation, sports, and fitness providers located in the Greenville market (health clubs, dance, martial studios, and arts studios). These entities should be counted on to provide more specialized activities that are difficult for the public sector to conduct.
• Faith Based Organizations – With a significant number of churches and other faith based institutions in the community, they often provide some recreation services for their congregation and community. These organizations should be seen as possible providers of some basic community based recreation services and facilities as well.
• Colleges and Universities – There are several colleges and universities in Greenville including Eastern Carolina University (ECU) and Pitt Community College that could be potential program partners. It is often more difficult to develop direct programs with these institutions but the possibilities should still
be pursued. At minimum, students provide possible program staff and instructors. ECU owns and operates the North Recreation Complex which is located within city limits. Continued exploration of partnership to promote the use of such a sports complex would be the benefit of the City.
• Convention and Visitors Bureau – There should be a strong effort to enhance the existing partnership with the GreenvillePitt County Convention and Visitors Bureau or Greenville-Pitt County Sports Commission to attract and promote additional special events, tournaments and other recreation activities that attract visitors to the community.
• Medical Providers – If the Department truly focuses on fitness and wellness programming in the future then an expanded primary/ equity partnership with Vidant Health or ECU Brody School of Medicine may be essential.
• Social Service Agencies – There is a trend with parks and recreation departments in North Carolina and throughout the country to integrate social services with recreation services. This is particularly true for youth and seniors. As an example, the partnership with the Pitt County Health Department on programming and services continues to be a vital resource. To expand social services, there should be a renewed effort to expand partnerships with other agencies in the area.
• Community Organizations – Developing working relationships with community organizations and service clubs such as the Rotary Club, Jaycee Foundation, and Kiwanis International could provide much needed support for programs as well as facilities. They could also be sponsors.
• Business and Corporate Community – It is important to approach the corporate community with a variety of sponsorship opportunities to enhance the revenue prospects of the Department’s programs and facilities. Recently, the Department has received substantial support from local businesses for numerous capital projects including Grady-White Boats, Inc. and their substantial support of Wildwood Park. With completion of an updated city-wide master plan, the Department’s ability to leverage identified need and community vision for parks and recreation should continue to have an impact on receiving financial support from the business community.

The funding analysis and phasing plan outline considerations for implementing various improvements. The Strategic Plan outlines specific actions needed to implement the vision.
Figure J1 identifies objectives to help implement priorities identified in the previous section. Each goals includes a list of objectives, timeframes, and role that the Department has in implementing three timeframes are utilized: “short-term” represents priority objectives to be completed in the next 1-5 years, and “medium-term” represents objectives that may take up to ten years to complete. The last timeframe is ‘Ongoing’ which is for objectives that are currently being completed and are to continue.
Priority of objectives is tied to public and staff input gathered and documented throughout the needs and priorities assessment. Together, these components will allow the City to review and efficiently revise the implementation plan, as needed in the future, to reflect changing conditions, demographics, or priorities.

• Definition of objectives is intended to assist City staff with implementation prioritization.
• Three categories of time are used to prioritize the Objectives: Short-Term (1-5 Years), Medium-Term (6-10 Years), and Ongoing.
• Objectives items include timeframe and define the role of the Recreation and Parks Department.
• Strategic Plan objectives should be reviewed regularly and updated as priorities change or they are completed.

Continue to develop a safe trail system for the city to increase accessibility to existing parks
Continue to partner with MPO, Pitt County, Winterville and others to identify and develop priority greenway and blueway trails.
Develop standards for trails, trailheads and trail amenities in City parks.
Identify and develop priority blueway launch points at City parks.
Continue to partner with Police Department to identify security needs and best practices for greenway trails.
Enhance and expand programming along the river to achieve goals from the Tar River Legacy Plan.
Diversify programming to accommodate changing demographics and interests
Continue to partner and develop special events in the Uptown area, in regional parks, and the Town Common.
Streamline program development process with standardized costs.

Identify partners to expand programming options including private opportunities.
Increase activation and promote greenways and natural parks with programming.
Identify additional priority sites for fitness stations in parks and along greenways.
Develop and standardize costs determination plan for programs, rentals, and other services provided.
Develop marketing strategies to share program and facility information throughout community.
Provide professional development and training opportunities for full-time and part-time staff to ensure high-quality programming and services.
3
Identify locations for new parks to provide equitable access
Identify opportunities for parkland acquisition for neighborhood and mini parks with vacant, underutilized, or City-owned land.
Explore updates to parkland and greenway dedication ordinances and standards to encourage private partnerships.
Identify priority areas for neighborhood park development using socioeconomic indicators.
Plan and design future neighborhood parks to meet diverse needs of surrounding neighborhoods.
4 4.1
4.2
4.3
4.4
Continue to update and expand existing facilities through the Facilities Improvement Plan and Capital Improvement Program
Add and enhance athletic field and sport court lighting to expand operational hours.
Identify opportunities for converting courts to multi-sport uses.
Develop standard restroom facility template and identify priority sites for implementation.
Identify and incorporate more resilient design best practices, especially for parks in flood-prone areas.
Identify potential priority locations for future athletic fields and courts.
Secure additional staff positions and funding to meet existing needs and in alignment with phased growth.
Identify funding and grants to support maintenance and improvements to all facilities
Explore alternative funding sources: grants, bonds, fee in lieu, etc.
Utilize new master plan to seek grant opportunities more competitively.

Re-evaluate user fees/charges for programming and services with mission and equity in mind.
5.4
5.5
5.6
5.7
Explore a change in existing policy to directly reinvest additional revenues above a set thresold into contributing parks . Explore development of a parkland dedication ordinance and/or fee in lieu development regulations in coordination with Unified Development Ordinance (UDO) update.
Explore development of a City trail fund for annual capital and program costs for greenways network expansion and lifecycle reinvestment.
Enhance and continue to build partnerships with community organizations.

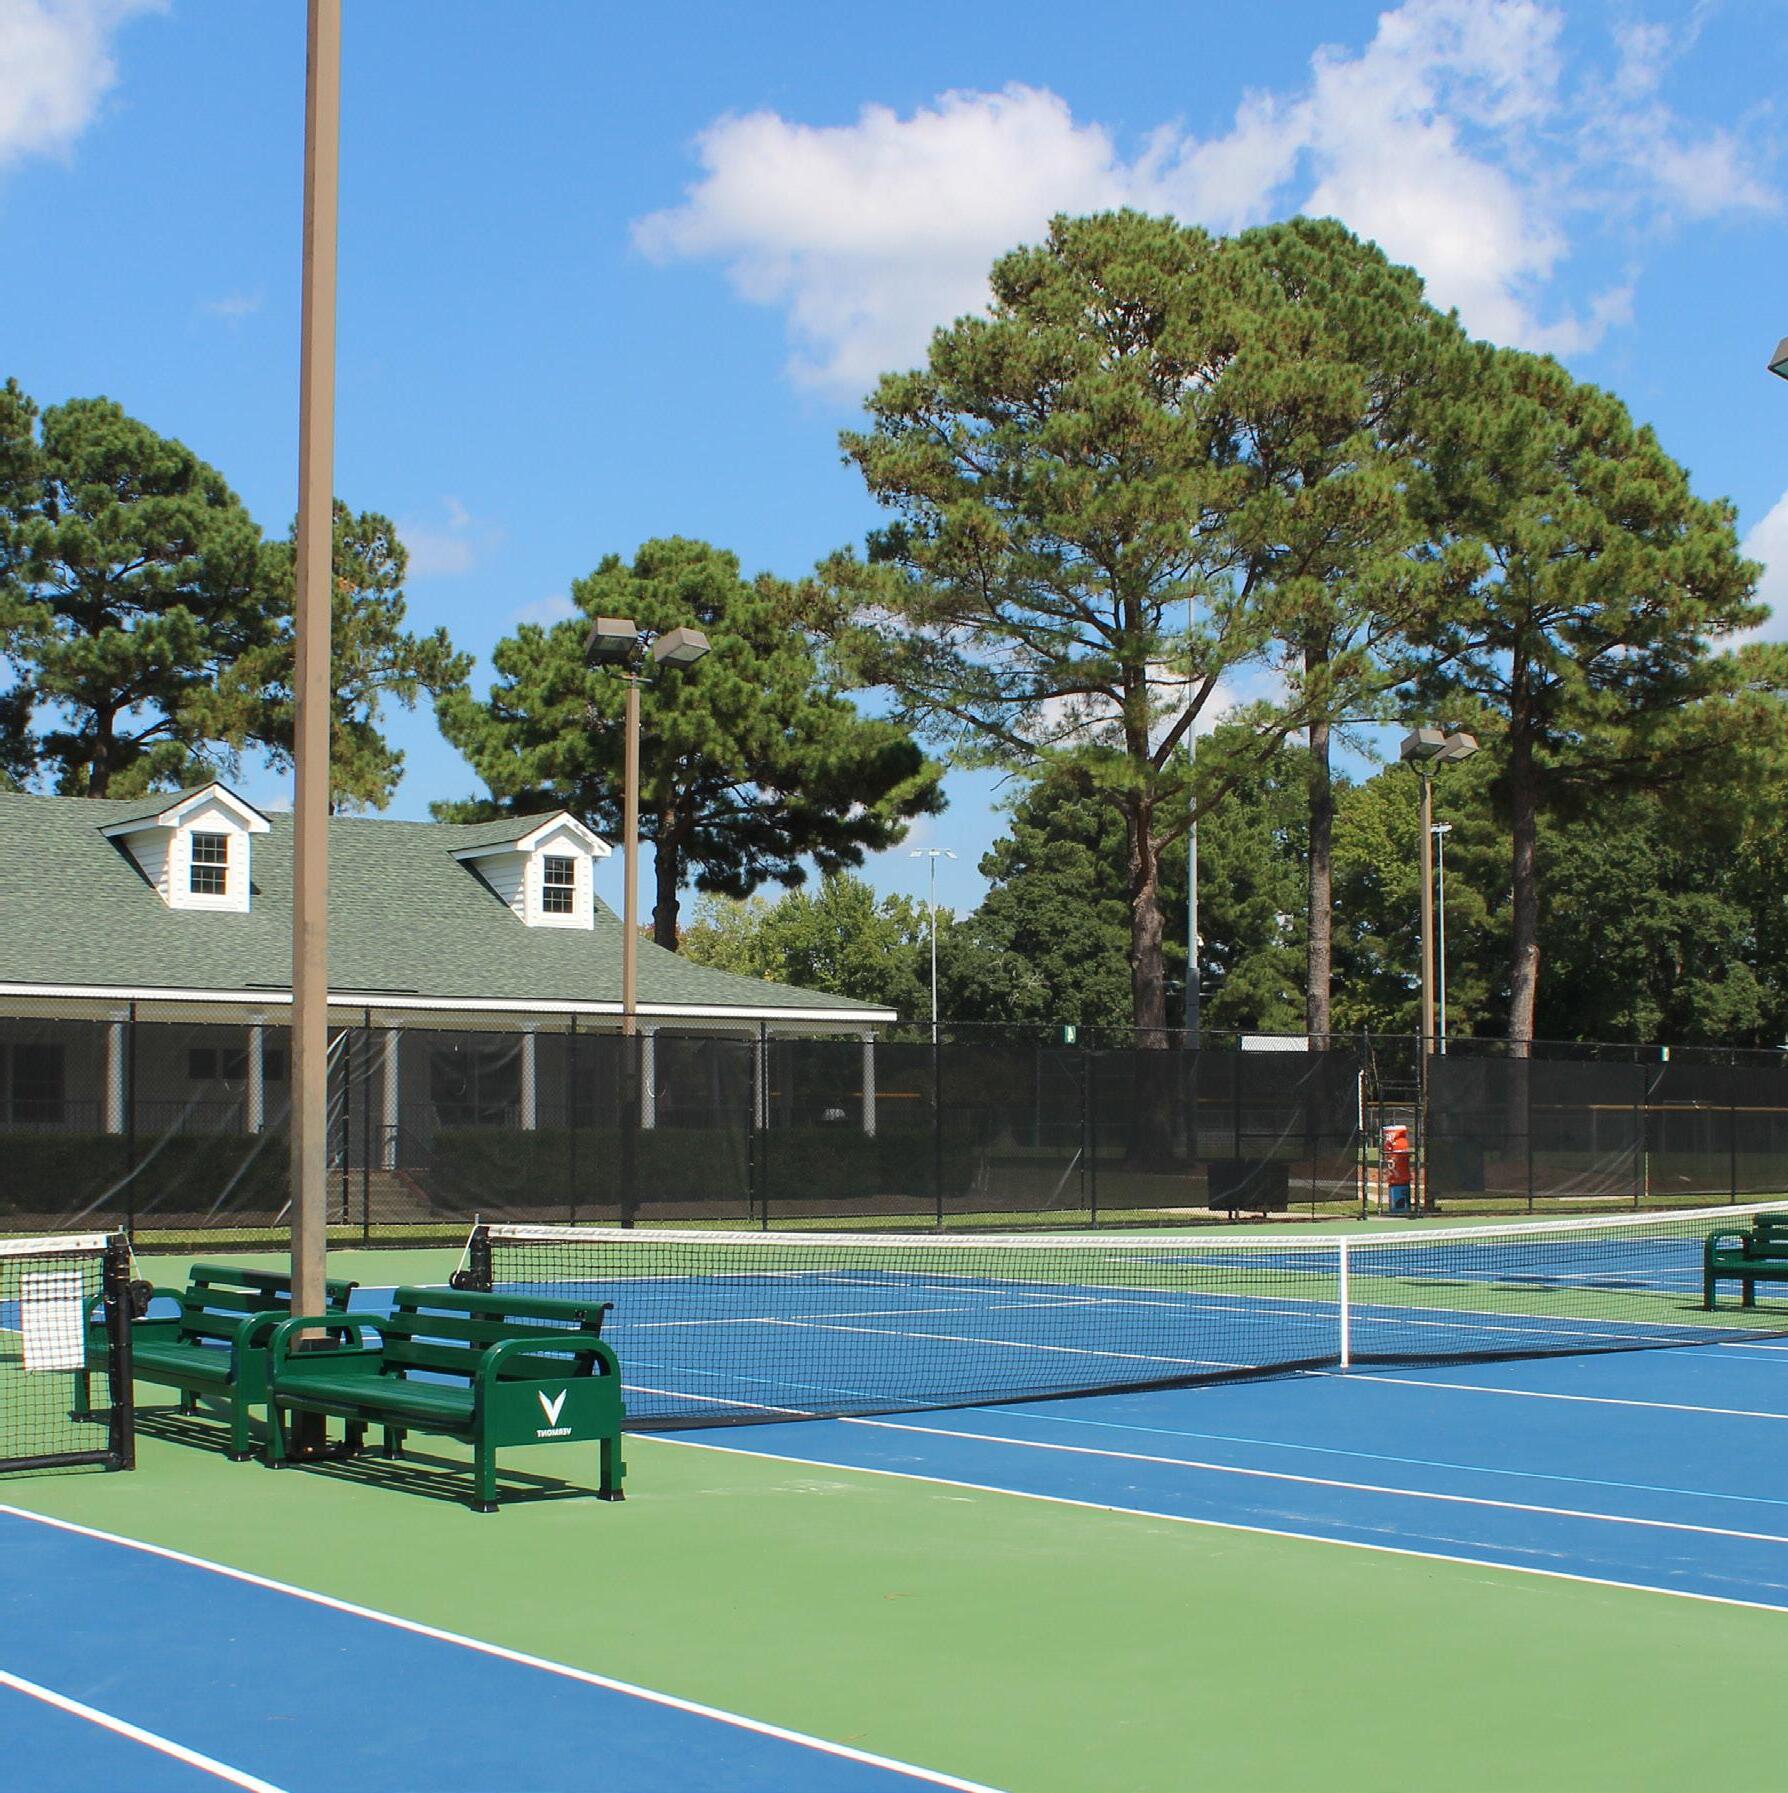


City of Greenville

Recreation and Parks Master Plan
Vision and Implementation Workshop
Workshop Dates: January 11, 2023 11 am-2:30 pm
Attendees:
See Sign-In Sheet Consultant Staff: KH: Nick Kuhn, Matt Gross, Halley Bartlett Ballard*King: Darin Barr
A Vision and Implementation Workshop was held with City staff at the Jaycee Park Facility on January 11, 2023. The workshop included a presentation and two interactive exercises to collect Staff input. The presentation included an outline of guiding documents, demographic trends, park evaluations, level of service, inventory of available programs, and the initial statistical survey results. Following the presentation, attendees were divided into groups of 5-8 people to participate in two exercises.
Exercise 1: SWOT The first activity was to identify Strengths, Weaknesses, Opportunities, and Threats (SWOT) of the existing City of Greenville Parks System over the course of 40 minutes.
Exercise 2: Goals and Objectives For each identified Sub-System, Participants were prompted to define 1-2 long-term goals and for each goal define 1-2 objectives or measurements such as projects, potential partners, and/or changes.
The following notes document the written input of participants participating in exercises. Written words that were emphasized (underlined, circled, or with an explanation point) have also been emphasized within the format of these notes.
GROUP 1
Exercise 1: SWOT
Strengths
Variety of Programs


Green Spaces
Knowledge and passion of staff
User friendly prices (city residents)
Activating Wildwood Park
Diversity of programs
Expansion of outreach and events
Community partnerships
Weaknesses
Budget and staffing levels
Facility space (indoor)
Outdoor lighting
Dedicated space (SPOP [special populations] & seniors)
Marketing
Outdoor restrooms (port-a-johns & stalls)
Parking
Website design (navigation)
Opportunities
Marketing
Outdoor pickleball courts
Community Input
Greenway/Trail Expansion (Connectivity)
Community partnerships (to grow) ex. Garden
Community outreach
Staff trainings & development
Entertainment venue
Threats
Staff transitions (changes/retirement)
Inflation
Environmental threats (floods)
Pandemic
Budget restrictions
Quality of part-time staff
Hiring process (length)
Exercise 2: Goals and Objectives
Waterfront, Natural, & Passive Parks
Goal: Increase Access
Building amenities
Acquiring land
Improve boat ramp at Town Common
Community/Neighborhood/Pocket Parks
Goal: Identify where new parks are needed
Work with private developers who are developing new areas/neighborhoods

Look at current locations of parks and distances between
Athletics Facilities (indoor/outdoor)
Goal: Increase usable space
Add lights
Artificial turf fields
Greenways/Trails
Goal: Expand and improve access
Connect current greenways and trails

Connect to parks
Increase programming
Activate County Plan in City Limits
Programs
Goal: Develop department cost recovery model
Standardize pricing in all departments
Benchmark with like-sized communities
Goal: Improve marketing
Implement marketing strategies
Streamline a process
Strengths
Amazing staff
Maintained well
Events
Programs
Unique: River Park North, Town Common, Wildwood
Accessibility to water
Playgrounds
Shelters
Some restroom facilities
Pocket parks serve communities, accessibility, street parking
Signage
Locations of pocket parks
Soccer, baseball, football, softball, volleyball, pickleball
Pool location
Drop-in factor
Well maintained length of greenways
Number of miles of greenway
Greenway access points
Greenway access to other amenities/parks
Year-round programs
Program diversity
Indoor/outdoor programs
Cost variance of programs
Inclusive programs
Weaknesses
Location of programs
Attendance/Staff – Volunteer and funding


Program marketing
Greenway connection to places
Lighting
Greenway flooding
Parking
Security camera
Lacking funds - other funding sources
Restrooms
Staff
Instructions
Outdated equipment
Building upgrades
Opportunities
Programs at areas without facilities to serve all of Greenville
Walking trails – connectors
Provide more services
Transportation
More partnerships/collaborations
Events to showcase property
Marketing
Threats
Competitions – private/communities/public
Staff turnover
EPA regulations
Lacking funding/strategies
Access to parks by walking
Needs of customers changing – age groups
Childcare
Part-time staff funding and limited hours
Full time staff – no overtime, cannot double-dip
Waterfront, Natural, & Passive Parks
Goal: Better utilize the waterfront
Improve access to the water
Provide program
Partnerships with other organizations

Foster tourism
Community/Neighborhood/Pocket Parks
Goal: Increase network accessibility
Add parking
Add pathways
Change ordinance and development requirements
Athletics Facilities (indoor/outdoor)
Goal: Enhance participants’ experience
Add lighting to fields
Improve outdated equipment
Staffing
Greenways/Trails
Goal: City-wide greenway system

Increase connection
Town Common Park to River Park North
South Greenville Phase 2 and Connection to Wildwood
East Side Park to greenway system
More access points
Parking
Reduce the need to drive
Funding Programs
Goal: Increase hours of operations and new programs
Funding/budget
Increase staff
Variety of programs to meet demographics


GROUP 3
Exercise 1: SWOT
Strengths
Maintain parks and facilities well
Great leadership
Work well together; great teamwork
Air condition facilities
Greenway access
Community partnerships
Little Leagues, LLSWS, Babe Ruth, Rotary Club
Growing special events
Inclusive programs
Inclusive staff
Weaknesses
Pool access
Water access
Outdoor courts: pickleball, basketball
River access
Facilities north of the river
Lack of neighborhood parks
Lack of lighted outdoor fields
Maintenance staff for facilities and parks
Security lights on greenway
GAFC parking
Paved parking lots
More Park Rangers
Lack of part-time staff
Funding for capital projects

Bureaucratic processes
Opportunities
North of the river population
Neighborhood parks citywide
South Tar River Greenway connectivity
Outreach programs
Entertainment venues/parking/outdoor
Girls/women focused programming
Baseball tournaments at Thomas Foreman Park
Upgrade older facilities
Build storage spaces
Threats
Government/environment policies
Bureaucratic processes
Funding for staff and capital projects
Staff turnover
Market saturation
Changing demographics
Lack of staff
Private sector parity
Volatility of the economy
Losing institutional knowledge
Exercise 2: Goals and Objectives
Waterfront, Natural, & Passive Parks
Goal: Connecting Greenway Trails

Funding with grants and partnerships
Prioritizing
Community/Neighborhood/Pocket Parks
Goal: Parks distributed throughout city
Inclusive park in each new neighborhood
Goal: Increase safe access to parks
Include sidewalks and restrooms
Athletics Facilities (indoor/outdoor)
Goal: More outdoor lighted fields; multipurpose fields
Grants, funding
Goal: Sports Complex
Grants funding, location
Greenways/Trails
Goal: See waterfront/natural/passive parks
Goal: Expansion and connection of trails
Add walking trails to parks
Prioritize
Funding Programs
Goal: Better marketing
Reach diverse population
Media advertising
Goal: Increase instructor pay


Funding
Goal: Increase programming space
More fields
Funding
Gyms
GROUP 4
Exercise 1: SWOT
Strengths
Staff
Diverse programs
River access
Accessibility
Youth programs
Efficient park maintenance
Big Events ex. LLSWS
Town Common
Community Partnerships
Weaknesses
More permanent pickleball courts
Outdoor lights
Sense of safety – blue light
Geographical location of parks
Marketing strategy
Rectrac – Website
Financial Support
Lack of facilities
Opportunities
Creation of neighborhood parks
Language: cultural barriers
Transportation and access to parks
Drop-in recreation other than basketball
Camps and programs for teenagers
STEM Center
Museums
New events at Wildwood
Ticketed concerts
Park conversions to different uses
Tap into ECU student programs
Threats
Economy, money, staffing

Private sector competitors
Weather
Busy schedules
Cultural and generational shifts
Exercise 2: Goals and Objectives
Waterfront, Natural, & Passive Parks
Goal: Improve access to river
Provide more opportunities for fishing and boating
More nature trails
Annual City trail budget
Community/Neighborhood/Pocket Parks
Goal: Adding neighborhood parks in areas with no parks
Mobile wellness and recreation
Development ordinance amendment
Diverse parks in neighborhoods
Assessment of needs of neighborhoods
Athletics Facilities (indoor/outdoor)
Goal: More pickleball courts
Converting courts 1-3 at Elm Street Park
Goal: Indoor/Outdoor Facility improvements
Field improvements
Lighting addition and enhancements
Renovations of batting cages at Sports Connection
Greenways/Trails
Goal: Enhanced Trail Access

Construct parking lots at Evans Street access
Extend greenways to H. Boyd Lee Park

Goal: Greenway Amenities
Addition of water fountains/bicycle repair stations
Addition of Emergency blue call boxes
Programs
Goal: Bilingual programming
Marketing Materials
Goal: More drop-in / open-play programs
Develop appropriate fee schedule

The summaries below consolidate themes recorded during the January Vision and Implementation Workshop with City staff.
Exercise 1 summarizes the top five (5) topics documented through participant notes. The Exercise 2 summary includes a list of the top fifteen (15) goals identified by participants. Each list is in descending order by frequency of mention in participant developed notes.
Strengths
Diversity, and accessibility of available programs and events
Recreation and Parks Staff
Community engagement and partnerships
Greenway network

Large Parks: Wildwood, River Park North, Town Commons
Weaknesses
Marketing of Programs/Website

Funding to support staff and facilities
Lighting of facilities to extend hours
Security and safety within parks: Park Rangers, Blue Lights, Greenway lighting
Parking at existing facilities
Opportunities
Programming in response to community input and demographics (STEM, Teen Center, Museums, Gardening)
Ticketed Events/Entertainment Venue
Distribution and number of Neighborhood Parks
Community Partnerships (Bi-lingual programs, ECU)
Expansion of walking networks and greenway system connectivity
Threats
Staff: number of part-time staff, turn over, retirement
Economic and Budgetary limits
Cultural and demographic changes
Competition from private entities and other community programs
Flooding and environmental regulation
1. Identify funding and grants to support maintenance and improvement of all facilities. (8)

2. Increase hours and accessibility to existing parks by expanding parking and field lighting. (7)
3. Develop ordinance and development requirements to establish new neighborhood parks. (6)
4. Complete a city-wide greenway and natural trail network connecting park facilities. (5)
5. Adapt facilities, programming, and community partnerships to accommodate changing demographics and recreational interests. (5)
6. Update existing facilities and equipment. (5)
7. Grow and maintain a complete team of full and part time staff. (4)
8. Increase access to and programing with the waterfront (3)
9. Develop marketing strategies to share program and facility information (2)
10. Develop a standardized cost determination for programs (2)

Q

Q 4 W hich of t he f ollowing best describes you? (check all t hat apply)

Q 4 W hich of t he f ollowing best describes you? (check all
hat apply)
Q 5 Count ing yourself , how many people in your household are. . .
Q 6 Are any members of your household disabled as a consequence of animpairment t hat may be physical, cognit ive, ment al, sensory, emot ional, development al, or some combinat ion of t hese?
Q 6 Are any members of your household disabled as a consequence of animpairment t hat may be physical, cognit ive, ment al, sensory, emot ional, development al, or some combinat ion of t hese?
Q 7 W hich Cit y Council Dist rict do you live in? (Ref erence map below as needed)
Q 7 W hich Cit y Council Dist rict do you live in? (Ref erence map below as needed)
Q 8 How would you rat e t he overall qualit y of G reenville parks and recreat ion amenit ies you have visit ed in t he last 12 mont hs?
Q 8 How would you rat e t he overall qualit y of G reenville parks and recreat ion amenit ies you have visit ed in t he last 12 mont hs?

Q 9 Do you visit parks or part icipat e in recreat ion programs of f ered by providers ot her t han t he Cit y of G reenville?
Q 9 Do you visit parks or part icipat e in recreat ion programs of f ered by providers ot her t han t he Cit y of G reenville?
Q 10 Have you or ot her members of your household part icipat ed in any programs (sport s, recreat ion, et c. ) or event s of f ered by t he Cit y of G reenville during t he last 12 mont hs?
Q 10 Have you or ot her members of your household part icipat ed in any programs (sport s, recreat ion, et c. ) or event s of f ered by t he Cit y of G reenville during t he last 12 mont hs?
Q 11 Approximat ely how many dif f erent recreat ion programs or event s of f ered by t he Cit y of G reenville have you or members of your household part icipat ed in over t he past 12 mont hs?
Q 11 Approximat ely how many dif f erent recreat ion programs or event s of f ered by t he Cit y of G reenville have you or members of your household part icipat ed in over t he past 12 mont hs?

Q 12 W hat days and t imes do you most f requent ly part icipat e in programs or visit parks?
Q 12 W hat days and t imes do you most f requent ly part icipat e in programs or visit parks?

Q 13 O verall, how would you rat e t he qualit y of t he program(s) or event (s) t hat you and/ or members of your household part icipat ed in over t he last 12
hs?
Q 13 O verall, how would you rat e t he qualit y of t he program(s) or event (s) t hat you and/ or members of your household part icipat ed in over t he last 12 mont hs?
Q 14 Rat e your level of sat isf act ion wit h t he f ollowing program services provided by t he Cit y of G reenville Recreat ion and Parks Depart ment .

Q 14 Rat e your level of sat isf act ion wit h t he f ollowing program services provided by t he Cit y of G reenville Recreat ion and Parks Depart ment
t r at io n Avail abil it y o f info r mat i
Qu al it y o f cu s t o mer
walking dist ance?'
Q 16 Do you f eel t here are suf f icient parks and green space areas wit hin walking dist ance of your residence?
Q 16 Do you f eel t here are suf f icient parks and green space areas wit hin walking dist ance of your residence?
14 Rat e your level of sat isf act ion wit h t he f ollowing program services provided by t he Cit y of G reenville Recreat ion and Parks Depart ment
Q 17 Select ALL t he reasons t hat prevent you or ot her members of your household f rom visit ing parks or part icipat ing in recreat ion programs and event s in t he Cit y of G reenville more of t en.

Par ks / facil it ie s t o o far fr
L ack o f r es t r o o ms
L ack o f s idew al ks o r L ack o f t r ail acces s
r it y is
cient
I do no t kno w w hat is o ffer ed
o gr am o r facil it y no t
ack o f acces s ibil it
e pr ivat e o r o t her
L ack o f t r ans po r t at i Spaces no t co mfo r t abl e
I do no t kno w l o cat io ns o f
Par ks / facil it ie s ar e no t w e
Par ks / facil it ie s ar e t o o
Par k o per at ing ho u r s no t
Phys ical heal t h
F ees ar e t o o high
Po o r cu s t o mer s er vice by
I do not k now loc at
P ark s / f ac ilit ies are not well maint ained
P ark s / f ac ilit ies are t oo c rowded
P ark operat ing hours not c onv enient
P hy s ic al healt h limit at ions
Fees are t oo high
t hink people s hould be c ons iderat e of t heir dogs and t hat s ome people are not c omf ort able wit h t hem when t ry ing t o walk in t he park
lov e Wildwood but one of t he walk ing areas has been ov ergrown and is n t pas s able 11/
rogram t imes aren t alway s c onv enient wit h work s c hedule
No s hade
7 Not many programs of f ered at loc at ion c los es t t o me
B et t er rat es f or non-prof it or programs t hat work wit h t he y out h
9 I do not liv e in Greenv ille
10 For t he av erage pers on it would be nc redibly s c ary t o t ry t o get t o Wildwood or Riv er P ark nort h by bik e! I t s s ad t hat people hav e t o driv e t o rec reat e I wis h people c ould be les s c ardependent I t would be f abulous t o hav e bridges ov er t he Tar c onnec t ing t he t hree park s s o t hat people c ould walk or bik e bet ween t hem (or at leas t bik e lanes ins t alled on t he roads t hat ead t o t hem)
P oor c us t omer s erv ic e by s t af f City of Greenville Rec reation and Parks M aster Plan Community Survey

11 My part ner work s long hours and c annot go t o park s wit h me in t he ev enings when I go t here
wa k wit h f riends
12 We are in need of a lac ros s e s pac e and t urf f ields
13 P rogram f ills up bef ore I c an s ign up
14 Don t liv e c los e enough
15 Lac ros s e is way in t he bac k of f ields at B radf ord
16 P oor qualit y of rent al k ay ak s and pedal boat s are alway s bloc k ing t he ramp at Town Common, t hat might not be Cit y of Greenv ille-run but s inc e t hey c amp out t here i t mak es it s eem t hat way
17 No res pec t f or lac ros s e We need our own f ields wit h light s
18 There is no s pec f ic s pac e f or lac ros s e and t h s is a f as t growing s port nat ionally and Greenv ille s hould bet t er s upport t his growt h
19 P ers onal t ime c ons t raint s
20 The areas t hat of f er t he s port s are ov er c rowded and under managed Limbs and v in es are ov er grown and need t o be c leared Up t o 8-12f t
21 The c los es t park s t o me hav e eit her v ery s hort limit ed t rail ac c es s or t he t rail s eems t o c ont inue t o et ern t y A nic e 2-3 mi loop would be c ool
Q 18 I ndicat e if you or members of your household have a need f or t he f ollowing recreat ion FACI LI T Y and how much of your need is current ly being met eit her by t he Cit y of G reenville or ot her recreat ion and park providers.
Q 18 I ndicat e if you or members of your household have a need f or t he f ollowing recreat ion FACI LI T Y and how much of your need is current ly being met eit her by t he Cit y of G reenville or ot her recreat ion and park providers.

l
u r t s
Skat e par ks

P ic nic areas / s helt ers
Golf c ours e(s )
Dis c golf c ours e(s )
Canoe/ K ay ak launc hes
A dult bas eball and s of t ball f ields
# OTHE R (P LE AS E S P E CI FY )
1 No light ing at park s t his t ime of y ear
2 I wis h t he greenway ex t ended t o t he Riv er Hills neighborhood; I would bik e t o t he Univ ers
work
3 Need more hik ing only t rails t hat are longer dis t anc e - 4+ miles
4 Of f leas h dog park is of t en dirt y wit h unat t ended or aggres s iv e dogs I do not f eel s af e bringing my dogs here
I ndoor P ools
6 S pray park s are in a rough part of t he neighborhood
would lov e t o s ee MORE greenway t rails
idew al ks R es t r o o ms
8 Greenway s t hat link more neighborhoods t oget her, as well as leading t o E CU and downt own Greenv ille
9 Greenv ille needs a mult i purpos e t urf at hlet ic f ac ilit y
as h pad(s )/s pr ay
10 indoor s oc c er f ac ilit y
11 We really need a t urf lac ros s e f ield
mmu nit y gar dens
12 LA CROS S E FI E LD! ! !
13 We need lac ros s e f ields and/ or mult ipurpos e f ields inc luding t urf t o grow t he s port of lac ros s e
ail s / M u l t i-u s e pat hs
14 Des perat e need f or a lac ros s e f iels
15 Lac ros s e and f oot ball need major improv ement
16 Lac ros s e f ields ! ! ! P leas e! ! ! !
17 Lac ros s e f ields
king/r u nning t r ack(s ) Ou t do o r s o cial gat her ing
18 The lac ros s e program is growing leaps and bounds and t here is a t remendous need f or more f ield av ailabilit y wit h light s and a need f or an indoor f ac ilit y f or t urf s port s (ie lac ros s e, s oc c er et c )
ar ger co mmu nit y par ks
19 The lac ros s e s pac e is t ec hnic ally s oc c er s pac e
o r co u r t s (bas ket bal l ,
20 What golf c ours es
21 Need more wat er f ount ains Maint enanc e on t he dis c golf c ours es are s ub par V ines and limbs hav e ov ergrown and s pac es are c rowded
mmu nit y cent er s / R ecr Bas ket bal l co u r t s Pickl ebal l co u r t s
Skat e par ks
Q 18 I ndicat e if you or members of your household have a need f or t he f ollowing recreat ion FACI LI T Y and how much of your need is current ly being met eit her by t he Cit y of G reenville or ot her recreat ion and park providers.

Q 19 W hich T HREE recreat ion f acilit ies list ed are most import ant t o you or members of your household?
pads / Spr ay Co mmu nit y
19 W hich T HREE recreat ion f acilit ies list ed are most import ant t o you or members of your household?
Q 21 W hich T HREE act ivit ies list ed are most import ant t o you or members of your household?
Q 21 W hich T HREE act ivit ies list ed are most import ant t o you or members of your household?

h s po r t s (s o ccer, t ee
Per fo r ming ar
of Greenville

Q 20 I ndicat e if you or members of your household have a need f or t he f ollowing ACT I VI T I ES and how much of your need is current ly being met eit her by t he Cit y of G reenville or ot her recreat ion and parks providers.
Q 20 I ndicat e if you or members of your household have a need f or t he f ollowing ACT I VI T I ES and how much of your need is current ly being met eit her by t he Cit y of G reenville or ot her recreat ion and parks providers.
Per fo r ming ar t s (dancin eSpo r t s (video games )
Aer o bics /s pinni ng
Us ing Wi-F i
V is u al ar t s (paint ing, Teen (6t h1 2t h gr ade)
Adu l t s po r t s
F it nes s and w el l nes s
So cial iz ing
R acqu et s po r t s (t ennis , Co mpu t er edu cat io n
V o l u nt eer

S pec ial populat ions (inc lus iv e programming)
S pec ial ev ent s and f es t iv als
B oat ing/ k ay ak ing
Yout h (K -5t h grade) ac t iv it ies
Yout h c amps
Yout h s port s (s oc c er, t ee ball, et c )
FY )
1 This c it y lac k s bik e t rails You c an t get t o downt own f rom out ly ing neighborhoods wit hout ris k ing y our lif e I t s erious ly lowers t he qualit y of lif e in Greenv ille
3 B ik e ac c es s and riding t rails
4 I t would be helpf ul t o hav e more s mall rec reat ional f ac ilit ies , c los er t o neighborhoods , t hat of f er indoor ac t iv it ies f or a f ee, s uc h as y oga, pilat es , or aerobic s / danc e c las s es
5 I wis h t here were ac t iv it ies f or ov erweight adult s only s o t hey don't f eel int emidat ed but f it t er people
6 Need more A dult art s and c raf t s c las s or ev ent s
Q 20 I ndicat e if you or members of your household have a need f or t he f ollowing ACT I VI T I ES and how much of your need is current ly being met eit her by t he Cit y of G reenville or ot her recreat ion and parks providers.
City of Greenville Rec reation and Parks M aster Plan Community Survey
Q 22 T he f ollowing are act ions t hat t he Cit y of G reenville could t ake t o improve t he Recreat ion and Parks syst em. I ndicat e your level of support f or each act ion.
City of Greenville Rec reation and Parks M aster Plan Community Survey

p new t r ail s and
o p mo r e r es t r o o ms
aint ain exis t ing s po
edevel o p/ Impr o ve exis t ing
r chas e l and fo r o pen s pa
Pu r chas e l and fo r o pen s pa
r chas e l and and devel o p
Pu r chas e l and and devel o p
r chas e l and and devel o p
chas e l and fo r o pen s pa
Pu r chas e l and and devel o p
o p mo r e at hl et ic fie
r chas e l and and devel o p
Devel o p mo r e at hl et ic fie
edevel o p/ Impr o ve exis t ing
r chas e l and and devel o p
R edevel o p/ Impr o ve exis t ing
Devel o p indo o r aqu at ics
o p mo r e at hl et ic fie
Devel o p indo o r aqu at ics
Devel o p indo o r s paces and
edevel o p/ Impr o ve exis t ing
Devel o p indo o r s paces and
Devel o p indo o r aqu at ics
Devel o p mo r e do g par ks
Devel o p mo r e do g par ks
Devel o p indo o r s paces and Devel o p mo r e do g par ks
Q 22 T he f ollowing are act ions t hat t he Cit y of G reenville could t ake t o improve t he Recreat ion and Parks syst em. I ndicat e your level of support f or each act ion.
Q 22 T he f ollowing are act ions t hat t he Cit y of G reenville could t ake t o improve t he Recreat ion and Parks syst em. I ndicat e your level of support f or each act ion.
P urc has e land and dev elop more neighborhood park s Dev elop more at hlet ic f ields and s port c ourt s

Redev elop/ I mprov e ex is t ing at hlet ic f ields and s port s c ourt s
Dev elop indoor aquat ic s f ac ilit y
Dev elop indoor s pac es and c ourt s
Dev elop more dog park s
# OTHE R (P LE AS E S P E CI FY )
1 One c los er t o c ent er of t own where people liv e
2 P leas e put in bik e t rails and c onnec t t he greenway t o out ly ing neighborhoods I
bik e t o work
4 P leas e enf orc e owners pic k ing up af t er t heir pet s if more dog park s are dev eloped
5 B uild a t urf at hlet ic c omplex wit h light s
6 We need t urf s oc c er and lac ros s e f ields ! ! ! ! ! !
7 Us e what we already own ( eas t s ide propert y )
8 Lac ros s e f ields and f oot ball t urf
9 Lac ros s e f ields ! P leas e!
ing w at
R edevel o p/ Impr o ve exis t ing
Pu r chas e l and fo r o pen s pa
Pu r chas e l and and devel o p
Pu r chas e l and and devel o p
Devel o p mo r e at hl et ic fie
R edevel o p/ Impr o ve exis t ing
Devel o p indo o r aqu at ics
Devel o p indo o r s paces and
Devel o p mo r e do g par ks
of Greenville Rec reation and Parks M aster Plan Community Survey
Q 22 T he f ollowing are act ions t hat t he Cit y of G reenville could t ake t o improve t he Recreat ion and Parks syst em. I ndicat e your level of support f or each act ion.
and Parks M aster Plan Community Survey
Q 23 W hich T HREE act ions would you be most willing t o f und wit h your t ax dollars?

Q 23 W hich T HREE act ions would you be most willing t o f und wit h your t ax dollars?
Devel o
Devel o p new t r ail s and M aint ain exis t ing par ks Pu r chas e l and and devel o p Pu r chas e l and and devel o p
o p mo r e at hl et ic fie
r chas e l and fo r o pen s pa M aint ain exis t ing
edevel o p/ Impr o ve exis t ing
s paces and
edevel o p/ Impr o ve exis t ing
edevel o p/ Impr o ve exis t ing Devel o p indo o r aqu at ic
o p indo o r s paces and
edevel o p/ Impr o ve exis t ing
o p mo r e do g par ks M aint ain exis t ing w at
do no t s u ppo r t any
Devel o p mo r e do g par ks
M aint ain exis t ing w at
I do no t s u ppo r t any
Q 24 A percent age of t he Cit y' s budget is used f or t he operat ions, maint enance, and improvement of parks, recreat ion f acilit ies/ programs, and t rails. T he qualit y of maint aining, operat ing, improving, and securing parks, recreat ion f acilit ies/ programs, and t rails is largely impact ed by t he amount of propert y t axes allocat ed f or t hese F rom t he f ollowing list , please check t he addit ional amount you would be willing t o pay in t axes t o f und t he act ions you indicat ed as most import ant t o your household in Q uest ion #23.
Q 24 A percent age of t he Cit y' s budget is used f or t he operat ions, maint enance, and improvement of parks, recreat ion f acilit ies/ programs, and t rails. T he qualit y of maint aining, operat ing, improving, and securing parks, recreat ion f acilit ies/ programs, and t rails is largely impact ed by t he amount of propert y t axes allocat ed f or t hese. F rom t he f ollowing list , please check t he addit ional amount you would be willing t o pay in t axes t o f und t he act ions you indicat ed as most import ant t o your household in Q uest ion #23
Q 25 F unding f or parks, recreat ion f acilit ies/ programs, school parks, and t rails may be secured f rom a variet y of sources. W hich t hree of t he f ollowing choices of f unding sources do you most pref er?
Q 25 F unding f or parks, recreat ion f acilit ies/ programs, school parks, and t rails may be secured f rom a variet y of sources. W hich t hree of t he f ollowing choices of f unding sources do you most pref er?
Q 25 F unding f or parks, recreat ion f acilit ies/ programs, school parks, and t rails may be secured f rom a variet y of sources. W hich t hree of t he f ollowing choices of f unding sources do you most pref er?

Q 26 F unding collect ed t hrough user f ees and charges helps t he Cit y t o provide high-qualit y programs and services t hrough lower propert y t axes. Please check t he addit ional amount in user f ees or charges you would be willing t o pay f or your f avorit e Recreat ion and Parks act ivit y or program which you or members of your household part icipat e (addit ional amount s are per event or program f or each person)


Q2. Which THREE of these parks and recreation amenities do you think should receive the MOST ATTENTION over the next TWO‐FOUR years?
Q3. Do you feel there are sufficient parks and green space areas within walking distance of your residence?

Q4. Have you or other members of your household participated in any programs (sports, recreation programs, etc.) offered by the City of Greenville during the past 12 months?
Q4a. How many different recreation programs have households participated in over the past 12 months?

Q4b. Overall, how would you rate the quality of the programs offered by the City of Greenville that you and members of your household participated in?


Parks/facilities too far from residence
Lack of sidewalk or bike lane access
Security is insufficient/loitering
Lack of restrooms
I do not know what is being offered
I do not know locations of parks/facilities
Program or facility not offered
Lack of interesting amenities or programs

I have physical health limitations
Lack of public transportation
Parks/facilities are too crowded
Parks or facilities are not well maintained
Fees are too high
Lack of accessibility parking
Use private or other community facilities
Park operating hours not convenient


a playground and an off‐leash dog park with signage and lighting; gravel parking, park signage, pedestrian and vehicle access into park; utilities; 15% A&E, permitting
2: Multipurpose field, walking paths, restroom, two (2) shelters w/ picnic tables, wayfinding, nature/discovery play feature; 15% A&E, permitting
3: Paved and unpaved trails; trailhead, kayak launch, parking; maintenance facility, 15% A&E, permitting
4: Disc golf, additional paved/unpaved trails, mountain biking trails, additional signage/wayfinding, 15% A&E, permitting
a nature themed play feature; gravel parking, park signage; utilities, two shelters, restrooms, unpaved hiking trails 15%


Adopted: May 8, 2023


