

market report Q1 + march 2023 | haden homes luxury property group / compass | montecito south SANTA BARBARA COUNTY Residential Real Estate Market Report March 2023 Q1 REPORT and

2 SOUTH SANTA BARBARA COUNTY MARKET REPORT | MARCH 2023 UPPER RIVIERA FROM CAMINO ALTO IN THE AMERICAN RIVIERA | LISTING BELOW March
plus
2023 FIRST QUARTER REPORT
Hello Family and Friends -
Despite nationwide residential real estate challenges, the Santa Barbara market seems to be operating without brakes! Real estate is hyper-local and demand to live in our beautiful community remains strong. We have many well qualified buyers actively looking to purchase so please reach out if you’re considering selling!
As we look back at the first quarter of 2023, it’s still very much all about the inventory. As you can see from the first two charts, the continued lack of available homes for sale (only 261 active listings YTD) is holding prices steady at a median sales price of $2,225,000 for a SFH in Q1 2023. If you are thinking of selling in the next 5 years, we feel this is an ideal time to take advantage of the high demand. Why not capitalize on your home’s equity with these historically high sold prices and a potential phenomenal return on your home’s investment. The limited inventory for buyers to choose from may make your property stand out!
We had 99 properties change hands during March, primarily due to the lack of available properties. Single family homes priced well are selling quickly with a cumulative days on market of 41 days and sold prices at 97% of the original list price. Now more than ever with the inventory shortage, we encourage active buyers to reach out for our list of Compass Private Exclusive properties which are off-market homes that we can share directly with our buyers. These property’s details are not disseminated widely and will not appear on public home search websites and are a great way to stay ahead of the market by eliminating competition. We currently have a home in a fantastic neighborhood of Montecito and an adorable cottage in Hope Ranch.
All Cash vs Loans | A total of 82 of the 241 sales during Q1 were “all cash” transactions (34%). Individuals who need a loan are having a more difficult time competing against the extensive number of cash buyers, reducing their chance to get an offer accepted. This makes it more important than ever to work with a well connected broker who can get your offer accepted despite the stiff competition—contact us for a strategy. Since interest rates have been on the rise, affordability has also impacted the amount a buyer can spend. We saw 28 homes close off market (12%) so stay in touch for the inside track.
Read on for the March and Q1 2023 Market Stats for South Santa Barbara County and then broken down by each city. Plus, check out some property ideas that are currently available that we feel are good values. As always—please reach out with any questions or to discuss your specific real estate goals!
In this highly competitive market—experience matters. We offer concierge level professional service to our clients with world-class marketing, a proven track record of success, the skills necessary to put complicated deals together and negotiate the price and terms that will get your offer accepted amongst multiple offers. Our goal is to get you the best price for your existing home and find you the right replacement property with minimal stress. Let’s explore your property’s current valuation and discuss a strategy.
Looking for professional + creative results-oriented representation - Let’s Talk!
3 Randy and Molly
Q1 TRENDS/HIGHLIGHTS
ONE | Demand continues — well qualified buyers are moving here at a pace we have not previously seen but we only have a limited amount of available homes for sale. With this historically low inventory, there were 41% fewer transactions in the Q1 of 2023 compared to Q1 2022.
TWO | If you are thinking of selling in the next 5 years, we feel this is an ideal time to take advantage of the high demand, Why not capitalize on your home equity with these historically high sold prices and a potential phenomenal return on your home investment. The limited inventory for buyers to choose from may make your property stand out!
THREE | Despite low inventory, prices remain steady. The median SFH sales price Q1 is at $2,225,000 overall, $5,675,000 in Montecito and $4,650,000 in Hope Ranch.
FIVE | Q1 “All Cash” transactions were 34% overall, 59% (29 total sales) in Montecito and 71% (7 total sales) in Hope Ranch. “Off Market” transactions were 14% overall, 17% in Montecito and 0% in Hope Ranch. In comparison, our previous Off Market “normal” was around ±4%.
Click For Featured Properties

4 SOUTH SANTA BARBARA COUNTY MARKET REPORT | MARCH 2023
- southSANTA BARBARA COUNTY
Q1 REPORT 2023 | In Review
Single Family Residences + Condominiums
-41% change over 2022
241
SINGLE FAMILY RESIDENCES
TOTAL YTD SALES
-40% change over 2022
168
AVERAGE SALES PRICE
-11% change over 2022
$3,208,492
MEDIAN SALES PRICE
-10% change over 2022
$2,000,000
CONDOMINIUM HOMES
TOTAL YTD SALES
-43% change over 2022
73
AVERAGE SALES PRICE 0% change over 2022
$1,192,247
MEDIAN SALES PRICE
+10% change over 2022
$900,000
5

6 SOUTH SANTA BARBARA COUNTY MARKET REPORT | MARCH 2023
BANDIT ENJOYING THE LAST OF THE SHOW IN THE WHITE MOUNTAINS | PINETOP AZ
- southSANTA BARBARA COUNTY
MARCH 2023 | In Review
Single Family Residences + Condominiums
-45% change over 2021 99
SINGLE FAMILY RESIDENCES
TOTAL SALES
-40% change over 2022
67
AVERAGE SALES PRICE
-18% increase over 2022
$3,248,239
MEDIAN SALES PRICE
-2% increase over 2022
$2,255,000
CONDOMINIUM HOMES
TOTAL SALES
-48% change over 2022
32
AVERAGE SALES PRICE
+20% change over 2022 $1,130,235
MEDIAN SALES PRICE
+13% change over 2022
$952,500
7

8 SOUTH SANTA BARBARA COUNTY MARKET REPORT | MARCH 2023 - southSANTA BARBARA COUNTY - homes | estates | puds (excludes condos)ACTIVE LISTINGS/INVENTORY YTD Through March | 2019-2023 348 261 471 514 624 Information Deemed Reliable But Not Guaranteed and Provided by Santa Barbara Association of Realtors THE CURRENT LIMITED INVENTORY

9 Information Deemed Reliable But Not Guaranteed and Provided by Fidelity National Title/Santa Barbara. - southSANTA BARBARA COUNTY - homes | estates | puds (excludes condos)SOLD PRICE/MEDIAN+AVERAGE Monthly Comparison $2,255,000 $3,248,239 $2,425,000High 13% MARCH OFF MARKET TRANSACTIONS 13 of the 99 Total Sales 42% MARCH ALL CASH TRANSACTIONS 39 of the 99 Total Sales INVENTORY IS KEEPING SOLD PRICES STEADY

10 SOUTH SANTA BARBARA COUNTY MARKET REPORT | MARCH 2023 - southSANTA BARBARA COUNTY - homes | estates | puds | condosQUARTERLY SALE VOLUME COMPARISON Information Deemed Reliable But Not Guaranteed / Provided by Fidelity National Title/Santa Barbara. 259 241 352 423 409
11 12% Q1 OFF MARKET TRANSACTIONS 28 of the 241 Total Sales - southSANTA BARBARA COUNTY - homes | estates | puds | condosQ1 CASH + OFF MARKET SALES 241 Total Sales | Jan Feb March Information Deemed Reliable But Not Guaranteed and Provided by Fidelity National Title/Santa Barbara. 34% Q1 ALL CASH TRANSACTIONS 82 of the 241 Total Sales
MONTECITO
Q1 REPORT 2023 | In Review
Single Family Residences + Condominiums (separated sales)
TOTAL YTD 2023 SALES
33
SINGLE FAMILY RESIDENCES
TOTAL YTD SALES
27 AVERAGE SALES PRICE
$6,618,933 MEDIAN SALES PRICE
$5,030,000
CONDOMINIUM HOMES
TOTAL YTD SALES
6 AVERAGE SALES PRICE
$2,449,500
MEDIAN SALES PRICE
$2,550,000
12 SOUTH SANTA BARBARA COUNTY MARKET REPORT | MARCH 2023
MONTECITO
MARCH 2023 | In Review
Single Family Residences + Condominiums (combined sales)
TOTAL MARCH SALES
17
AVERAGE SALES PRICE
-35% change from 2022
$5,249,941
MEDIAN SALES PRICE
-18% change from 2022 $4,300,000
HIGHEST SALES PRICE
377 Santa Rosa Lane Montecito CA 93108
$14,230,000
LOWEST SALES PRICE
1220 Coast Village Road, Unit 303 Montecito CA 93108
$1,345,000
Condominium Home
Click for Real Time Market Data
13
MONTECITO SALES | Q1 SALES
14 SOUTH SANTA BARBARA COUNTY MARKET REPORT | MARCH 2023
• DOM = Days on Market Address List Price Sold Price % to List DOM Month 308 Ennisbrook Drive Off Market $21,000,000 100% 1 January 618 Hot Springs Road Off Market $8,925,000 100% 1 January 1855 San Leandro Lane $6,800,000 $5,550,000 82% 81 January 472 Santa Rosa Lane $4,495,000 $5,000,000 111% 6 January 231 Butterfly Lane $4,800,000 $4,800,000 100% 1 January 674 Oak Grove Drive Off Market $3,300,000 100% 1 January 260 Cloydon Circle $2,695,000 $2,710,000 101% 5 January 2070 East Valley Road $2,650,000 $2,650,000 100% 1 January 438 Seaview Road $2,850,000 $2,450,000 86% 9 January 751 Buena Vista Drive $18,900,000 $17,500,000 93% 45 February 445 Pimiento Lane $6,395,000 $6,505,000 102% 3 February 160 Miramar Avenue $5,175,000 $4,823,000 93% 15 February 377 Santa Rosa Lane Off Market $14,230,000 100% 1 March 1027 Cima Linda Lane $12,500,000 $12,100,000 97% 317 March 1564 Ramona Lane $9,500,000 $8,752,000 92% 139 March 491 Pimiento Lane $9,450,000 $8,200,000 87% 127 March 206 Middle Road Off Market $5,650,000 100% 1 March 1530 Willina Lane $5,850,000 $5,100,000 87% 105 March 590 Freehaven Drive Off Market $5,100,000 100% 1 March 425 Nicholas Lane Off Market $5,100,000 100% 1 March 142 Coronada Circle Off Market $4,300,000 100% 1 March 302 Alston Road $4,495,000 $3,655,000 81% 137 March 130 Via Alicia $3,432,500 $3,432,500 100% 2 March 47 Seaview Drive $3,395,000 $3,395,000 100% 4 March 1524 East Valley Road Off Market $2,950,000 100% 1 March 118 Coronada Circle $2,495,000 $2,435,000 98% 158 March 544 San Ysidro Road B $2,195,000 $2,150,000 98% 29 March 1022 Fairway Road $1,550,000 $2,150,000 92% 18 March 1220 Coast Village Rd,#303 $1,495,000 $1,345,000 90% 70 March
17%

15 - homes | estates | puds | condos -
Information Deemed Reliable But Not Guaranteed / Provided by Fidelity National Title/Santa Barbara.
MONTECITO Q1 2023 SALES STATS
Q1
OFF
the 29
2023
MARKET TRANSACTIONS 5 of
Total Sales
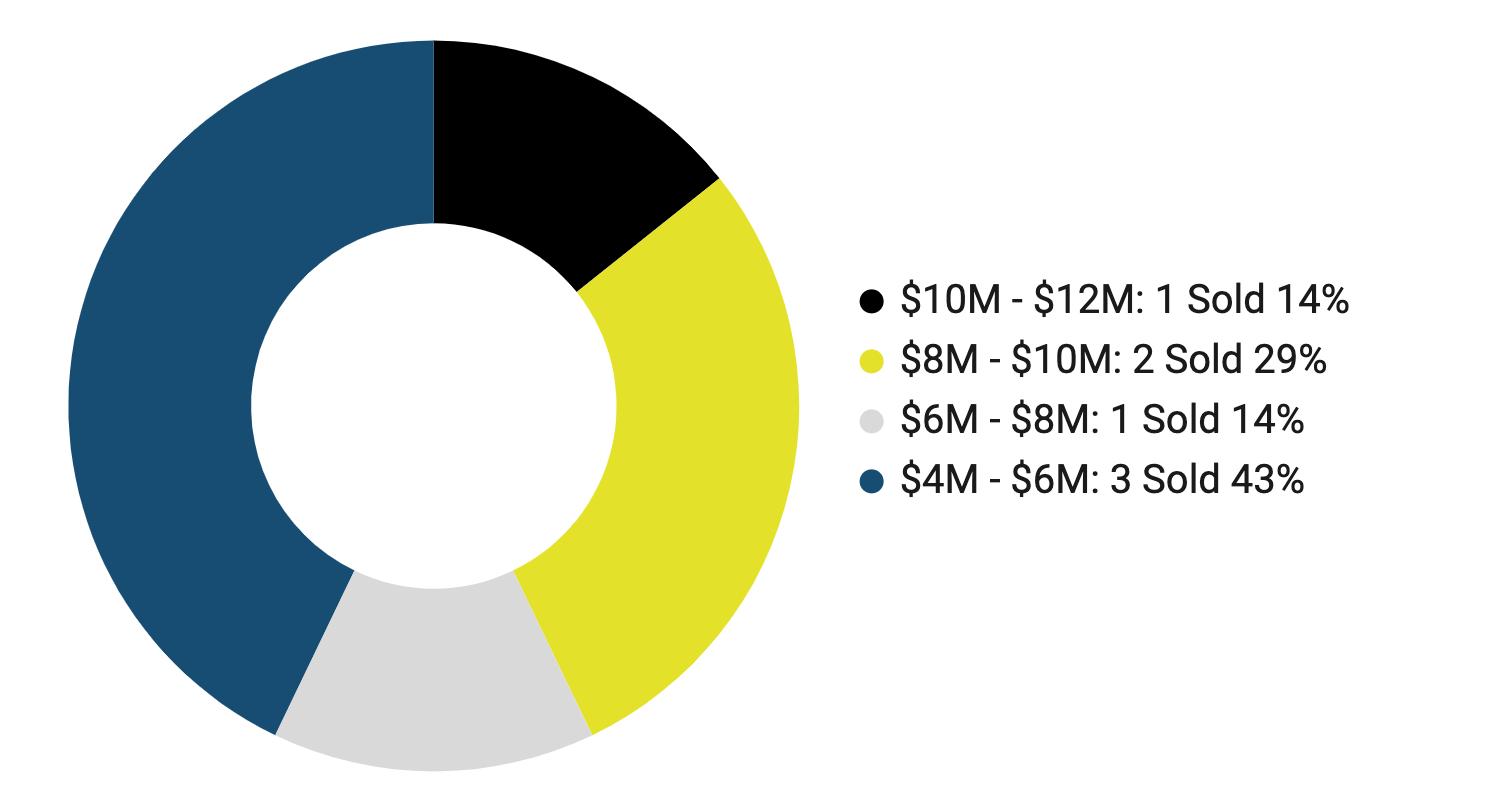
SALES DISTRIBUTED BY PRICE RANGE | Q1 2023 FIRST QUARTER SALES
Total Sales/In Millions
59% Q1 2023 ALL CASH TRANSACTIONS 17 of the 29 Total Sales
29
HOPE RANCH
Q1 REPORT 2023 | In Review
Single Family Residences + Condominiums (separated sales)
TOTAL YTD 2023 SALES
7
SINGLE FAMILY RESIDENCES
TOTAL YTD SALES
28 AVERAGE SALES PRICE
$6,792,857
MEDIAN SALES PRICE
$7,250,000
CONDOMINIUM HOMES
TOTAL YTD SALES n/a
AVERAGE SALES PRICE n/a
MEDIAN SALES PRICE n/a
16 SOUTH SANTA BARBARA COUNTY MARKET REPORT | MARCH 2023
HOPE RANCH
MARCH 2023 | In Review
Single Family Residences + Condominiums (combined sales)
TOTAL MARCH SALES
2
AVERAGE SALES PRICE
+14% change from 2022 $6,215,000
MEDIAN SALES PRICE
+14% change from 2022 $6,215,000
HIGHEST SALES PRICE
3923 Laguna Blanca Drive
Hope Ranch CA 93110
$8,700,000
LOWEST SALES PRICE
710 Monte Drive
Hope Ranch CA 93110
$3,730,000
Click for Real Time Market Data
17
HOPE RANCH SALES | Q1 2023
DOM = Days on Market

18 SOUTH
COUNTY MARKET REPORT | MARCH 2023
SANTA BARBARA
Address List Price Sold Price % to List DOM Month 4345 Via Glorieta $9,495,000 $8,150,000 86% 279 January 13 Via Airosa $3,995,000 $3,995,000 100% 62 January 4680 Via Roblada $11,250,000 $10,400,000 92% 76 February 4520 Via Esperanza $9,250,000 $7,250,000 78% 180 February 965 Via Fruteria $5,475,000 $5,325,000 97% 29 February 3923 Laguna Blanca Drive $9,200,000 $8,700,000 95% 0 March 710 Monte Drive $5,495,000 $3,730,000 66% 219 March LA CUMBRE COUNTRY CLUB | HOPE RANCH
•

19 - homes | estates | puds | condosHOPE
SALES
Information Deemed Reliable But Not Guaranteed / Provided by Fidelity National Title/Santa Barbara.
Q1 2023 OFF MARKET TRANSACTIONS 0 of the 7 Total Sales
Q1 2023 ALL CASH TRANSACTIONS
of the 7 Total Sales SALES DISTRIBUTED BY PRICE RANGE | Q1 2023 FIRST QUARTER SALES
Total Sales/In Millions
RANCH Q1 2023
STATS
0%
71%
5
7
20 SOUTH SANTA BARBARA COUNTY MARKET REPORT | MARCH 2023 SINGLE FAMILY RESIDENCES TOTAL YTD SALES 72 AVERAGE SALES PRICE $2,420,613 MEDIAN SALES PRICE $1,950,000 CONDOMINIUM HOMES TOTAL YTD SALES 31 AVERAGE SALES PRICE $1,329,904 MEDIAN SALES PRICE $1,302,250 Q1 REPORT 2023 | In Review Single Family Residences + Condominiums (separated sales)
YTD 2023 SALES 103
TOTAL
SANTA BARBARA
SANTA BARBARA
Single Family Residences + Condominiums (combined sales)
TOTAL MARCH SALES
39
AVERAGE SALES PRICE
-6% change from 2022 $2,184,308
MEDIAN SALES PRICE
0% change from 2022 $1,850,000
HIGHEST SALES PRICE
1650 Miramesa Drive Santa Barbara CA 93109
$5,350,000
LOWEST SALES PRICE
902 North Nopal Street Santa Barbara CA 93103
$700,000
Condominium Home
Click for Real Time Market Data
21
MARCH 2023 | IN REVIEW

22 SOUTH SANTA BARBARA COUNTY MARKET REPORT | MARCH 2023
Momentum on Sea Cliff | Plans for Lot Split | Existing Home 3 BD | 3 BA | 3045± SF | 1.46± AC Offered at $7,997,000
Offering
3139 SEA CLIFF | SANTA BARBARA CA 93109
Undeniable
Exclusive
by Randy Haden/Molly Haden

23 695 AVENIDA PEQUENA | SANTA BARBARA CA 93111 Cathedral Oaks Village | High End Finishes | Landscaped Patios 3 BD | 2.5 BA | 2029± SF | Condo/Townhome Offered at $1,997,000 Exclusive Offering by Randy Haden/Molly Haden
Q1 REPORT 2023 | In Review
Single Family Residences + Condominiums (separated sales)
TOTAL YTD 2023 SALES
4
SINGLE FAMILY RESIDENCES
TOTAL YTD SALES
4
AVERAGE SALES PRICE
$5,232,288
MEDIAN SALES PRICE
$3,939,575
CONDOMINIUM HOMES
TOTAL YTD SALES
0
AVERAGE SALES PRICE n/a
MEDIAN SALES PRICE n/a
24 SOUTH SANTA BARBARA COUNTY MARKET REPORT | MARCH 2023
SUMMERLAND
SUMMERLAND
MARCH 2023 | In Review
Single Family Residences + Condominiums (combined sales)
TOTAL MARCH SALES 1
AVERAGE SALES PRICE
+1.027% change from 2022 $11,550,000
MEDIAN SALES PRICE
+1.027% change from 2022 $11,550,000
HIGHEST SALES PRICE
2710 Montecito Ranch Place
Summerland, CA 93067
$11,550,000
LOWEST SALES PRICE
2710 Montecito Ranch Place
Summerland, CA 93067
$11,550,000
Click for Real Time Market Data
25
Single Family Residences + Condominiums (separated sales)
TOTAL YTD 2023 SALES
24
SINGLE FAMILY RESIDENCES
TOTAL YTD SALES
14 AVERAGE SALES PRICE
$3,661,667
MEDIAN SALES PRICE
$3,575,786
CONDOMINIUM HOMES
TOTAL YTD SALES
10 AVERAGE SALES PRICE
$722,000
MEDIAN SALES PRICE
$752,500
26 SOUTH SANTA BARBARA COUNTY MARKET REPORT | MARCH 2023
Q1 REPORT 2023 | In Review
CARPINTERIA
CARPINTERIA
MARCH 2023 | In Review
Single Family Residences + Condominiums (combined sales)
TOTAL MARCH SALES
10
AVERAGE SALES PRICE +86% change from 2022 $2,075,500
MEDIAN SALES PRICE
+3% change from 2022 $1,007,500
HIGHEST SALES PRICE
3281 Beach Club Road Carpinteria CA 93013
$8,650,000
LOWEST SALES PRICE
5970 Hickory Street, Unit 1 Carpinteria CA 93013
$410,000
Condominium Home
Click for Real Time Market Data
27
28 SOUTH SANTA BARBARA COUNTY MARKET REPORT | MARCH 2023 SINGLE FAMILY RESIDENCES TOTAL YTD SALES 44 AVERAGE SALES PRICE $1,533,574 MEDIAN SALES PRICE $1,549,500 CONDOMINIUM HOMES TOTAL YTD SALES 26 AVERAGE SALES PRICE $918,846 MEDIAN SALES PRICE $905,000 Q1 REPORT 2023 | In Review Single Family Residences + Condominiums (separated sales) TOTAL YTD 2023 SALES 70
GOLETA
GOLETA
MARCH 2023 | In Review
Single Family Residences + Condominiums (combined sales)
TOTAL MARCH SALES 30
AVERAGE SALES PRICE
+9% change from 2022 $1,378,667
MEDIAN SALES PRICE
+6% change from 2022 $1,312,500
HIGHEST SALES PRICE
4439 North Shadow Hills Boulevard Goleta CA 93105
$2,825,000
LOWEST SALES PRICE
5510 Armitos Avenue, Unit 19 Goleta CA 93117
$578,000
Condominium Home
Click for Real Time Market Data
29
DISCRETION
Privacy is the Ultimate Commodity
And the Decision to Sell Your Home Is a Personal One.
FLEXIBILITY
Decide When to Share Details About Your Home - Including PriceMore Expansively On Your Own Timing.
QUALITY
Exclusive Exposure To Compass Agents, Including Premium Placements On Agent Facing Platform.

VALUE
Get the Best Offer by Testing The Market
Privately to Gather Key Insights Without Your Listing Getting Stale or Overexposed.

30 SOUTH SANTA BARBARA COUNTY MARKET REPORT | MARCH 2023
COMPASS PRIVATE EXCLUSIVE LISTINGS

Ask Us About Our Exciting Private Exclusive Listings | Contact Us Live For details!
A Compass Private Exclusive listing is an off-market home that can be shared by a Compass agent directly with their colleagues and their buyers. Property details are not disseminated widely and won’t appear on public home search websites.
Listing your home as a private exclusive allows you to control what information is shared about you and your home while still getting exposure to top agents at Compass.


32 SOUTH SANTA BARBARA COUNTY MARKET REPORT | MARCH 2023 RANDY HADEN Broker Associate / Realtor DRE 01988499 805.880.6530 randy@hadenhomes.com LET’S CONNECT www.hadenhomes.com @hadenhomesrealtors 1% Top 1% of Agents CHOOSE experience MOLLY HADEN Realtor / Marketing Director DRE 02020380 805.880.6540 molly@hadenhomes.com
CONCIERGE Real Estate Service


EXPERT PERSPECTIVE
Now more than ever you need an expert advisor on your side who can provide comprehensive analysis and exclusive insights into today’s fast-paced housing market. We see every luxury property available and know the market. Our commitment to staying educated on what’s happening with economic news, the real estate market, local sales and listings is essential to your success when buying or selling properties.
CONCIERGE SERVICE
We strive to deliver a high level of personalized service—personally! We provide our clients with cutting-edge strategies that produce ideal results. Our exceptional service is driven by efficient communication, understanding your needs and having expansive industry resources— combined with expert knowledge of the extensive contracts and required forms to protect your best interests. The process comes together as a result of our years of successful negotiating which leads to a winning deal. We listen carefully, anticipate your needs, execute the deal and handle all the details. The hard work starts when a contract is in place so you will be happy you chose representation experienced in closing the deal smoothly.
COMMUNITY INVESTMENT
Sell a Home | Build a Home initiative. We are deeply connected and committed to the communities in which we live and work. Haden Homes Luxury Property Group has made a pledge to help individuals with housing needs by partnering with Habitat for Humanity. For every home that our clients buy or sell, Haden Homes makes a donation to Santa Barbara’s Habitat for Humanity.

33

U.S. Home Prices Fell 3% in March, the Largest Annual Drop in More Than a Decade THE TALK IS MARKET SHIFTS + INTEREST RATES - click link for full articleIf You Can Pay All Cash for a Home, Should You? CAR March 2023 Home Sales and Price Report Just For Fun! Inside America’s Most Expensive Trailer Park - Where Mobile Homes Sell for Millions Compass Expands to Arizona with Launch Real Estate
CHICAGO TITLE
FIDELITY NATIONAL TITLE SANTA BARBARA MLS
DATA SOURCES | LISTING DISCLOSURE


All information provided is deemed reliable but has not been verified and we do not guarantee it. We recommend that buyers make their own inquiries. Data source Fidelity National Title, Chicago Title and Santa Barbara MLS. INdata Real Estate Market Reporting through March 2023.
Properties featured are courtesy of the Santa Barbara MLS and are available for sale at time of publication. They may be listed by brokers and/or agents other than Compass or Haden Homes Group. Contact us for details or to set up a private showing at 805.880.6530.
35


