ARCH 7530 - Building Performance Simulation Hardi Shah


ARCH 7530 - Building Performance Simulation Hardi Shah


tmy3 file chosen
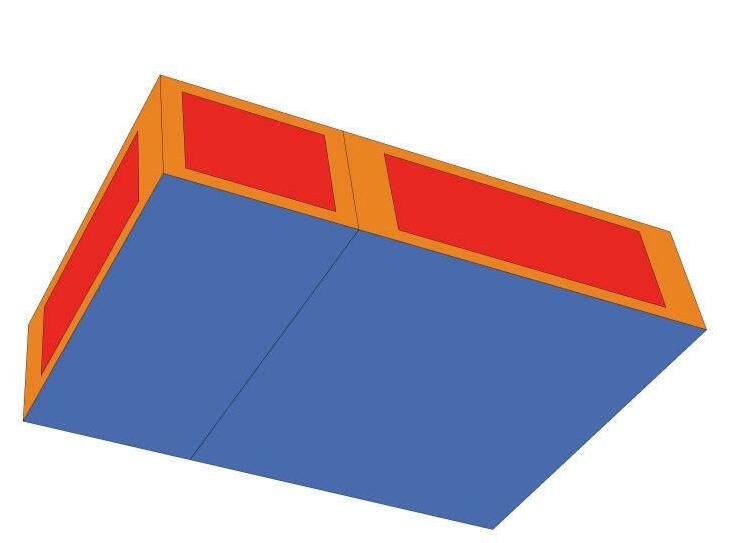
This project iteratively improves conditions within a unit on the 6th floor of a midrise apartment building in Augusta, Maine. The fabric of Augusta is largely low and mid rise buildings so the site was designed to reflect that. I placed an open garden on the south side of the building and oriented so the south has no solar obstruction.
introduced ‘capture internal heat’ as a passive strategy: brought 30% more hours into comfort
REVOLVING AROUND
HEATING LOAD

Assignment_FINAL PROJECT: Evidence-based Analysis
WALL: Wood Framed - R20
floor: Carpeted 8in Slab Floor-R5 [m2K/W]
WINDOW U-value: 0.30 [W/m2K] Window SHGC: 0.40 [dimensionless]


sensors in
window to wall ratios: wwr NORTH: 0 wwr EAST: 0.5 wwr south: 0.6 wwr west: 0.5

ARCH 7530 - Building Performance Simulation Hardi Shah
the thermal comfort in the office here needs to be addressed.
total energy use intensity: 224.87 kWh/m2 heating eui: 131.61 kWh/m2 cooling eui: 23.37 kWh/m2 lighting eui: 10.05 kWh/m2 elec equip eui: 33.67 kWh/m2
WE Want to bring this udi to above 50 as it is a workspace. as expected the heating eui is the highest and will be the main focus to reduce and create thermal comfort.
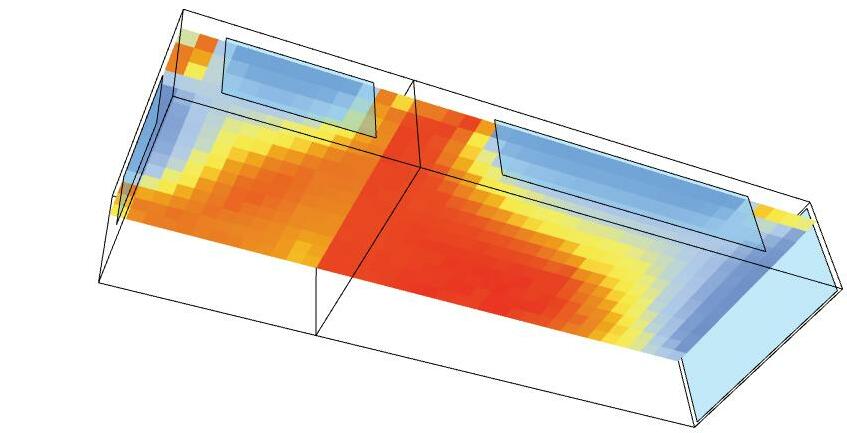
mean radiant temp: bedroom: 23.17c office: 21.58c
avg daylight autonomy is high overall. it is a more appropriate unit to measure daylight in the bedroom.

% of time comfortable: bedroom: 32.76% office: 22.93%


Point in time analysis shows percentage of useful illuminance at each sensor and shows the range of illuminances at its peaks and valleys but it does not reflect the overall annual conditions completely. It lets us see the general seasonal pattern shifts to make decisions.


THE WINDOW WALL RATIO COULD BE MANIPULATED TO GET MORE ROUNDED ILLUMINANCE VALUES THROUGH THE YEAR.


Assignment_FINAL PROJECT: Evidence-based Analysis

BUILDING LENGTH: 15M, 20M, 25M 81 iterations
EAST WWR: 0.3, 0.4, 0.5
SOUTH WWR: 0.4, 0.6, 0.8
U-VALUE: 0.32, 0.64, 0.96
inputs
ARCH 7530 - Building Performance Simulation Hardi Shah
The iterations were set up in two steps: the first would address the balance between daylight and thermal comfort while the second step would focus on reducing overall EUI.
UNDERSTAND RELATIONSHIP
BETWEEN ADEQUATE DAYLIGHT (LENGTH & WWR) AND THERMAL COMFORT (U-VALUE)


This is a filtering method to select an option while prioritizing Avg UDI.


I prioritized choosing the highest Avg UDI of the office first because there was a wide range of AvgUDIs and the space should at least have 50% to make sure that it can function well as a workspace. Then I began to look into comfort and then the energy use intensity.
this option has the highest avg udi for the office: 53.74 and is relatively high in comfort and low in eui. the east and south wwr are smaller than i expected while the west wwr is very high at 0.9.


This is a filtering method to select an option while prioritizing overall % comfort.


I prioritized choosing the highest comfort in this filtering process and then choosing the highest corresponding daylight values from there. This resulted in a different final iteration than in the previous method.

this option has the highest % comfort for the office while also having a high % comfort in the bedroom. the avg udi is also still the highest in the range.

Assignment_FINAL PROJECT: Evidence-based Analysis
BUILDING LENGTH: 15M, 20M 18 iterations
ARCH 7530 - Building Performance Simulation Hardi Shah
The iterations were set up in two steps: the first would address the balance between daylight and thermal comfort while the second step would focus on reducing overall EUI.
construction type: masonry, wood, steel-framed inputs
r-VALUE: r-13, r-17, r-21


by avg udiby % comfort i assumed the wwr that were the best performing per iteration 1. now testing the two building lengths that we concluded, with the other parameters for a focus on energy and comfort.
the best u-value and wwrs are the same in both iterations so that was established as the new baseline.
Wood-framed
Steel-framed
Wood-framed
Steel-framed
HIGH OFFICE % COMFORT --> HIGH BEDROOM % COMFORT --> HIGH OFFICE AVG UDI
I prioritized choosing the highest comfort in this filtering process and then choosing the highest corresponding daylight values from there. The resulting total and heating EUI were second lowest in the options while still providing higher thermal comfort. We have two resulting options.

Wood-framed
We have two resulting options from these iterations that give us similar output metrics.


Steel-framed
Wood-framed
Steel-framed
masonry steel framed
in these two options, the metrics are quite similar. the avg udi’s are over 50% and the % overall comfort is also the same. The only input that varies is the construction. I chose the mass construction because the daylight metrics for the office were better than the steel framed.


bedroom pmv comfort is retained at 100% office pmv comfort is increased significantly from 48.7%

bedroom pmv comfort is increased by 4.56% from 50.23. office pmv comfort is increased by 21.19% significantly from 32.87%
daylight autonomy remained in the range of 90-98% throughout the project. so it was not considered too heavily.

total energy use intensity: 294.3 kWh/m2
heating eui: 185.17 kWh/m2 cooling eui: 39.24 kWh/m2 lighting eui: 10.05 kWh/m2

elec equip eui: 33.67 kWh/m2
the heating eui is still high. if i could adjust the infiltration rate, it would bring this eui down.
mean radiant temp: bedroom: 23.17c office: 21.58c
% of time comfortable: bedroom: 25.46% office: 20.33%
% of time cold: bedroom: 55.31% office: 61.12%
the office loads are minimal compared to the bedroom. the solar gain in the winter is helping negate the need for excessive heating.
total energy use intensity: 294.3 kWh/m2
heating eui: 185.17 kWh/m2
cooling eui: 39.24 kWh/m2 lighting eui: 10.05 kWh/m2

elec equip eui: 33.67 kWh/m2
the solar gain during the summer is counter intuitive, natural ventilation during the summers might rid the need for cooling.
in the bedroom especially, the infiltration is high, resulting in higher heating loads. if i could change the infiltration rate, it would be beneficial for the space.
the heating eui is still high. if i could adjust the infiltration rate, it would bring this eui down.
mean radiant temp: bedroom: 23.17c office: 21.58c
% of time comfortable: bedroom: 25.46% office: 20.33%
% of time cold: bedroom: 55.31% office: 61.12%
overall the loads have decreased especially the heating loads. the solar loads here in the summer time might be mitigated if we incorporated natural ventilation.

total energy use intensity: 211.17 kWh/m2 (-83.13) heating eui: 101.33 kWh/m2 (-83.16) cooling eui: 39.94 kWh/m2 lighting eui: 10.05 kWh/m2 elec equip eui: 33.67 kWh/m2
this shows that the heating load is the most significant portion of the eui.
mean radiant temp: bedroom: 23.26c (+0.08) office: 22.41c (+0.83)
% of time comfortable: bedroom: 30.73% (+5.27) office: 24.05% (+3.62)
% of time cold: bedroom: 48.94% (-7.83%) office: 51.96% (-10%)