
16 minute read
What’s More in Tracing with LTTng


Developers Let's Try
What’s More in Tracing with LTTng
Advertisement
The next big step is to trace userspace applications and understand how to view the overwhelming trace information easily using some GUI tools. Read on to dive deeper into tracing.
In the article that appeared in the March 2014 issue of OSFY, I introduced tracing and, more specifically, LTTng. I included a small section towards the end in which you could generate a small kernel trace. Now, it's time to have a look at more advanced use cases. In this article, I will introduce LTTng for tracing applications in userspace. Eventually, we'll discuss how to use the power of the Eclipse Tracing and Monitoring Framework (TMF) and other tools to gather information from combined userspace and kernel traces, using a real life example.
Userspace tracing with LTTng
If you remember, we enabled tracepoint in the kernel the last time, and gathered data and information about this. What if you wanted to trace specific ‘points’ in your application at the userspace level, at the same blazingly fast speed! As an example, consider that you want to know how much time a handle_newconnect() call takes in your Web server and how it interacts with the system. Or maybe you wish to know why the APT (package manager for Debian/Ubuntu) takes so much time installing your package? (Hint: It blocks for about 37 per cent of total elapsed time. But why, and where?)
Before we find the answers to all those questions, let us look at the thttpd Web server. Let us first make it ready for LTTng/ UST-the userspace tracing library of LTTng. The first step is inserting a tracepoint function call in a specific function in the thttpd source. This is known as instrumenting the application. For that we need something called the tracepoint provider.
Let’s start by adding the tracepoint call in our target function-handle_newconnect(). I have created my own repos of clean and instrumented versions with minor edits (which allow it to get compiled properly), but original versions can be found on http://www.acme.com (Jef Poskanzer).
wget http://step.polymtl.ca/~suchakra/osfy/thttpd-clean.tar.gz tar -xvf thttpd-clean.tar.gz && cd thttpd-clean
For instrumenting the function, there are three basic steps. These are given below.
Tracepoint declaration
First, prepare the tracepoint provider header: This provides a tracepoint declaration in which you can specify the tracepoint provider (TP) name, arguments, payload variable types, fields and expressions. Refer to the lttng-ust man page for detailed field types that you can use. Some examples are ctf_integer, ctf_float and ctf_string. The TRACEPOINT_ EVENT macro sets everything up for you once you specify the arguments. We can create this header for our tracepoint and name it as thttpd_tp_provider.h
/* * thttpd_tp_provider.h */
#undef TRACEPOINT_PROVIDER #define TRACEPOINT_PROVIDER thttpd
#undef TRACEPOINT_INCLUDE_FILE #define TRACEPOINT_INCLUDE_FILE ./thttpd_tp_provider.h
#ifdef __cplusplus #extern "C"{ #endif /*__cplusplus */
#if !defined(_THTTPD_PROVIDER_H) || defined(TRACEPOINT_HEADER_ MULTI_READ) #define _THTTPD_PROVIDER_H #include <lttng/tracepoint.h> TRACEPOINT_EVENT( thttpd, /* tracepoint provider name */ count, /* tracepoint name */ TP_ARGS(int, var), TP_FIELDS( ctf_integer(int, count, var))
) #endif /* _THTTPD_PROVIDER_H */
#include <lttng/tracepoint-event.h>
#ifdef __cplusplus } #endif /*__cplusplus */
We also need to create a C file in which TRACEPOINT_CREATE_PROBES is defined. This will get the trace probes ready.
/* * thttpd_tp.c */ #define TRACEPOINT_CREATE_PROBES #include "thttpd_tp_provider.h"
Tracepoint call
The next step is to add the tracepoint to the target function. Insert the following lines in thttpd.c above the main():
#define TRACEPOINT_DEFINE #include "thttpd_tp_provider.h"
Insert the tracepoint functions inside the handle_ newconnect() body. I choose to put it in such a way as to keep track of the http_conn_count while I trace.
handle_newconnect(struct timeval *tvP, int listen_fd) {
} c->hc->initialized = 0; ++httpd_conn_count;
/* tracepoint with a payload as the connection count
tracepoint(thttpd, count, httpd_conn_count);
} /* Get the connection. */ switch (httpd_get_conn(hs, listen_fd, c->hc)) {
Building it all
Once this is done, add the thttpd_tp.c file to the SRC variable in Makefile.in, and add lttng-ust library and libdl to the linking process while building the source.
export LDFLAGS="-ldl -llttng-ust" ./configure make
Now you have completed the instrumentation phase of the application. Whenever this instrumented thttpd starts, it will
register itself to lttng-sessiond so that traces can be seamlessly written to the tracebuffer.
To make thttpd run, we will need a config file (which thttpd does not provide by default). Here is config from the official thttpd Fedora package:
# Save this as thttpd.conf dir=/var/www/thttpd chroot user=thttpd # default = nobody logfile=/var/log/thttpd.log pidfile=/var/run/thttpd.pid
I have prepared a version of thttpd for you that contains the above instrumentation as well as the thttpd.conf. You will need the conf file to start thttpd successfully in the next section. Get it from http://step.polymtl.ca/~suchakra/osfy/ thttpd-instrumented.tar.gz
Start tracing
So now you are all set! Let's start our usual tracing routine. It's similar to kernel tracing.
$ lttng create osfy-thttpd $ lttng enable-event -a -u # enable all userspace events $ lttng start $ sudo ./thttpd -C ./thttpd.conf # start instrumented thttpd
Now you can start loading your server-maybe by just opening a browser, pointing to http://localhost and simulating a load on the server by Apache Bench. I just tried connections from my browser for now.
$ lttng stop $ lttng view
Trace directory: /home/suchakra/lttng-traces/osfythttpd-20140120-172551
[17:26:24.474009892] (+?.?????????) isengard.localdomain thttpd:count: { cpu_id = 2 }, { count = 1 } [17:26:24.474044119] (+0.000034227) isengard.localdomain thttpd:count: { cpu_id = 2 }, { count = 2 } [17:26:38.936110649] (+14.462066530) isengard.localdomain thttpd:count: { cpu_id = 3 }, { count = 3 } [17:26:38.936246752] (+0.000136103) isengard.localdomain thttpd:count: { cpu_id = 3 }, { count = 4 } [17
You can observe that the five events were recorded and the connection count (our payload) is increasing. The delta time shows how much I waited between the requests and how many total requests I made while tracing. It’s now time to finally end this tracing session.
$ lttng destroy
You can also record kernel as well as userspace traces at the same time for a more comprehensive view of the complete system with thttpd. Just enable the kernel and userspace events before starting a trace:
$ lttng enable-event -a -k $ lttng enable-event -a -u
You can also add more information to the events or the trace channels by using contexts. For example, if you wish to add a Perf ‘cache misses’ counter value to all events recorded in the trace, you can use add-context before starting a trace:
$ lttng add context -k -t perf:cache-misses
There are many other cool things that you can do, such as filtering the traces, etc. Just browse through the man pages for lttng and lttng-ust to get more ideas.
Trace viewing and analysis
As I mentioned the last time, we can use various tools other than the command line based babeltrace to help us view and analyse Common Trace Format (CTF) traces. There are a couple of graphical tools available, but I will only cover the most comprehensive one-TMF. In order to maintain the continuity of our thttpd experiment, let's trace it again while enabling the userspace events (-a -u options, as mentioned above) in addition to kernel events. Run the trace for some time while making some HTTP requests and generate the traces. I have already generated some traces if you need those. Get them from http://step.polymtl.ca/~suchakra/osfy/ osfy-thttpd-20140127-194024.tar.gz. We will need it later.
Setting up TMF
There are two ways to use TMF. One is the standalone Rich Client Platform (RCP) version. You can grab the latest Trace Viewer RCP from http://secretaire.dorsal.polymtl. ca/~alexmont/tracing-rcp/ . Otherwise, if you are a regular Eclipse user and prefer to install TMF as an Eclipse plugin, download the latest version of the Eclipse IDE for C/C++ developers, which already includes Linux Tools and the LTTng plugins. On other versions, you can add the plugin using the ‘Help→Install New Software...' option. TMF is under the‘Linux Tools' section of the main Eclipse repository.
Now you are all set and ready to roll! I will be using the Eclipse plugin to explain how to use TMF. The RCP version is no different as it is the plugin; it’s just without the whole Eclipse framework.
Loading your first CTF trace
Fire up Eclipse and switch the perspective to ‘LTTng Kernel’. By default, you will see some views. The important ones for now are Control Flow, Resource, Statistics Histogram and the Project Explorer. You can always add views using ‘Window →Show View→Other'.
Let's load up the combined kernel and thttpd trace first. Right click on Project Explorer→New→Tracing Project. Give it a new project name (such as OSFYTraces). Once it's created, go to ‘Traces' under OSFYTraces tree→right click→‘Batch Import...' Check the ‘Common Trace Format' and in the next window, click on‘Add Directory' and browse to your trace directory. You can use the traces from osfythttpd-20140127-194024.tar.gz which you just downloaded or your own traces (created by default in /home/username/lttngtraces). Now select the desired traces the wizard has found for you. Under Generic CTF Trace, select ‘64-bit’ (that’s our UST trace) and under LTTng Kernel Trace, select ‘kernel’. Before importing them, you can rename them by clicking on their names. I renamed the ‘64-bit' trace to ‘ust’.
So two traces will appear under ‘Traces’ in the project explorer. Double click on the kernel trace and wait for it to load. You will observe the histogram and control flow view being populated. The kernel events will start showing up too. At this point, you have successfully loaded the kernel trace and are ready for analysis.
So let's first get familiar with the interface now. We will go through a small example to get familiar with the usage. On your right, you will see multiple ‘views’. In Figure 1, you can see the top section shows ‘Control Flow’, ‘Resources' and ‘Statistics’ views in the tabs. The second section shows the event views. As you open a trace named ‘kernel’, it will show all the kernel events recorded. There will be lots of events listed in it. Click on ‘<srch>’ under the ‘Event Type’ section and type sys_execve. Under ‘Content’, type ‘thttpd’. This will take you to an event that is an execv syscall and contains thttpd as the string in the trace content. Have a look at Figure 2(a).
You can also observe that in the Control Flow view, the corresponding process is highlighted and the graph on the right now points to the exact time of the recorded event. You can move around and see other events on the graph by just clicking on events. A mouse-over gives some more information. You can zoom using the mouse wheel or more
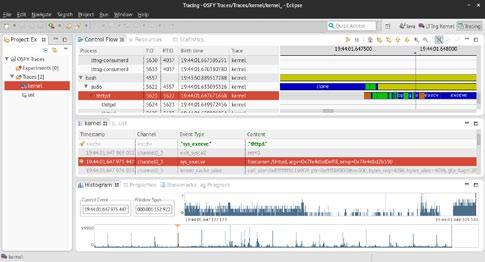
Figure 1: TMF ‘Tracing' perspective
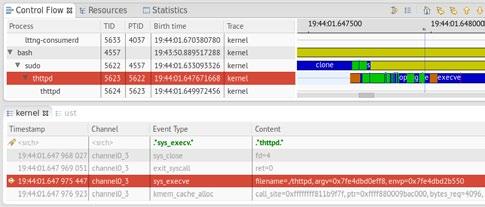
Figure 2(a): The sys_execve event in the kernel trace

Figure 2(b): Resources view showing the event on CPU3
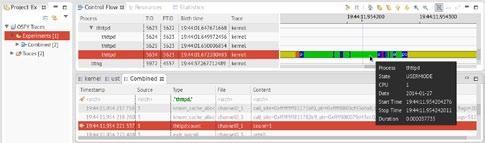
Figure 3: Trace experiment showing combined kernel and UST trace
fine grained timing on events. You can also move to the next events in the same selected process using the right and left arrow keys. Colours are the next important thing and you can click on the small ‘Legend’ icon to understand what they mean. Blue is a SYSCALL, green shows that process was in USERMODE, yellow is WAIT_BLOCKED and so on.

Figure 4: LTTngTop
The interface is quite intuitive, and the event and the control flow views are synchronised. Next, click on the‘Resources’ tab and you will see all the system resources and their consumption during the trace. See Figure 2(b). Of course, it's a lot better this way rather than looking at cpu_id each time in the babeltrace output. You can also have a look at the ‘Statistics' and ‘Histogram’ tab, which gives you a more comprehensive view of the system's functioning so that you can observe trends statistically too.
Now that you are familiar with the interface, do a small activity by which you try to see what happens in the system when the userspace tracepoint was hit and recorded the count data from handle_newconnect() in thttpd. You can create a trace experiment for this. Go to Project explorer→Right click Experiments→New (name it ‘Combined')→Select kernel and ust traces. Now double click on ‘Combined' and there you go. You have combined UST and kernel traces now. Interesting! Now you can know exactly how the system behaved while the userspace tracepoint was hit. Under the <srch> in Type, write ‘thttpd:count' and your first UST tracepoint that was hit shall be displayed. Above and below that, the system activity in kernel trace will be shown too. See Figure 3.
There are other CTF trace viewers out there too. Another graphical one is the Linux Trace Tookit Viewer (LTTV), which you can install by using the following command:
$ sudo yum install lttv
Being a precursor to TMF, it was one of the original graphical trace viewers and inspired a lot of techniques and methods that were used in TMF. LTTV is quite fast but may not be as versatile and comprehensive as TMF.
Looking ahead
LTTng 2.4 ‘Époque Opaque’ is around the corner (RC5 is available at the time of writing) and will have some new and awesome features: 1. Live trace viewing: Yes, you heard that right. You can now view and analyse your traces while they are being created. You can view the live streaming data on any remote machine too. There is another tool, LTTngTop (it's an ncurses-based top like viewer), for live as well as already recorded traces which you can use with this feature. See Figure 4 and check it out at http://git.lttng. org/?p=lttngtop.git. Live trace reading will soon come to
Eclipse TMF also (maybe not in the next release). This is a feature that sysadmins would really love! 2. Snapshots: Soon you will also be able to take a
‘snapshot’ of the trace buffers at a given time and observe the traced data. It's a pretty cool feature for scenarios in which you may want to trigger a snapshot record at some coredump, for example. Snapshot trace data can also be used with flight-recorder mode (the trace data snapshot gets overwritten in the buffer as in a flight recorder). Long term system monitoring is also a good use-case for snapshots.
The fancy control flow view is fine, but you may wonder what the actual path a process takes through the system during execution is. Can you show that? Indeed, it may soon be a reality. As for the question we discussed earlier about APT taking up your valuable time while installing packages, Critical Flow View answers that. Refer to this awesome post at http://multivax.blogspot.ca/2013/12/system-levelprofiling-of-apt.html.
I would also recommend that you check out Workload Kit (https://github.com/giraldeau/workload-kit). It is a way to quickly generate repeatable workloads for tracing on your machines. It contains lttng-simple, which is a command line tool to quickly start with LTTng on your system and do some experimentation.
This concludes the series on tracing using the LTTng tools. In case you have any questions, do contact me. Happy tracing!
References
[1] http://lttng.org/files/doc/man-pages/man3/lttng-ust.3.html [2] http://secretaire.dorsal.polymtl.ca/~alexmont/tracing-rcp/ [3] http://git.lttng.org/?p=lttngtop.git [4] http://multivax.blogspot.ca/2013/12/system-level-profiling-of-apt.html [5] https://github.com/giraldeau/workload-kit
Acknowledgements
Thanks to Geneviève Bastien and François Rajotte for reviewing this article and to all the LTTng developers for their contributions. The TMF dev team at Ericsson and Polytechnique Montréal deserve special kudos!
By: Suchakrapani Sharma
The author is a PhD student at École Polytechnique de Montréal. He is currently doing research on dynamic tracing tools. He has varied interests, from performance analysis tools to Embedded Linux and UX/graphics design. He can be contacted at suchakra@fedoraproject.org
Anil Seth
Erlang Webmachine
Our previous article in this series, ‘Exploring Software–Webservice using Mochiweb’, dealt with building a simple Web application. In this article, let us explore Erlang Webmachine.
In a Web application, the browser sends a request, and the server calls a function and returns a response. Each request is independent. This maps very well to the functional programming paradigm; hence, we continue our experiments with Erlang.
Webmachine is a REST toolkit in Erlang on top of Mochiweb. As an illustration, let’s start with the demo application included with Webmachine and add a form to it. The form will allow us to add a key/value pair or get all the key/value pairs that have some value.
Getting started
Let us use the packages included in the Fedora 20 repositories.
Make a copy of the demo in /usr/share/doc/erlangwebmachine/demo/. As the demo depends on an earlier version of Webmachine, some extra steps may be needed. In the demo directory, do the following:
$ rm rebar.config $ rebar compile Note: install additional modules in case of dependency issues $ ./start.sh
The application failed to start with messages, which include phrases like ‘not_started,ssl’. To overcome the errors, the start function in src/webmachine_demo.erl was modified as follows:
start() -> ensure_started(inets), ensure_started(crypto), ensure_started(syntax_tools), ensure_started(compiler), ensure_started(xmerl), ensure_started(asn1), ensure_started(public_key), ensure_started(ssl), ensure_started(mochiweb), application:set_env(webmachine, webmachine_logger_module, webmachine_logger), ensure_started(webmachine), application:start(webmachine_demo).
Now, the compilation and execution of start.sh should go through properly. Browse http://localhost:8000/demo and you should get a welcome message.
Adding functionality
The mapping between the URL paths and the modules is specified in file priv/dispatch.conf. Let us suppose the additional functionality is to be accessed from the URL path /key. Then the priv/dispatch.conf will become:
%%-*- mode: erlang -*{["demo", '*'], webmachine_demo_resource, []}. {["key", '*'], webmachine_key_resource, []}. {["fs", '*'], webmachine_demo_fs_resource, [{root, "/tmp/ fs"}]}.
The code needed for this functionality will be in src/ webmachine_key_resource.erl:
-module(webmachine_key_resource). -export([init/1, to_html/2]). -include_lib("webmachine/include/webmachine.hrl"). init([]) -> Context = undefined, {ok, Context }.
to_html(ReqData, Context) -> % if the key is not null, store the key/value pair in mnesia table case wrq:get_qs_value("key",ReqData) of Key when Key==undefined, Key=="" -> ok; Key -> db:insert_key(Key, wrq:get_qs_ value("value",ReqData)) end, % get all the key/value pairs which match the value in search_for {Result,SendList} = db:match_value(wrq:get_qs_ value("search_for",ReqData)), % return the result in webapp template
case Result of atomic -> {ok, Body} = webapp_dtl:render([{the_list, SendList}]); _ -> {ok, Body} = webapp_dtl:render([{the_list, []}]) end, % webmachine expects a tuple {Body, ReqData, Context}.
The resource module needs at least two functions by default—init and to_html. The init function is used to specify the context needed for this resource. Webmachine passes it, as is, to various functions.
The default name of the function for the GET request is to_html. In case the key field is empty or not defined, the function does nothing; otherwise, it inserts the key/value pair in a table. It then queries the table for all records that have the desired value and displays the result in a template.
The templates/webapp.dtl template is similar to the one explained in the previous article:
<html> <body> <form method="GET"> <p>Key: <input type="text" name="key"> Value: <input type="text" name="value"></p> <p> Search for Value" <input type="text" name="search_ for"></p> <input type="submit"> </form> {% for table,key,value in the_list %} <p> {{ key }} Value {{ value }} </p> {% endfor %} </body> </html>
For completeness, the code in src/db.erl for storing and querying data from mnesia is as follows:
-module(db). -export([init/0,insert_key/2,read_data/1,match_value/1]). -record(store,{key,value}). init() -> mnesia:create_table(store, [{attributes,record_info(fields, store)}]). insert_key(K,V) -> F=fun() -> mnesia:write(#store{key=K,value=V}) end, mnesia:transaction(F). match_value(Val) -> Pattern = #store{_ = '_', value=Val}, F = fun() -> mnesia:match_object(Pattern) end, mnesia:transaction(F).
Finally, mnesia needs to be started. Add the following lines at the beginning of the start function in src/webmachine_demo.erl:
application:set_env(mnesia,dir,”db”), mnesia:create_schema([node()]), ensure_started(mnesia), db:init(),
Compile and run start.sh. Now browse http:// localhost:8000/key and explore the form.
Getting used to Erlang is not difficult. Functional programming is fun.
References
[1] https://github.com/basho/webmachine/wiki [2] http://www.erlang.org/doc/apps/mnesia/Mnesia_chap2.html [3] http://en.wikiversity.org/wiki/Web_Development_with_
Webmachine_for_Erlang
By: Anil Seth
The author has earned the right to do what interests him. You can find him online at http://sethanil.com, http://sethanil. blogspot.com, and reach him via email at anil@sethanil.com
THE COMPLETE M AGAZINE ON OPEN SOURCE
Your favourite magazine on Open Source is now on the Web, too. LinuxForU.com
Follow us on Twitter@LinuxForYou