Hilton Head Island Visitor Profile Survey
2023
Mark Witte, Ph.D.

 Melinda Patience
PREPARED FOR: HILTON HEAD ISLAND-BLUFFTON CHAMBER OF COMMERCE
BY:
OFFICE OF TOURISM ANALYSIS SCHOOL OF BUSINESS COLLEGE OF CHARLESTON 66 GEORGE STREET | CHARLESTON, SC 29424 843.953.1996 | OTA.COFC.EDU | PATIENCEM@COFC.EDU
HILTON HEAD ISLAND VISITOR PROFILE SURVEY 2023
HILTON HEAD ISLAND VISITOR PROFILE SURVEY 2023 TABLE OF CONTENTS Executive Summary..........................................................................................................................................2 Methodology ...................................................................................................................................................6 Survey Findings................................................................................................................................................8 Sample Demographics ..................................................................................................................................8 Sample Point of Origin..................................................................................................................................9 Travel to the Hilton Head Island / Bluffton Area .......................................................................................... 11 Hilton Head Island Visitors.......................................................................................................................... 12 Travel Planning .......................................................................................................................................... 24 Non-Visitors............................................................................................................................................... 27 Travel Behavior – All Respondents .............................................................................................................. 29 Appendix ....................................................................................................................................................... 33 All ZIP Codes Collected by MSA ................................................................................................................... 33

HILTON HEAD ISLAND VISITOR PROFILE SURVEY 2023 1
EXECUTIVE SUMMARY
SAMPLE DEMOGRAPHICS
Millennials represented 61% of the respondents, followed by Gen X (17.7%), and then Baby Boomers (17.9%). Over 56% of those surveyed had a Bachelor’s degree or higher, and more than 57% had an annual household income of $100,000 or more per year. Also, nearly 90% of the respondents were married.
POINT OF ORIGIN
The respondents resided in 140 geographical areas / MSAs (Metropolitan Statistical Areas) throughout the U.S., stretching from east to west coast. More respondents resided in California than any other state (13.0%). Second was Texas (7.8%), followed then by Pennsylvania (7.1%), New York (6.5%), Ohio (5.5%), and Georgia (5.1%). In-state visitors did not make up a significantly large portion of the respondents (4.8%).
According to a market penetration analysis, the following MSAs were major markets amongst respondents: Los Angeles-Long Beach-Anaheim, CA; New York-Newark-Jersey City, NY-NJ; Atlanta-Sandy Springs-Roswell, GA; Philadelphia-Camden-Wilmington, PA-NJ-DE-MD; San Francisco-Oakland-Fremont, CA; Washington-Arlington-Alexandria, DC-VA-MD-WV; and Chicago-Naperville-Elgin, IL-IN.
Canada was the top international origin market amongst respondents (38.0%), followed by the Middle East (26.8%), and Europe (16.9%).
THOSE WHO TRAVELED TO HILTON HEAD ISLAND
The top three reasons for choosing Hilton Head Island as a destination continue to be visiting beaches (40.7%), relaxation (31.7%), and spending time with family (22.2%), followed by nature-based activities (19.5%), biking (17.4%), culinary experiences (14.3%), and shopping (14.3%). The activities in which visitors actually participated are similar to the previously mentioned activities, and also include water excursions, museums, and wellness activities.
Amongst Hilton Head Island’s overnight visitors, 70.6% indicated they had visited Hilton Head Island, SC for the first time, suggesting that the destination continues to appeal to new visitors
HILTON HEAD ISLAND VISITOR PROFILE SURVEY 2023 2
TRIP CHARACTERISTICS
The average group size of those surveyed was 4.7 for overnight visitors and 5.3 for day trip visitors. While the main mode of transportation around the island continues to be personal/family car (31.7%), transportation to the saw significant increase in flying into the destination from the prior survey (36.9% to 52.8%), with the majority of visitors flying into Hilton Head Island Airport
The average length of stay for those surveyed varied by segment; those staying in villa rentals stayed approximately 8.1 nights, hotel visitors stayed 6.5 nights, timeshare visitors stayed 8.0 nights, and second homeowners stayed 9.7 nights. The overall average was 6.9 nights.
Resorts stood out as the most popular choice of paid accommodation for overnight visitors (56.1%), followed by home/villa rentals (15.6%), hotels (13.7%), timeshares (6.1%), and second homes (3.0%).
TRAVEL PLANNING
VRBO remains by far the most popular online booking platform for villas/homes (32.2%), followed by local vacation rental companies (22.2%) and the local resorts’ online booking platforms (e.g., Sea Pines, Palmetto Dunes) (10.8%) The percentage of respondents booking via Airbnb remains steady year-to-year at around 11%.
Other destinations like Gulf Shores, Alabama Golf Trail, Hawaii, the Caribbean, and the Outer Banks were the top competitors for Hilton Head Island as alternative beach destinations. The top competing market was Gulf Shores.
Top reasons for choosing to visit Hilton Head Island were beach destination (32.6%), wanting to visit nature-based attractions (23.4%), previous visitation (20.4%), wanting to visit heritage attractions (18.2%), and word-of-mouth/recommendation (12.2%).
Of those visitors surveyed, 80.2% indicated an intention to return to visit Hilton Head Island, which signals a high degree of trip satisfaction.
HILTON HEAD ISLAND VISITOR PROFILE SURVEY 2023 3
NON-VISITORS
Of those who indicated not to have traveled at all or not to have traveled to the Hilton Head Island / Bluffton area in the past 12 months (N=169), 33.7% had never visited the Hilton Head Island / Bluffton area before, and 50.3% had visited one to five times before.
Of those non-visitors, 47.0% traveled elsewhere, 26.0% plan to visit in the future, 4.0% were hesitant because of unpredictable weather events, 3.0% mentioned health reasons, 2.0% did not find what they were looking for, and 2.0% did not travel at all. Of those who did not visit the Hilton Head Island / Bluffton area, alternative destinations in the Southeast (42.0%) and South (27.0%) were the most popular. Nonetheless, 48.8% of the non-visitors indicated they had plans to visit the Hilton Head Island / Bluffton area within one year.
TRAVEL BEHAVIOR
Looking at the travel behavior of both visitors and non-visitors together, the majority (50.6%) take two to four leisure/vacation trips per year, and they are most likely to travel between May and October.
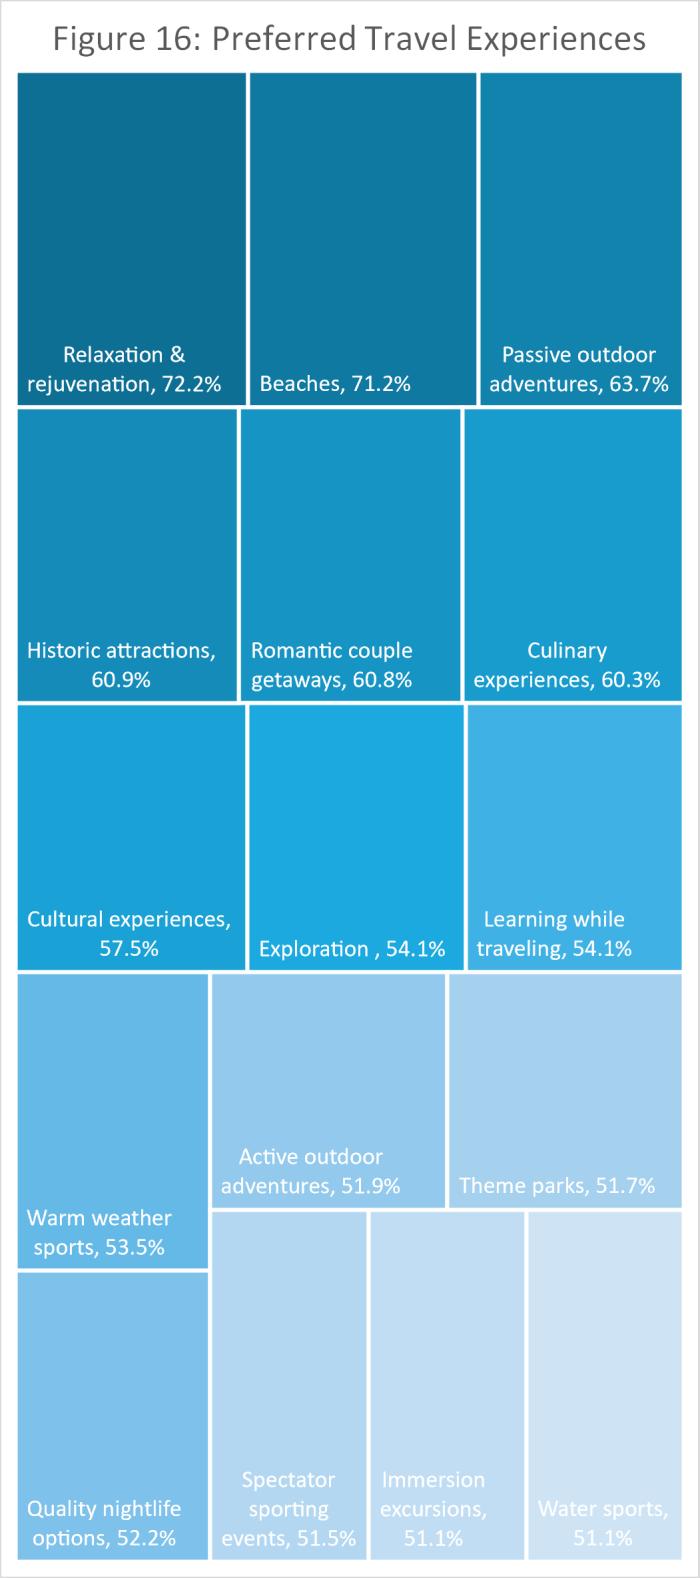
The top five most appealing experiences for leisure trips/vacations were: relaxation & rejuvenation (72.2%), beaches (71.2%), passive outdoor adventures (63.7%), historic attractions (0.9%), and romantic couple getaways (60.8%).
The following attributes were most important in choosing a leisure vacation: natural beauty of the destination (76.9%), quality of dining options (74.6%), ease of access (73.3%), affordability (73.0%), quality of lodging options (72.6%), diversity of dining options (70.4%), and diversity of lodging options (65.9%).
HILTON HEAD ISLAND VISITOR PROFILE SURVEY 2023 4

HILTON HEAD ISLAND VISITOR PROFILE SURVEY 2023 5
METHODOLOGY
The 2023 Visitor Profile Study (VPS) for the Hilton Head Island and Bluffton Area was conducted electronically. Between mid-January 2023 and January 2024, emails were sent on a rolling basis to invite individuals to participate in the VPS. These individuals had previously visited www.hiltonheadisland.org or www.visitbluffton.org and submitted their email addresses, and they were contacted following their anticipated dates of visitation. In addition, invitations to complete the survey were posted multiple times during the same time period on the social media channels of the Hilton Head Island Visitor & Convention Bureau and Explore Bluffton.
A total of 1,710 completed surveys were collected. This report is based largely on the 1,115 respondents who visited Hilton Head Island as an overnight or day trip, along with individuals who did not travel at all or did not travel to Hilton Head Island / Bluffton.
This report presents the results of the present study, together with comparative results from the last three times this study was completed, examining visitation in 2019, 2021, and 2022. When 2019 data is not presented, it is because the question was not asked in that survey.
The table below shows the visitor estimates for Hilton Head Island by segment for 2021, 2022, and 2023. The estimates are based on secondary data for hotel, timeshare, and villa visitors, as well as primary data collected regarding second homeowners, their guests, and day trippers.
Table 1: Visitor Estimates for 2021-2022 and Percent Change Comparison
HILTON HEAD ISLAND VISITOR PROFILE SURVEY 2023 6
Visitor Segment 2021 2022 2023 Change (%) vs 2021 Change (%) vs 2022 Villa/Home Rentals 962,686 951,126 920,345 -4.4% -3.2% Hotels/Resorts 508,977 497,574 481,328 -5.4% -3.3% Timeshares 481,934 481,461 477,628 -0.9% -0.8% Second Homeowners 719,302 710,673 674,278 -6.3% -5.1% Non-paying Guests 186,667 184,428 174,983 -6.3% -5.1% Day trippers 267,290 264,083 255,358 -4.5% -3.3% Total Visitors 3,126,856 3,089,346 2,983,919 -4.6% -3.4%
HILTON HEAD ISLAND VISITOR PROFILE SURVEY 2023 7
SURVEY FINDINGS
SAMPLE DEMOGRAPHICS
Marital Status
Education (highest level completed) Grade
Age
Household Income
$50,000-$74,999
$75,000-$99,999
$100,000-$149,999
$150,000-$199,999
$200,000-$249,999
$250,000 or more
Table 2: Demographics
HILTON HEAD ISLAND VISITOR PROFILE SURVEY 2023 8
2019 2021 2022 2023 Gender Female 67.4% 62.5% 48.8% 54.1% Male 32.6% 37.4% 51.1% 45.7% Self-identify - 0.1% - 0.3%
Married 76.7% 76.7% 77.3% 86.4% Single 8.5% 9.2% 9.9% 6.7% Divorced 7.4% 7.7% 5.8% 3.4% Living as Married 3.8% - -Widowed 3.1% 5.3% 5.9% 2.8% Separated 0.5% 1.1% 1.1% 0.7%
School 0.2% 0.7% 0.4% 0.9% High School 8.0% 8.0% 6.5% 3.8% Some College 19.6% 20.9% 21.5% 22.6% Associates Degree (2 years) 13.1% 13.6% 13.2% 16.0% Bachelor’s Degree (4 years) 31.5% 32.9% 32.3% 33.0% Graduate Degree (Post degree/MA) 26.9% 23.8% 26.1% 23.7%
19 years or younger 0.1% 0.1% 0.1% 0.3% 20 to 29 years 0.9% 10.5% 23.8% 24.1% 30 to 39 years 5.9% 16.5% 28.8% 39.4% 40 to 49 years 15.3% 12.6% 13.1% 8.3% 50 to 59 years 26.8% 18.7% 10.9% 9.4% 60 to 69 years 34.4% 25.8% 14.2% 11.6% 70 years and over 15.9% 14.5% 8.6% 6.3% Not Applicable 0.6% 1.4% 0.3% 0.5%
Under $24,999 1.4% 2.3% 1.5% 1.1% $25,000-$34,999 1.8% 6.3% 4.1% 1.8%
5.5% 7.7% 8.0% 6.5%
$35,000-$49,999
12.6% 15.7% 12.2% 17.1%
14.6% 17.7% 17.2% 17.0%
22.1% 24.6% 21.8% 17.0%
11.3% 13.0% 17.1% 18.0%
5.8% 5.9% 9.4% 15.9%
6.2% 6.8% 8.6% 5.6% Not
18.8% - -N 1,682 1,884 1,913 1,154
Applicable
HILTON HEAD ISLAND VISITOR PROFILE SURVEY 2023 9 SAMPLE POINT OF ORIGIN ZIP Code Analysis – Top 30 MSAs Metropolitan Area Sum MSA Percent MSA Share 1 Los Angeles-Long Beach-Anaheim, CA 106 9.3% 2 New York-Newark-Jersey City, NY-NJ 79 6.9% 3 Atlanta-Sandy Springs-Roswell, GA 44 3.9% 4 Philadelphia-Camden-Wilmington, PA-NJ-DE-MD 41 3.6% 5 San Francisco-Oakland-Fremont, CA 39 3.4% 6 Washington-Arlington-Alexandria, DC-VA-MD-WV 38 3.3% 7 Chicago-Naperville-Elgin, IL-IN 34 3.0% 8 Pittsburgh, PA 33 2.9% 9 Charlotte-Concord-Gastonia, NC-SC 23 2.0% 10 Columbus, OH 23 2.0% 11 Detroit-Warren-Dearborn, MI 20 1.8% 12 Charleston-North Charleston, SC 17 1.5% 13 Louisville/Jefferson County, KY-IN 17 1.5% 14 Rural OH 16 1.4% 15 Boston-Cambridge-Newton, MA-NH 15 1.3% 16 Cincinnati, OH-KY-IN 15 1.3% 17 Houston-Pasadena-The Woodlands, TX 15 1.3% 18 Kansas City, MO-KS 15 1.3% 19 Albany-Schenectady-Troy, NY 14 1.2% 20 Baltimore-Columbia-Towson, MD 14 1.2% 21 Austin-Round Rock-San Marcos, TX 13 1.1% 22 Riverside-San Bernardino-Ontario, CA 13 1.1% 23 San Diego-Chula Vista-Carlsbad, CA 13 1.1% 24 Jacksonville, FL 12 1.1% 25 Wisconsin Rapids-Marshfield, WI 12 1.1% 26 Greenville-Anderson-Greer, SC 11 1.0% 27 St. Louis, MO-IL 11 1.0% 28 Akron, OH 10 0.9% 29 Columbia, SC 10 0.9% 30 Rural TX 10 0.9% Other 408 35.8% Total 1,141 Table 3: ZIP Code Analysis – Top 30 MSAs
International Markets
Figure 1: International Markets by Year
Figure 1: International Markets by Year
4: International Markets by Year
HILTON HEAD ISLAND VISITOR PROFILE SURVEY 2023 10
2019 2021 2022 2023 Canada 52.1% 49.3% 47.8% 38.0% Middle East 0.0% 5.3% 7.2% 26.8% Europe 25.4% 17.3% 18.8% 16.9% Asia 1.0% 9.3% 4.3% 9.9% Australia/Oceania 1.4% 1.3% 5.8% 5.6% Africa 2.1% 6.7% 7.2% 1.4% South America 4.2% 2.7% 5.8% 1.4% Caribbean 1.4% 4.0% 2.9%Antarctica - 2.7% -Central America 8.5% 1.3% -N 71 75 69 71
38% 27% 17% 10% 6% 1% 1% 0% 0% 0% 0% 10% 20% 30% 40% 50% 60%
Table
2019 2021 2022 2023
TRAVEL TO THE HILTON HEAD ISLAND / BLUFFTON AREA
Within the last 12 months have you traveled or taken a vacation? 1
Figure 2: Travel Frequency by Year
Figure 2: Travel Frequency by Year
TABLE 5: Travel Frequency by Year
Did you visit Hilton Head Island, SC or Bluffton, SC in the last 12 months? 1
Figure 3: Hilton Head Island Visitation by Year
Figure 3: Hilton Head Island Area Visitation by Year
TABLE 6: Hilton Head Island Area Visitation by Year
1 For the 2019 report, these questions asked about the last 18 months instead of the last 12 months. Also, in 2019 the second question was asked of all respondents, whereas in 2021 and 2022 it was just asked of those who had travelled.
HILTON HEAD ISLAND VISITOR PROFILE SURVEY 2023 11
2019 2021 2022 2023 Yes 94.3% 80.4% 87.8% 91.8% No 5.7% 19.6% 12.2% 8.2% N 1,684 2,084 2,918 1,710
2019 2021 2022 2023 Yes 56.4% 72.3% 86.5% 79.8% No 43.6% 27.7% 13.5% 12.0% N 1,713 1,675 2,547 1,570
94% 6% 80% 20% 88% 12% 92% 8% 0% 20% 40% 60% 80% 100% Yes No
2019 2021 2022 2023 56.4% 43.6% 72.3% 27.7% 87% 14% 80% 12% 0% 20% 40% 60% 80% 100% Yes No
2019 2021 2022 2023
HILTON HEAD ISLAND VISITORS
Was that your first time visiting Hilton Head Island?
Figure 4: First Time Visitor vs. Repeat Visitor by Year
Figure 4: First Time Visitor vs. Repeat Visitor by Year
TABLE 7: First Time Visitor vs. Repeat Visitor by Year
Approximately how long before your trip to Hilton Head Island did you make your first reservation (e.g., accommodation, transportation, etc.)?
Figure 5: Reservation Lead Time
Figure 5: Reservation Lead Time (Overnight Visitors)
TABLE 8: Reservation Lead Time
HILTON HEAD ISLAND VISITOR PROFILE SURVEY 2023 12
2019 2021 (Overnight) 2021 (Day trip) 2022 (Overnight) 2022 (Day trip) 2023 (Overnight) 2023 (Day trip) Yes 12.5% 38.5% 57.8% 57.4% 81.0% 28.0% 70.6% No 87.5% 61.5% 42.2% 42.6% 19.0% 72.0% 29.4% N 946 991 45 1,477 79 1,077 34
2021 2022 2023 Less than 2 weeks 17.0% 16.8% 34.9% 2 weeks to 4 weeks 14.6% 18.9% 35.4% 1 to 2 months 16.6% 17.8% 8.5% 3 to 5 months 25.5% 18.4% 9.4% 6 to 12 months 22.9% 24.9% 10.2% More than 12 months 3.3% 3.2% 1.6% N 991 1,479 1,076
13% 88% 39% 62% 58% 42% 57% 43% 81% 19% 0% 20% 40% 60% 80% 100% Yes No
2019 2021 (Overnight) 2021 (Day trip) 2022 (Overnight) 2022 (Day trip) 17% 15% 17% 26% 23% 3% 17% 19% 18% 18% 25% 3% 35% 35% 9% 9% 10% 2% 0% 10% 20% 30% 40% 50% Less than 2 wks 2-4 wks 1-2 mths 3-5 mths 6-12 mths More than 12 mths
When did you make your most recent trip to Hilton Head Island?
TABLE 10: Visitation by Month by Year
Note: For the 2019 survey, data collection occurred exclusively in January/February; for the 2021 survey, data collection occurred on a continuous basis from June onwards; and for the 2022 survey forward, data collection occurred on a continuous basis throughout the year
HILTON HEAD ISLAND VISITOR PROFILE SURVEY 2023 13
2019 2021 (Overnight) 2021 (Day trip) 2022 (Overnight) 2022 (Day trip) 2023 (Overnight) 2023 (Day trip) 2018 12.9% 2019 77.8% 2020 9.3% 14.1% 26.5% 2021 85.9% 73.5% 2022 100.0% 100.0% 2023 100.0% 100.0% N 951 1,040 34 1,477 79 1,044 33 TABLE
Year by Year 2019 2021 (Overnight) 2021 (Day trip) 2022 (Overnight) 2022 (Day trip) 2023 (Overnight) 2023 (Day trip) January 9.5% 1.9% 0.0% 4.3% 4.3% 5.1% 3.0% February 2.2% 3.0% 2.9% 6.4% 4.3% 6.9% 0.0% March 5.3% 5.3% 8.6% 6.8% 11.4% 6.9% 3.0% April 8.9% 11.5% 5.7% 9.6% 7.1% 8.8% 15.2% May 5.8% 12.0% 5.7% 9.5% 4.3% 6.8% 12.1% June 10.4% 17.8% 31.4% 11.7% 12.9% 15.4% 18.2% July 10.6% 20.0% 25.7% 11.4% 11.4% 10.3% 12.1% August 12.3% 5.8% 2.9% 11.4% 25.7% 8.7% 12.1% September 10.2% 7.2% 5.7% 9.3% 11.4% 9.3% 6.1% October 11.4% 6.5% 8.6% 9.2% 1.4% 8.2% 9.1% November 7.2% 4.7% 0.0% 6.3% 2.9% 6.9% 0.0% December 6.2% 4.3% 2.9% 4.2% 2.9% 6.6% 9.1% N 951 1,504 34 1,361 70 1044 33
9: Visitation
Figure 6: Visitation by Month By Year
5% 7% 7% 9% 7% 15% 10% 9% 9% 8% 7% 7% 0% 5% 10% 15% 20% 25%
2019 2021 2022 2023
Figure 6: Visitation by Month by Year
Approximately how many nights was your trip to Hilton Head Island?
Figure 7: Length of Stay by Year
Figure 7: Length of Stay by Year
HILTON HEAD ISLAND VISITOR PROFILE SURVEY 2023 14
2019 2021 2022 2023 None/day trip only 2.0% 4.5% 5.2% 3.1% 1 night 1.9% 1.8% 2.4% 0.4% 2 nights 3.1% 4.9% 8.9% 5.6% 3 nights 10.3% 7.5% 11.3% 10.2% 4 nights 10.0% 9.3% 10.2% 7.9% 5 nights 7.7% 9.6% 10.5% 7.5% 6 nights 12.4% 10.9% 9.5% 7.6% 7 nights 30.4% 34.0% 19.3% 15.4% 8 nights 2.1% 3.4% 3.4% 5.5% 9 nights 2.3% 2.6% 1.8% 3.7% 10 nights 3.4% 3.1% 3.2% 3.7% 11 nights 0.5% 0.4% 1.3% 2.6% 12 nights 0.8% 0.9% 1.4% 3.7% 13 nights 0.6% 0.7% 0.8% 2.9% 14 nights 4.8% 4.2% 3.6% 4.4% 15 nights 0.5% 0.8% 1.1% 2.9% More than 15 nights 7.1% 1.1% 6.2% 12.8% N 950 996 1,519 1,103 TABLE
2% 5% 20% 20% 33% 20% 5% 7% 17% 21% 37% 14% 5% 11% 21% 20% 23% 19% 3% 6% 18% 15% 21% 37% 0% 5% 10% 15% 20% 25% 30% 35% 40% None / Day Trip 1 to 2 nights 3 to 4 nights 5 to 6 nights 7 to 8 nights 9 or more nights
11: Length of Stay by Year
2019 2021 2022 2023
Please indicate how many people (including yourself) were in your travel party.
Figure 8: Average Travel Party Size by Year
Figure 8: Average Travel Party Size by Year
2019
2021 (Overnight)
2021 (Day trip)
2022 (Overnight) 2022 (Day trip)
Current report (Overnight)
Current report (Day trip)
TABLE 12: Travel Party Size by Year
Please indicate by age category how many people were in your travel party.
TABLE 13: Travel Party Ages by Year
HILTON HEAD ISLAND VISITOR PROFILE SURVEY 2023 15
2019 2021 (Overnight) 2021 (Day trip) 2022 (Overnight) 2022 (Day trip) 2023 (Overnight) 2023 (Day trip) Average 2.9 3.8 2.1 3.4 4.7 4.8 5.3 N 951 995 45 1,477 79 1,042 30
Age 0 1 2 3 4 5 6 or more Overnight Under 18 35.3% 25.6% 20.0% 15.7% 1.1% 0.5% 1.7% 18-24 85.8% 6.9% 3.4% 1.1% 0.1% 0.1% 2.5% 25-34 35.3% 6.5% 16.8% 13.0% 11.7% 13.6% 2.9% 35-44 35.3% 21.5% 21.3% 17.9% 0.6% 0.6% 2.8% 45-54 86.8% 5.6% 5.0% 0.6% 0.1% 0.2% 1.8% 55-64 84.4% 7.7% 5.3% 0.4% 0.6% 0.1% 1.7% 65+ 83.3% 5.4% 9.2% 0.6% - 0.2% 2.4% Day
Under 18 64.7% 14.7% 14.7% - - 2.9% 2.9% 18-24 67.6% 14.7% 5.9% - - 5.9% 5.9% 25-34 44.1% 14.7% 8.8% 5.9% 5.9% 5.9% 14.7% 35-44 64.7% 14.7% 8.8% - 2.9% 2.9% 5.9% 45-54 79.4% 11.8% 5.9% 2.9% - -55-64 79.4% 5.9% 2.9% 2.9% - 2.9% 5.9% 65+ 82.4% 11.8% 5.9% - - - -
Trip
2.9 3.8 2.1 3.4 4.7 4.8 5.3 0 1 2 3 4 5 6 Average
What was the main purpose of your overnight visit to Hilton Head Island?
Figure 9: Trip Purpose of Overnight Visitors
Figure 9: Trip Purpose of Overnight Visitors
Vacation/Leisure
Business + Leisure
Visiting Friends and/or Family
Business
Attending a Conference, Meeting, or Trade Show
Attending a Festival/Special Event, Performance, or Exhibit
TABLE 14: Trip Purpose of Overnight Visitors
Day Trip Visitors:
Was this visit part of an overnight vacation or a day trip from home?
Where did you stay overnight?
TABLE 15: Day Trip as Part of a Vacation or Day Trip from Home
TABLE 16: Day Trip Visitors’ Overnight Location
2 Other responses for trip purpose include research for relocation to HHI, golf or tennis tournament, birthday, or anniversary trip.
HILTON HEAD ISLAND VISITOR PROFILE SURVEY 2023 16
2021 2022 2023 Vacation/Leisure 82.1% 74.3% 87.1% Business + Leisure 6.7% 6.9% 4.4% Visiting Friends and/or Family 3.9% 5.0% 2.7% Business 2.1% 5.3% 2.5% Attending a Conference, Meeting, or Trade Show 2.3% 4.2% 1.1% Attending a Festival/Special Event, Performance, or Exhibit 0.9% 2.5% 0.7% Other2 1.9% 1.7% 1.4% N 995 1,491 1,081
2021 2022 2023 Part of a vacation 57.8% 72.2% 76.5% Day trip from home 42.2% 27.8% 23.5% N 45 79 34
2021 2022 2023 Charleston 19.2% 50.9% 26.9% Savannah 42.3% 19.3% 23.1% Tybee Island 7.7% 10.5% 19.2% Beaufort 19.2% 14.0% 15.4% Jacksonville 3.8% 3.5% 11.5% Fripp Island 3.8% -Other 3.8% 1.8% 3.8% N 26 57 26
87.1% 4.4% 2.7%2.5% 1.1% 0.7% 1.4%
Overnight Visitors:
What was your primary form of accommodation while visiting Hilton Head Island?
Figure 10: Type of Accommodation by Year
TABLE 17: Types of Accommodation by Year What was the name of the Hotel/Resort where you stayed?
HILTON HEAD ISLAND VISITOR PROFILE SURVEY 2023 17
2019 2021 2022 2023 Resort - 20.9% 19.0% 56.1% Home / Villa - Rental 39.5% 37.2% 26.6% 15.6% Hotel 18.6% 15.0% 23.6% 13.7% Home / Villa - Timeshare 25.2% 14.2% 12.7% 6.1% Home / Villa - Owned 7.1% 4.3% 5.6% 3.0% With friends/relatives 5.6% 3.4% 5.9% 2.0% RV park 1.1% 0.4% 1.5% 0.4% Other 1.4% 0.3% 0.1%None – Day Trip only 1.7% 4.3% 5.0% 3.0% N 951 1,040 1,570 1,115
Hampton Inn & Suites Bluffton-Sun City 14.7% Sonesta Resort Hilton Head Island 10.5% Hilton Beachfront Resort & Spa 10.0% The Westin Hilton Head Island Resort 7.9% Omni Hilton Head Oceanfront Resort 5.8% Sea Pines Resort 3.7% Barony Beach Club 3.2% Beach House Hilton Head Island 3.2% Comfort Suites Bluffon-Hilton Head Island 3.2% Grand Hilton Head Inn 3.2% N 190
10 Hotels or Resorts Which of the following online platforms did you use to make your home/villa reservation? 2019 2021 2022 2023 Directly with owner - 6.2% 6.0%VRBO 32.8% 34.2% 29.2% 32.3% A Local vacation rental company 22.7% 22.9% 24.7% 22.2% Directly with the resort 11.2% 15.1% 13.0% 10.8% Airbnb 2.4% 10.0% 12.0% 10.2% Vacasa - 4.9% 5.5% 6.6% HomeAway - 2.2% 3.5% 4.2% TurnKey - 1.3% - 3.0% I don't remember 3.5% 0.8% 3.0% 1.2% Booking.com - 0.3% 2.2% 0.6% None - 0.5% 0.5% 0.6% Other 23.5% 1.6% 0.5% 8.4% N 371 401 167 TABLE
0% 40% 19% 25% 7% 6% 21% 37% 15% 14% 4% 3% 19% 27% 24% 13% 6% 6% 56% 16% 14% 6% 3% 2% 0% 10% 20% 30% 40% 50% 60% Resort Home / VillaRental Hotel Home / VillaTimeshare Home / VillaOwned With friends/relatives
TABLE 18: Top
19: Booking Platforms for Home/Villa Rental
2019 2021 2022 2023
What type of transportation did you use to travel to Hilton Head Island?
TABLE 20: Modes of Transportation to Hilton Head Island
Figure 11: Modes of Transportation to Hilton Head Island
Car - Personal/Family Car - Rental Plane - Non-stop commercial flight Plane - Multi-leg commercial flight
Visitors Arriving by Plane:
TABLE 21: Arrival Airport
3 The 2019 survey did not divide commercial flights into non-stop and multi-leg, so stated percentage is for all commercial flights.
HILTON HEAD ISLAND VISITOR PROFILE SURVEY 2023 18
2019 2021 (Overnight) 2021 (Day trip) 2022 (Overnight) 2022 (Day trip) 2023 (Overnight) 2023 (Day trip) Car - Personal/Family 79.5% 67.6% 68.9% 59.3% 39.2% 26.7% 47.1% Car - Rental 14.7% 15.0% 17.8% 19.4% 41.8% 10.0% 29.4% Plane - Non-stop commercial flight 19.5%3 14.8% - 21.5% - 12.4%Plane - Multi-leg commercial flight - 10.7% - 11.0% - 52.8%Plane - Private 0.2% 0.7% 13.3% 3.4% 10.1% 1.5% 17.6% Personal RV 1.1% 2.2% - 4.9% 1.3% 1.9% 17.6% Motor Coach/Tour bus 0.0% 1.5% 6.7% 3.9% 15.2% 5.9% 11.8% Other 0.6% 0.6% - 0.1% - 0.2%N 953 995 45 1,477 79 1,115 34
Figure
Hilton Head Island
11: Modes of Transportation to
At which airport did you land? 2019 2021 2022 2023 Hilton Head Island 12.8% 39.8% 33.8% 81.6% Savannah/Hil ton Head Island International 69.5% 40.6% 38.1% 12.1% Charleston 9.2% 8.8% 12.7% 3.3% Atlanta 2.8% 5.6% 6.1% 1.4% Jacksonville 1.4% 2.0% 5.5% 1.1% Charlotte 1.4% 2.0% 3.3% 0.3% Other 2.8% 1.2% 0.4% 0.3% N 114 251 488 728
by Year
Which commercial airline did you use? 2021 2022 2023 American Airlines 38.9% 44.8% 25.4% Southwest 8.1% 9.0% 14.2% Silver Airways 0.8% 1.8% 14.2% Air Canada 5.3% 6.8% 12.8% JetBlue 6.5% 3.6% 12.2% Frontier 1.6% 2.3% 11.9% Frontier 0.4% 2.3% 11.9% Delta 16.6% 7.0% 2.6% Allegiant 10.1% 8.1% 2.1% Alaska 2.8% 10.4% 1.7% Breeze 1.2% 3.2% 1.4% Sun Country Airlines 0.4% 0.9% 0.1% United 6.9% 1.8%Spirit 0.4% 0.2%N 247 442 720 TABLE 22: Commercial Airlines Used 80% 15% 20% 68% 15% 15% 11% 69% 18% 59% 19% 22% 11% 39% 42% 26.7% 10.0% 12.4% 52.8% 47.1% 29.4% 0.0% 0.0% 0% 50% 100%
2019 2021 (Overnight) 2021 (Day trip) 2022 (Overnight) 2022 (Day trip) 2023 (Overnight) 2022 (Day trip)3
Once on Hilton Head Island, what mode(s) of transportation did you use?
Figure 12: Transportation while on Hilton Head Island
Figure 12: Transportation used while on Hilton Head Island 2019 2021
TABLE 23: Transportation Used While on Hilton Head
HILTON HEAD ISLAND VISITOR PROFILE SURVEY 2023 19
2019 2021 2022 2023 Car - personal 81.1% 67.1% 56.7% 31.7% Car - rental 19.5% 25.0% 30.5% 19.4% Bike 32.2% 23.2% 19.1% 15.2% Car service - 5.5% 10.9% 14.5% Public transportation (HHI Trolley, etc.) 5.4% 5.4% 6.8% 12.5% Shuttle offered by the hotel/resort 3.7% 4.2% 5.7% 11.1% Uber 4.1% 2.9% 9.2% 8.5% Lyft 1.1% 1.0% 3.7% 5.8% On Foot - 1.4% 1.3% 0.8% Other - 0.1% 0.1%N 948 995 1,477 1,115
81% 20% 32% 4% 5% 4% 1% 67% 25% 23% 6% 3% 5% 4% 1% 1% 57% 31% 19% 11% 9% 7% 6% 4% 1% 0% 10% 20% 30% 40% 50% 60% 70% 80% 90%
2022
Please indicate the approximate total amount of money that was spent by your party/group for each category while in the Hilton Head Island area.
Table 24: Average Per Travel Party Trip Expenditures by Category and Visitor Type
HILTON HEAD ISLAND VISITOR PROFILE SURVEY 2023 20
Villa Rental Hotel Timeshare Second Homeowner Nonpaying Guests Day Trip Overall Transportation $201 $335 $185 $107 $162 $57 $274 Lodging $2,834 $1,004 $1,229 $0 $0 $0 $1,315 Food - Dining $606 $833 $907 $579 $401 $166 $763 Food - Grocery $338 $692 $251 $314 $171 $107 $573 Shopping $485 $795 $274 $415 $479 $157 $684 Spas $29 $276 $25 $46 $49 $73 $187 Golf $54 $260 $72 $96 $150 $29 $189 Biking $69 $74 $39 $16 $37 $20 $63 Performance/Visual Arts $35 $272 $18 $12 $57 $71 $183 Festivals $12 $260 $6 $18 $37 $45 $168 Museums/Historical Tours $42 $242 $32 $12 $33 $74 $163 Boating/Sailing/Fishing $137 $288 $203 $31 $175 $91 $231 Nature-based Activities $18 $258 $17 $15 $38 $41 $169 Dolphin Tours $56 $272 $34 $8 $48 $58 $187 Tennis $13 $259 $3 $159 $11 $55 $173 Other Expenses $55 $288 $64 $75 $161 $13 $204 Total Expenditure $4,864 $5,890 $3,352 $1,894 $1,917 $1,414 $5,241
What are the three primary reasons why you visited Hilton Head Island?
TABLE 25: Three Primary Reasons for Visitation
HILTON HEAD ISLAND VISITOR PROFILE SURVEY 2023 21
2019 2021 (Overnight) 2021 (Day trip) 2022 (Overnight) 2022 (Day trip) 2023 (Overnight) 2023 (Day trip) Beaches 73.5% 75.4% 55.6% 62.0% 38.0% 40.7% 44.1% Relaxation 58.6% 51.5% 31.1% 34.1% 12.7% 31.7% 20.6% Time with family/friends 48.4% 46.6% 24.4% 32.6% 10.1% 22.2% 26.5% Nature-based activities (dolphin/turtle tours, fishing, etc.) 11.3% 12.0% 2.2% 13.3% 3.8% 19.5% 23.5% Biking 15.7% 16.4% 11.1% 21.3% 27.8% 17.4% 11.8% Culinary 13.9% 12.2% 31.1% 14.2% 27.8% 14.3% 20.6% Shopping 11.7% 10.9% 24.4% 10.7% 8.9% 14.3% 20.6% Golf 16.3% 13.7% 8.9% 10.4% 13.9% 14.1% 2.9% Business trip (convention, meeting, etc.) 1.2% 5.1% 4.4% 10.5% 24.1% 13.1% 2.9% Health/wellness/fitness 2.1% 3.4% 11.1% 5.9% 6.3% 13.1% 8.8% Boating / Sailing / Kayaking 1.6% 7.5% 11.1% 13.6% 16.5% 12.3% 26.5% Festivals 4.0% 3.6% 6.7% 8.2% 3.8% 11.6% 8.8% Attend sporting event 0.6% 4.7% 15.6% 11.2% 10.1% 11.3% 2.9% Parks 1.4% 1.8% 6.7% 4.9% 5.1% 11.1% 2.9% Heritage attractions / Museum / Historical tours 3.3% 6.5% 20.0% 10.6% 16.5% 6.1% 32.4% Tennis 2.1% 1.7% 6.7% 2.6% 11.4% 3.9% 2.9% Other 8.1% 4.1% - 3.9% 2.5% 1.8% 5.9% Wedding - 1.2% - 1.6% 0.0% 0.9% 2.9% N 953 995 45 1,477 79 1,115 34
Which of the following activities did you actively participate in?
TABLE 26: Activities Visitors Participated In
HILTON HEAD ISLAND VISITOR PROFILE SURVEY 2023 22
2019 2021 (Overnight) 2021 (Day trip) 2022 (Overnight) 2022 (Day trip) 2023 (Overnight) 2023 (Day trip) Beaches 83.2% 81.8% 42.2% 69.4% 51.9% 46.% 44.1% Biking 37.3% 40.5% 6.7% 38.4% 24.1% 31.2% 17.6% Relaxation 78.0% 68.7% 40.0% 45.6% 15.2% 28.1% 8.8% Shopping 69.1% 58.1% 46.7% 42.3% 13.9% 25.9% 29.4% Time with family/friends 70.5% 59.0% 37.8% 40.8% 20.3% 25.1% 20.6% Water excursions 24.4% 17.6% 17.8% 11.3% 29.1% 17.8% 17.6% Attend sporting event 2.3% 4.9% 8.9% 13.5% 16.5% 15.3% 11.8% Nature-based activities (dolphin/turtle tours, fishing, etc.) 30.3% 26.3% 8.9% 24.6% 7.6% 14.9% 23.5% Culinary 40.1% 29.1% 31.1% 27.5% 16.5% 14.3% 20.6% Museum / Historical tours 17.8% 15.7% 11.1% 17.9% 8.9% 9.9% 14.7% Health / Wellness / Fitness 12.6% 12.8% 4.4% 14.8% 12.7% 7.8% 14.7% Golf 23.8% 18.7% 8.9% 14.6% 6.3% 6.7% 5.9% Music or theatrical performance / Visual arts exhibit 16.7% 6.2% 8.9% 10.4% 3.8% 6.5% 8.8% Festivals 13.4% 6.5% 6.7% 12.1% 8.9% 5.8% 17.6% Business/work 2.5% 7.1% 13.3% 11.8% 11.4% 5.4% 2.9% Spas 8.0% 5.1% 6.7% 9.5% 5.1% 3.9% 5.9% Tennis 5.9% 4.9% - 3.2% 1.3% 3.9% 2.9% Sports activities 8.1% 4.4% 8.9% 5.8% 5.1% 2.8% 91.2% Other 3.9% 2.0% - 2.6% 6.3% 1.8% 5.9% University visit / Education / Intellectual programs 0.6% 1.4% 2.2% 2.0% 1.3% 1.6% 2.9% N 950 995 45 1,477 79 1,115 34
Which shopping locations did you visit?
TABLE 27: Shopping Locations Visited
Did you visit any of the following cities while staying on Hilton Head Island?
TABLE 28: Other Cities Visited While on Hilton Head
HILTON HEAD ISLAND VISITOR PROFILE SURVEY 2023 23
2019 2021 (Overnight) 2021 (Day trip) 2022 (Overnight) 2022 (Day trip) 2023 (Overnight) 2023 (Day trip) Coligny Plaza 68.8% 64.7% 26.7% 54.4% 32.9% 31.6% 23.5% Harbour Town 60.2% 55.8% 26.7% 44.2% 39.2% 29.2% 23.5% Shelter Cove Harbour 47.8% 42.0% 17.8% 36.9% 21.5% 23.0% 20.6% Shelter Cove Towne Centre 40.4% 33.4% 20.0% 25.0% 8.9% 21.2% 29.4% Downtown Bluffton 30.5% 25.4% 28.9% 31.1% 34.2% 20.4% 38.2% Tanger Outlets 53.2% 34.9% 37.8% 26.1% 22.8% 19.6% 5.9% Shopping areas off 278 (Target, Kroger, Best Buy, etc.) 42.0% 30.7% 22.2% 21.7% 20.3% 18.3% 20.6% The Shops at Sea Pines Center 32.6% 30.3% 8.9% 25.5% 6.3% 18.1% 35.3% Main Street Village 25.0% 20.2% 8.9% 24.6% 25.3% 14.9% 20.6% South Beach Marina 25.2% 21.5% 11.1% 17.7% 15.2% 14.9% 23.5% Village at Wexford 16.4% 10.9% 6.7% 12.8% 11.4% 10.9% 11.8% Buckwalter shopping areas 2.9% 4.9% 11.1% 8.3% 10.1% 10.1% 8.8% Other 5.5% 2.1% 2.2% 2.3% 1.3% 2.1% 67.6% None 2.1% 1.5% 2.2% 0.7% 1.3% 0.7% 23.5% N 945 995 45 1,477 79 1,115 34
2021 2022 2023 Bluffton 37.0% 37.4% 66.2% Tybee Island 7.3% 10.0% 51.1% Savannah 29.3% 26.0% 16.0% Charleston 15.7% 20.8% 10.5% Beaufort 17.7% 23.2% 9.4% Daufuskie Island 13.0% 17.1% 7.8% Jacksonville 5.4% 11.3% 4.8% Other 0.9% 0.5% 0.9% I did not visit any other cities. 28.8% 20.1% 12.2% N 995 1,477 1,115
TRAVEL PLANNING
Before deciding to visit Hilton Head Island, did you consider any other destinations?
Figure 13: Consideration of Alternative Destinations
Figure 13: Consideration of Alternative Destinations
TABLE 29: Consideration of alternative destinations by year
HILTON HEAD ISLAND VISITOR PROFILE SURVEY 2023 24
2019 2021 2022 2023 Yes 56.4% 59.1% 45.9% 71.8% No 43.6% 40.9% 54.1% 28.2% N 1,691 1,039 1,570 1,114
56.4% 43.6% 59.1% 40.9% 45.9% 54.1% 71.8% 28.2% 0% 10% 20% 30% 40% 50% 60% 70% 80% Yes No
2019 2021 2022 2023
Which of the following destinations did you consider visiting?
TABLE 30: Alternative Destinations by Year
HILTON HEAD ISLAND VISITOR PROFILE SURVEY 2023 25
2019 2021 2022 2023 Gulf Shores, AL 14.9% 19.8% 28.1% 18.3% Alabama Golf Trail 1.6% 23.8% 31.9% 15.1% Hawaiian Islands 4.8% 15.8% 24.4% 14.4% Other 11.3% 13.2% 13.6% 12.4% Outer Banks, NC 22.6% 28.9% 20.0% 12.3% Caribbean 12.5% 23.1% 20.4% 12.1% Marco Island/Naples, FL 12.1% 14.4% 18.2% 11.8% The Florida Keys 19.4% 12.5% 8.5% 11.6% Savannah, GA 33.9% 20.0% 19.3% 11.3% Aspen, CO 2.0% 11.5% 10.1% 10.4% Jekyll Island, GA 12.5% 13.2% 10.1% 10.4% Telluride, CO 0.8% 7.8% 12.4% 10.3% Orlando, FL 12.1% 19.3% 15.0% 9.5% Sea Island, GA 4.8% 10.4% 12.5% 9.4% Charleston, SC 45.2% 24.2% 19.3% 8.5% Sandestin, FL 8.5% 9.2% 13.1% 8.4% Reynolds Plantation, GA 1.2% 8.9% 10.7% 8.3% St. Simons Island, GA - 10.1% 10.4% 7.6% Kiawah Island, SC 14.1% 15.5% 10.8% 7.5% Sanibel Island, FL 13.7% 13.4% 13.8% 7.5% Myrtle Beach, SC 37.5% 20.5% 12.9% 7.0% Pinehurst, NC 3.2% 9.9% 12.2% 7.0% Isle of Palms, SC 12.5% 18.1% 16.1% 6.9% Sarasota, FL 6.9% 7.3% 9.6% 6.9% Napa/Sonoma, CA 2.8% 8.5% 8.9% 6.4% Tampa/St. Petersburg, FL 10.1% 9.6% 6.5% 6.3% Tybee Island, GA 18.2% 14.6% 8.8% 6.3% Ponte Vedre, FL 3.6% 8.5% 8.9% 5.5% Santa Fe, NM 1.6% 2.8% 4.0% 5.4% Bluffton, SC 0.0% 1.9% 4.4% 1.5% Total 248 425 720 800
How did Hilton Head Island make it to your list of places to consider for your vacation?
Wanted to visit a beach destination.
Wanted to visit because of the nature-based attractions.
Had visited in the past and wanted to return.
Wanted to visit heritage attractions.
It was recommended by friends/family.
Wanted to visit someplace new.
Wanted to visit some place within driving distance.
Discovered/learned about it on the internet/display ads/search engines.
Saw an advertisement in a magazine or website/social media about the area.
Safe place to visit during or after COVID-19 pandemic.
Wanted to attend a cultural/performing arts event.
Wanted to attend a sporting event.
TABLE 31: Reasons for Visiting Hilton Head Island
How likely are you to return to Hilton Head Island?
TABLE 32: Likelihood of Visiting Hilton Head Island Again
How likely are you to recommend visiting Hilton Head Island to a friend or family member?
TABLE 33: Likelihood of Recommending a Visit to Hilton Head Island
HILTON HEAD ISLAND VISITOR PROFILE SURVEY 2023 26
2019 2021 2022 2023
48.3% 49.7% 45.7% 32.6%
10.9% 14.5% 23.3% 23.4%
80.3% 60.0% 42.5% 20.4%
4.6% 7.8% 20.3% 18.2%
18.2% 24.1% 26.2% 12.2%
8.6% 18.1% 17.8% 10.6%
22.7% 23.9% 19.4% 7.9%
3.0% 7.5% 10.1% 4.7%
2.1% 4.0% 9.9% 4.4%
- 19.0% 9.3% 4.2%
1.9% 2.7% 6.3% 3.2%
1.7% 2.9% 4.3% 1.9% Other 14.2% 8.5% 5.1% 2.9% Total 953 1,039 1,570 1,288
2021 2022 2023 Very likely 74.3% 62.7% 44.4% Likely 15.0% 22.5% 24.3% Neutral 7.6% 9.5% 17.2% Unlikely 1.9% 3.7% 13.4% Very
1.3% 1.7% 0.6% Total 1,027 1,510 1,027
Unlikely
2021 2022 2023 Definitely Recommend 79.7% 70.2% 48.4% Probably Recommend 14.9% 21.8% 22.8% May or May Not Recommend 4.9% 6.2% 14.1% Probably Not Recommend 0.5% 1.5% 14.4% Definitely Not Recommend 0.0% 0.2% 0.2% Total 1,034 1,522 1,039
NON-VISITORS
Which of the following most accurately reflects why you did not visit Hilton Head Island -Bluffton during the last 12 months?
Figure 14: Reasons for Not Visiting
Figure 14: Reasons for Not Visiting
TABLE 34: Reasons for not visiting
2021 2022 2023
HILTON HEAD ISLAND VISITOR PROFILE SURVEY 2023 27
2021 2022 2023 Traveled elsewhere 37.6% 27.0% 47.0% Plan to visit in the future 20.4% 25.2% 26.0% COVID-19 pandemic 26.5% 25.8% 7.0% Health reasons 2.0% 5.0% 3.0% Too expensive 2.9% 5.3% 2.0% Didn't offer what I was looking for 0.9% 3.2% 2.0% I didn't travel at all 1.5% 0.6% 2.0% Unpredictable weather events 2.0% 4.1% 1.7% Other 6.2% 3.8% 4.0% Total 860 341 100
38% 20% 27% 2% 3% 1% 2% 2% 6% 27% 25% 26% 5% 5% 3% 1% 4% 4% 47% 26% 7% 3% 2% 2% 2% 2% 4% 0% 5% 10% 15% 20% 25% 30% 35% 40% 45% 50%
Please indicate the region(s) that you traveled to in the past 12 months.
USA - Southeast (GA, FL, NC, SC)
USA - South (AL, AR, KY, LA, MS, OK, TN, TX)
USA - Northeast (CT, MA, MA, NJ, NH, NY, PA, RI, VT)
USA - West (AK, AZ, CA, CO, HI, ID, MT, NM, NV, OR, UT, WA, WY)
USA - Midwest (IA, IN, IL, KS, MI, MN, MO, ND, NE, OH, SD, WI)
USA - South Atlantic (DE, DC, MD, VA, WV)
America and Caribbean
- Southeast (GA, FL, NC, SC)
TABLE 35: Regions Visited by Non-Visitors in the Past 12 Months
How many times have you visited Hilton Head Island-Bluffton in the past 10 years?
TABLE 36: Visitation Frequency in the Past 10 Years by Non-Visitors
Do you have plans to visit Hilton Head Island-Bluffton in the near future?
TABLE 37: Plans of visiting Hilton Head Island in the Future by Non-Visitors
HILTON HEAD ISLAND VISITOR PROFILE SURVEY 2023 28
2021 2022 2023
26.9% 33.7% 42.0%
9.0% 22.3% 27.0%
9.1% 18.5% 24.0%
9.8% 19.6% 22.0%
10.5% 20.8% 17.0%
8.0% 17.0% 16.0% Canada 1.4% 10.9% 16.0% Europe 1.2% 7.3% 10.0% Asia 0.5% 4.4% 8.0% Latin
2.1% 6.5% 6.0% Australia/New
0.2% 3.2% 6.0% Africa 0.3% 1.2% 1.0%
26.9% 33.7% 42.0% Total 860 341 100
Zealand
USA
2021 2022 2023 Never visited 38.9% 42.9% 33.7% 1 18.6% 14.0% 9.5% 2 to 5 30.2% 36.4% 40.8% 6 to 10 9.8% 5.0% 13.6% 11 to 20 1.9% 0.9% 1.2% 21 or more 0.9% 0.5% 1.2%
860 341 169
Total
2021 2022 2023 Yes, within one year 49.2% 50.1% 48.8% Yes, but not sure when 42.5% 49.0% 47.0% No 8.3% 0.9% 4.2% Total 859 341 168
TRAVEL BEHAVIOR – ALL RESPONDENTS
On average, approximately how many leisure/vacation trips do you take each year?
TABLE 38: Frequency of Leisure/Vacation Trips
Which month(s) are you most likely to travel for vacation purposes?
Figure 15: Preferred Travel Months
Figure 15: Preferred Travel Months
TABLE 39: Preferred Travel Months
HILTON HEAD ISLAND VISITOR PROFILE SURVEY 2023 29
2021 2022 2023 0 to 1 15.3% 10.0% 7.3% 2 to 4 55.1% 47.3% 50.6% 5 to 7 19.2% 29.9% 23.4% 8 to 10 6.3% 8.2% 15.8% More than 10 4.1% 4.7% 2.9% Total 1,042 984 1,625
2021 2022 2023 January 14.8% 8.5% 12.6% February 21.3% 17.8% 15.9% March 24.4% 17.7% 16.1% April 26.2% 16.5% 13.9% May 32.5% 20.5% 20.8% June 40.5% 38.4% 29.6% July 36.5% 33.7% 31.3% August 32.9% 20.7% 20.4% September 40.1% 21.4% 24.1% October 40.6% 29.8% 27.3% November 22.2% 20.0% 15.8% December 18.7% 8.5% 15.3% Total 1,042 984 1,625
15% 21% 24% 26% 33% 41% 37% 33% 40% 41% 22% 19% 9% 18% 18% 17% 21% 38% 34% 21% 21% 30% 20% 9% 13% 16% 16% 14% 21% 30% 31% 20% 24% 27% 16% 15% 0% 5% 10% 15% 20% 25% 30% 35% 40% 45%
To what extent do the following types of vacations/leisure trips and/or travel experiences appeal to you? Figure 16: Preferred Travel Experiences
+ “Very Appealing”
TABLE 40: Preferred Vacation/Leisure Travel Experiences
HILTON HEAD ISLAND VISITOR PROFILE SURVEY 2023 30
2021 2022 2023 Relaxation & rejuvenation 85.4% 66.9% 72.2% Beaches 88.4% 65.1% 71.2% Passive outdoor adventures 72.6% 64.4% 63.7% Historic attractions 75.5% 64.4% 60.9% Romantic couple getaways 70.0% 65.0% 60.8% Culinary experiences 70.1% 63.7% 60.3% Cultural experiences 70.7% 62.9% 57.5% Exploration 57.5% 59.8% 54.1% Learning while traveling 60.9% 56.3% 54.1% Warm weather sports 52.7% 61.2% 53.5% Quality nightlife options 52.6% 60.3% 52.2% Active outdoor adventures 46.8% 59.6% 51.9% Theme parks 44.7% 58.7% 51.7% Spectator sporting events 49.2% 57.0% 51.5% Immersion excursions 49.6% 57.4% 51.1% Water sports 48.8% 60.4% 51.1% Luxury camping 39.9% 55.0% 50.7% Performing/cultural arts getaways 51.2% 58.6% 50.5% Art 49.8% 57.1% 49.2% Urban getaway 48.4% 58.5% 48.0% Medical/wellness 40.8% 55.5% 47.9% Waterparks 40.3% 54.4% 47.9% Winter sports 30.2% 53.9% 42.5% Golf getaways 37.4% 50.6% 41.9% Voluntourism 29.5% 49.9% 40.8% Tennis getaways 25.8% 48.5%
Total 949 1,005 1,625
“Appealing”
36.2%
How important are the following attributes to you in choosing a leisure vacation?
Figure 17: Top Preferred Attributes for Travel
Figure 17: Top Preferred Attributes for Travel
TABLE 41: Preferred Attributes for Vacation/Leisure Travel
HILTON HEAD ISLAND VISITOR PROFILE SURVEY 2023 31
2021 2022 2023 Natural beauty of the destination 88.4% 72.1% 76.9% Quality of dining options 44.7% 72.5% 74.6% Ease of access 85.4% 70.5% 73.3% Affordability 75.5% 67.2% 73.0% Quality of lodging options 52.7% 71.0% 72.6% Diversity of dining options 70.0% 68.6% 70.4% Diversity of lodging options 25.8% 67.3% 65.9% Low traffic congestion 60.9% 64.8% 63.6% Travel distance 70.7% 63.1% 63.3% Environmental/ecological sensitivity 72.6% 67.6% 59.2% Access to other cities in the surrounding area 46.8% 58.8% 57.8% Activities like events/festivals 49.6% 64.2% 55.4% Nightlife activity options 48.4% 61.4% 53.2% Medical/wellness 37.4% 60.4% 52.6% Public transportation 57.5% 57.0% 49.2% Total 949 1,005
“Important” + “Very Important”
88% 45% 85% 76% 53% 70% 26% 72% 73% 71% 67% 71% 69% 67% 77% 75% 73% 73% 73% 70% 66% 0% 10% 20% 30% 40% 50% 60% 70% 80% 90% 100% Natural beauty of the destination Quality of dining options Ease of access Affordability Quality of lodging options Diversity of dining options Diversity of lodging options
2021 2022 2023
Please indicate the extent to which you agree with the following statements.
I would rather rely on a travel agent or tour operator than make my own travel arrangements.
I try to support the local economy of places that I visit.
N 973
TABLE 42: Travel Preferences
HILTON HEAD ISLAND VISITOR PROFILE SURVEY 2023 32
Strongly Agree Agree Neither Agree nor Disagree Disagree Strongly Disagree
10.6% 21.7% 29.9% 26.4% 11.3%
22.9% 42.8% 19.4% 12.3% 2.5%


 Melinda Patience


