
Select Soil Sampling-Compositional Analysis: Long Island, NY and Easton, PA
William Jude Hart1, Dylan Hubbs1, Lucy Botelho1, Francesca Grassia1, and Dr. Sabrina G. Sobel
1Department of Geology, Environment, and Sustainability. Hofstra University, Hempstead, NY. 2Department of Chemistry. Hofstra University, Hempstead, NY.
● There are two types of chemical components commonly found in soil:
○ Natural trace elements (e.g. calcium, copper, potassium, iron, etc.).
○ Anthropogenic elements (e.g. lead, mercury, lithium, cadmium, arsenic, etc.).1,2,5,7
● Goal: Sampling sites from Long Island and Easton, Pennsylvania to detect abundance of natural trace and anthropogenic elements.
● Long Island is a closed system via the Atlantic Ocean and waterways (e.g. East River), where matter and elements are only transferred to its close surroundings, whereas Pennsylvania is an open system where matter can be exchanged to anywhere else (due to being more inland).
● Most existing studies focus on anthropogenic pollution of heavy metals in soils of industrialized areas, but studies done on Long Island focus on waterways and hydrology rather than soil.4,6,7
● High traffic areas are hypothesized to add more non-natural and furthermore potentially toxic components to the soil.1,2


1. CHOOSING SAMPLE SITES
● Locations with consistent, heavy traffic:
○ Bethpage Parkway
○ Southern State Parkway
○ Breezy Point, NY
○ Easton, PA

4. SAMPLE COMPARISONS
Materials and Methods
2. SAMPLE COLLECTION
● Three samples were collected each site

GPS coordinates taken per sampling location


● Analysis and comparison both within this study and with other studies


Figure 1 (left): Google Earth Pro maps of sampled locations and areas along and inland relative to the Eastern Seaboard. Aerial overviews of each sample location are provided; Easton, PA (A), Hempstead Turnpike (B), Breezy Point (C), and Southern State as well Bethpage Parkways shown in the same map (D).
3. SAMPLE PROCESSING
● Dried at 100ºC for 1-7 days
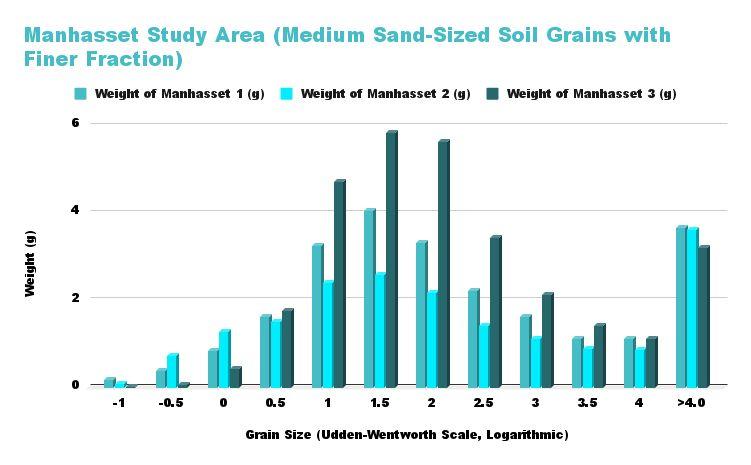
● Sorted by Udden-Wentworth grain size scale3
● Weighed and recorded weight (in grams) of grain size
● Data visualized into grain size distributions via Microsoft Excel
● Further analysis via MasterSizer, Elemental Analysis, and comparison within this study and prior studies


Future Work
● Elemental analyses (ICP-OES) of the >4 fraction of all samples by Pace Analytical
● MasterSizing of finest fractions for comparison with elemental analyses.
References

Results
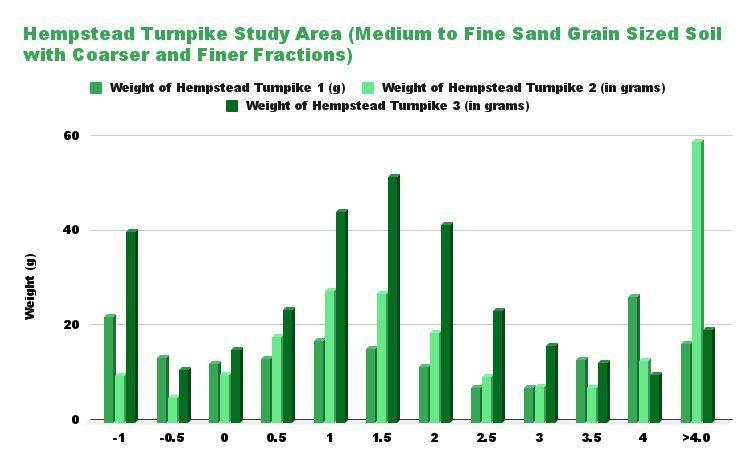
● Hempstead Turnpike (Hempstead, NY)
○ Average grain size by weight via abundance: 500-250 microns (1.5-2 on phi scale, comparable to table/granulated sugar).
○ Coarse fraction appears to increase as sample location becomes more proximal to the road.
○ Both substantial coarse and fine fractions are present across samples.
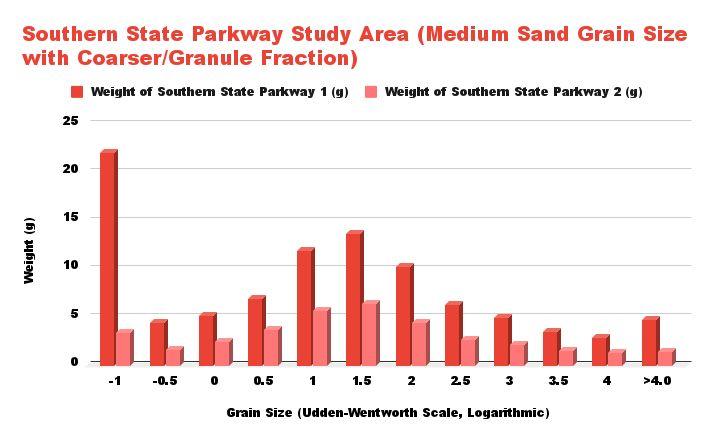
● Southern State Parkway (Hempstead, NY)
○ Average grain size by weight via abundance: 350-400 microns (In-between 1-2 on phi scale, comparable to table/granulated sugar).
○ Overall substantial coarse fraction present in both whilst lacking a substantial fine fraction.

● Bethpage Parkway (Hempstead, NY)
○ Average grain size by weight: 500-250 microns (1.5-2 on phi scale, comparable to table/granulated sugar).
○ Both substantial coarse and fine fractions are present across samples, however the coarse fraction is more prevalent.
● Breezy Point, NY
○ Average grain size: 250 microns (2 on phi scale, comparable to particle sizes in powdered sugar) with a symmetrical distribution.
○ Nearly no discernable coarse and fine fractions present, with a somewhat substantial coarse fraction present from a sample proximal to a road, similar to Hempstead Turnpike samples.
● Roslyn, NY
○ Average grain


Acknowledgements
● The Department of Geology, Environment, and Sustainability, and the Department of Chemistry at Hofstra University for providing the resources with which this project was possible.
● ChatGPT for providing real-world comparisons on the scale of microns for describing the grain sizes of our processed samples
1) Carpi, Anthony, and Chen, Yung-fou. 2002. "Gaseous elemental mercury fluxes in New York City." Water, Air, and Soil Pollution 140: 371-379.
2) Li, I., Cheng, Z., Paltseva, A., Morin, T., Smith, B., & Shaw, R. 2018. “Lead in New York city soils.” Megacities 2050: Environmental Consequences of Urbanization: Proceedings of the VI International Conference on Landscape Architecture to Support City Sustainable Development 6 62-79. Springer International Publishing.
3) Nichols, G. 2009. “Sedimentology and Stratigraphy” Wiley-Blackwell, (2nd Edition).
4) Rodenburg, L. A., Valle, S. N., Panero, M. A., Muñoz, G. R., and Shor, L. M. 2010. “Mass balances on selected polycyclic aromatic hydrocarbons in the New York–New Jersey Harbor.” Journal of Environmental Quality 39: 642-653.
5) Sanok, W. J., Ebel Jr, J. G., Manzell, K. L., Gutenmann, W. H., and Lisk, D. J. 1995. "Residues of arsenic and lead in potato soils on Long Island." Chemosphere 30: 803-806.
6) Stumm, Frederick, Andrew D. Lange, and Jennifer L. Candela. 2004. “Hydrogeology and extent of saltwater intrusion in the northern part of the Town of Oyster Bay, Nassau County, New York: 1995–98.” US Geological Survey.
7) Williams, G., Marcantonio, F.,
