
Q3-2024


Q3-2024
In the third quarter of 2024, the real estate market north of New York City experienced its first notable shift in over three years. After an extended period of dwindling inventory due to high demand, we are now observing an increase in available listings across most of our markets, offering much-needed relief to buyers.
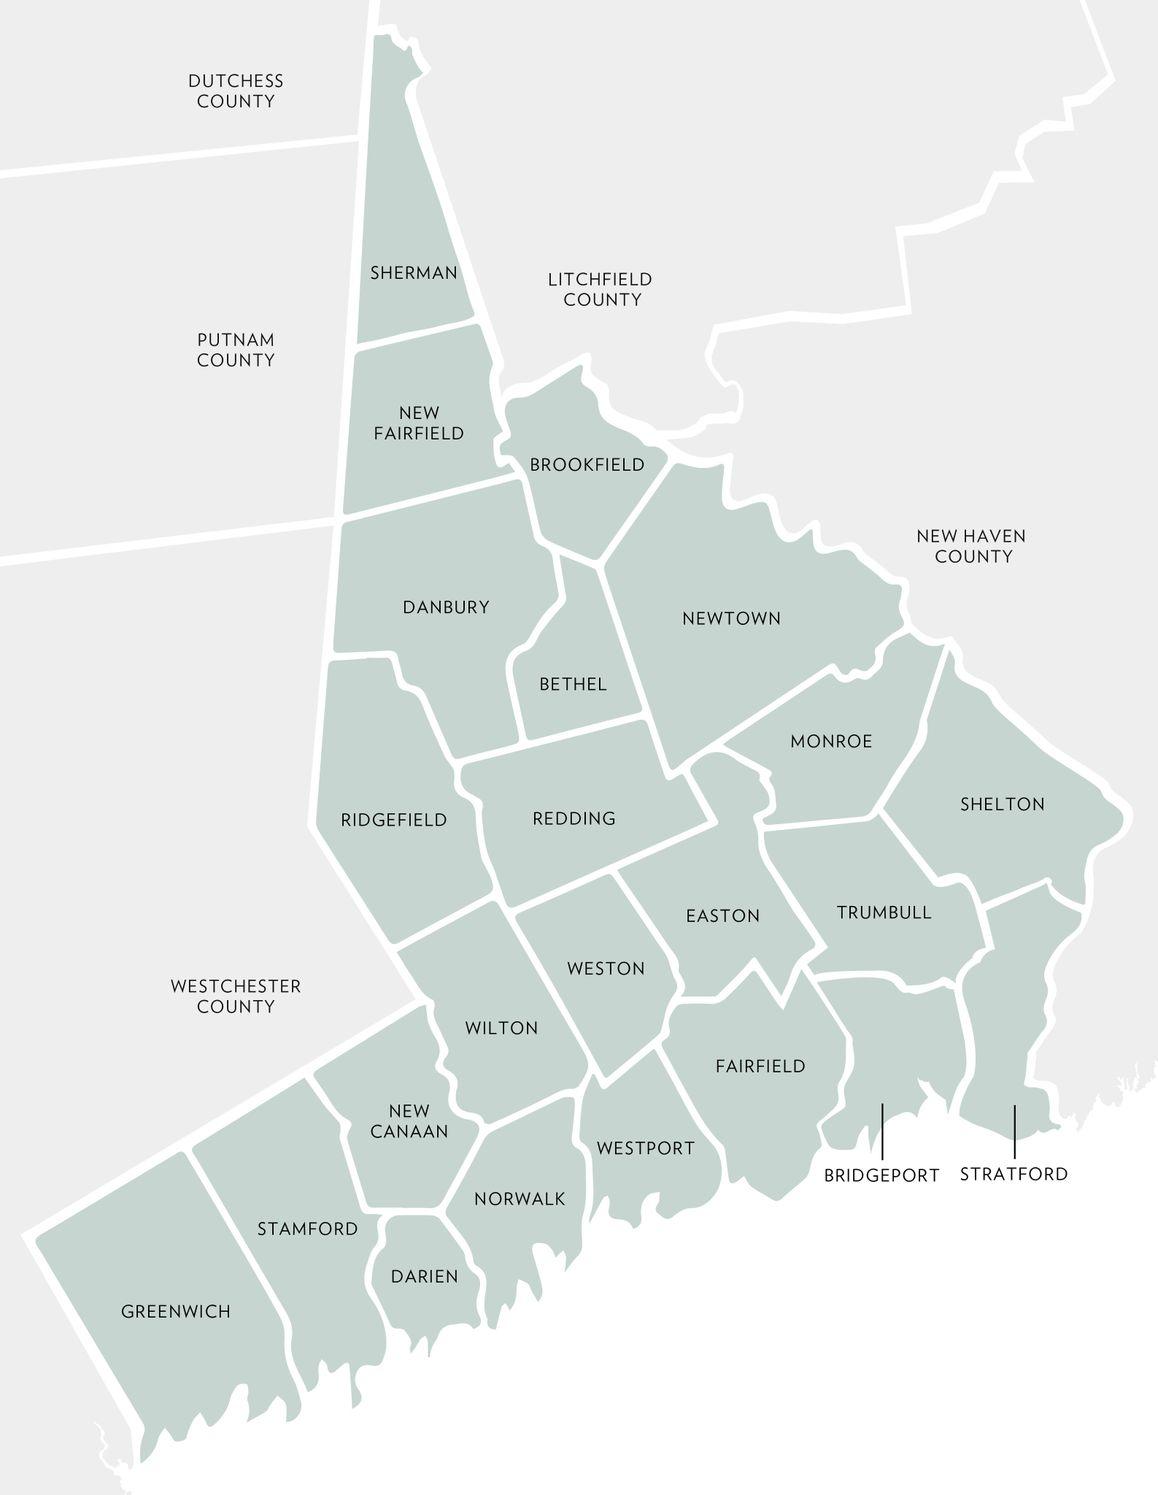
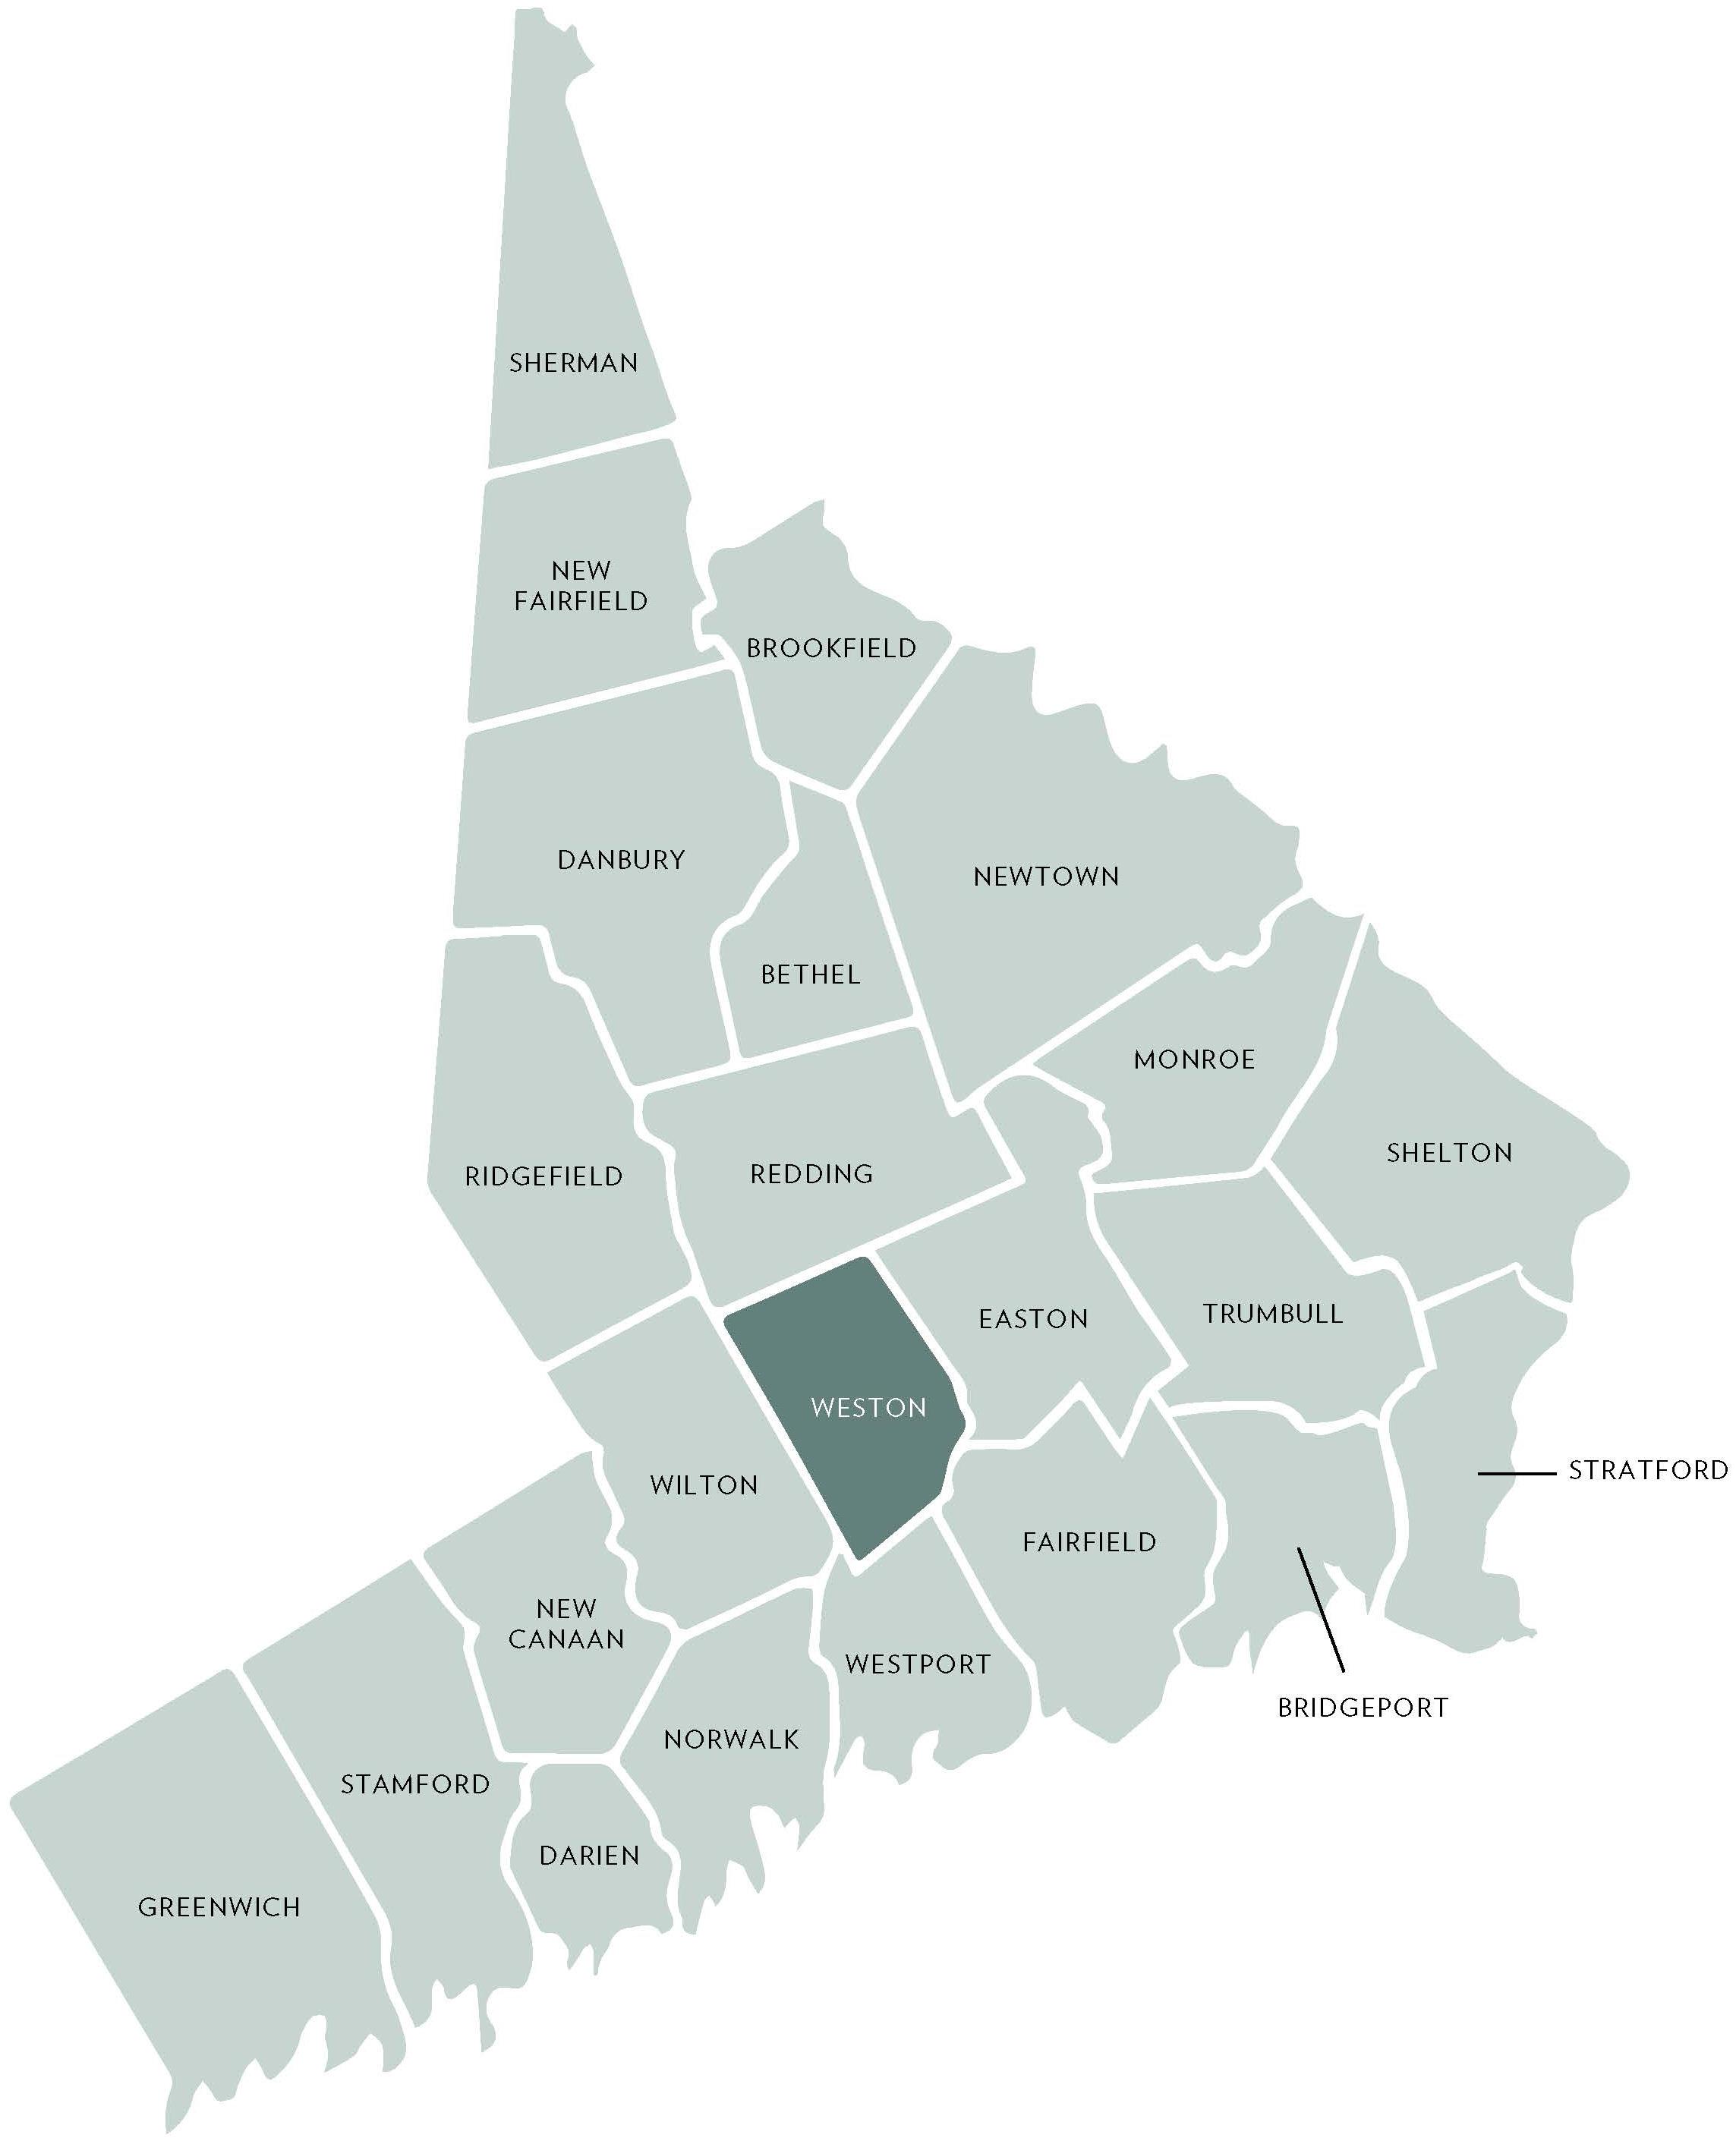
Fairfield County has seen an uptick in inventory, with listings increasing by an average of 4% year-over-year. Some areas have experienced inventory rises as high as 19% in Greenwich and 57% in Wilton. Although there has been a decline in the number of homes sold on average, the median sale price in Fairfield County has increased 9.5% this year, now at $750,000. This demonstrates that demand remains strong as more options become available.
These developments, coupled with indications from the Federal Reserve regarding potential rate cuts, may encourage sellers hesitant to enter the market to reconsider. The opportunity to capitalize on increased inventory and sustained buyer demand could prompt more movement among homeowners, particularly those looking to trade up or down.
Overall, the trends observed in the third quarter of 2024 suggest meaningful changes in the market, marking a shift in a landscape that has remained relatively flat for years. As we move forward, the sustained resilience of the buyer pool, coupled with increasing inventory levels, points towards a dynamic and evolving market environment.
With Warm Regards,
Liz Nunan President and CEO
THIRD QUARTER 2024

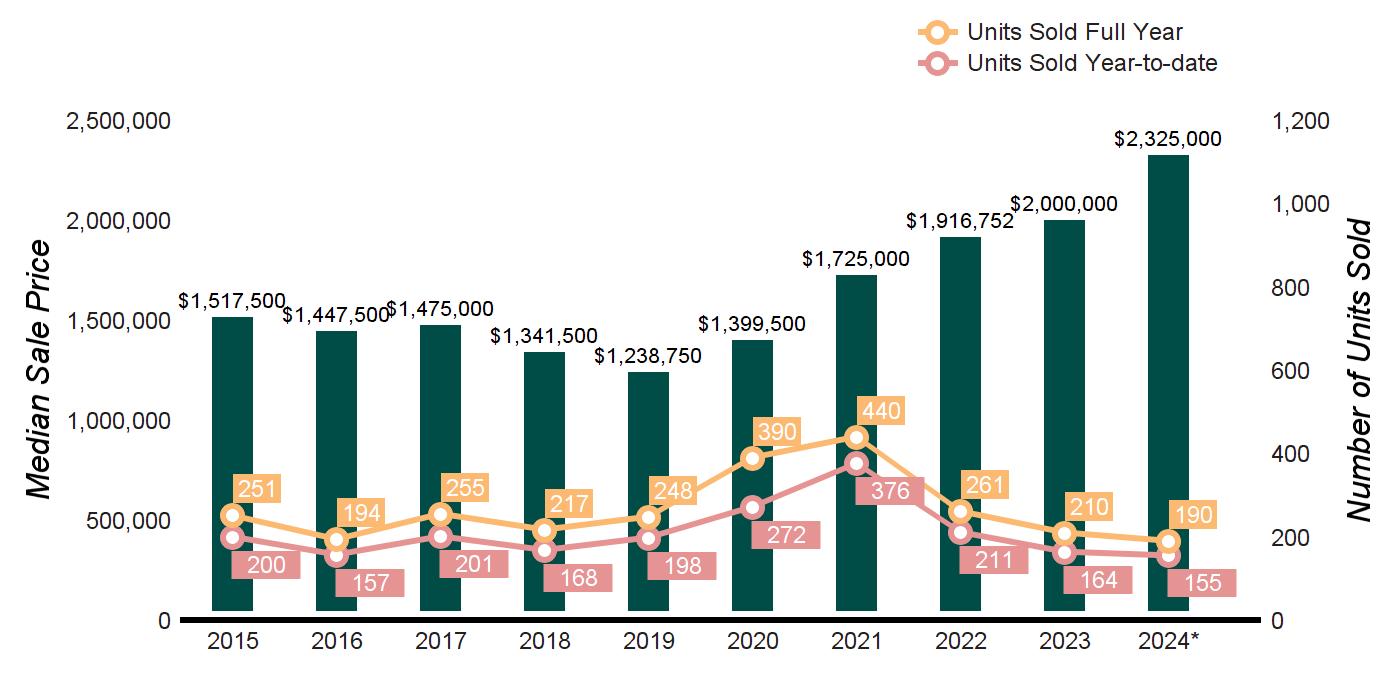
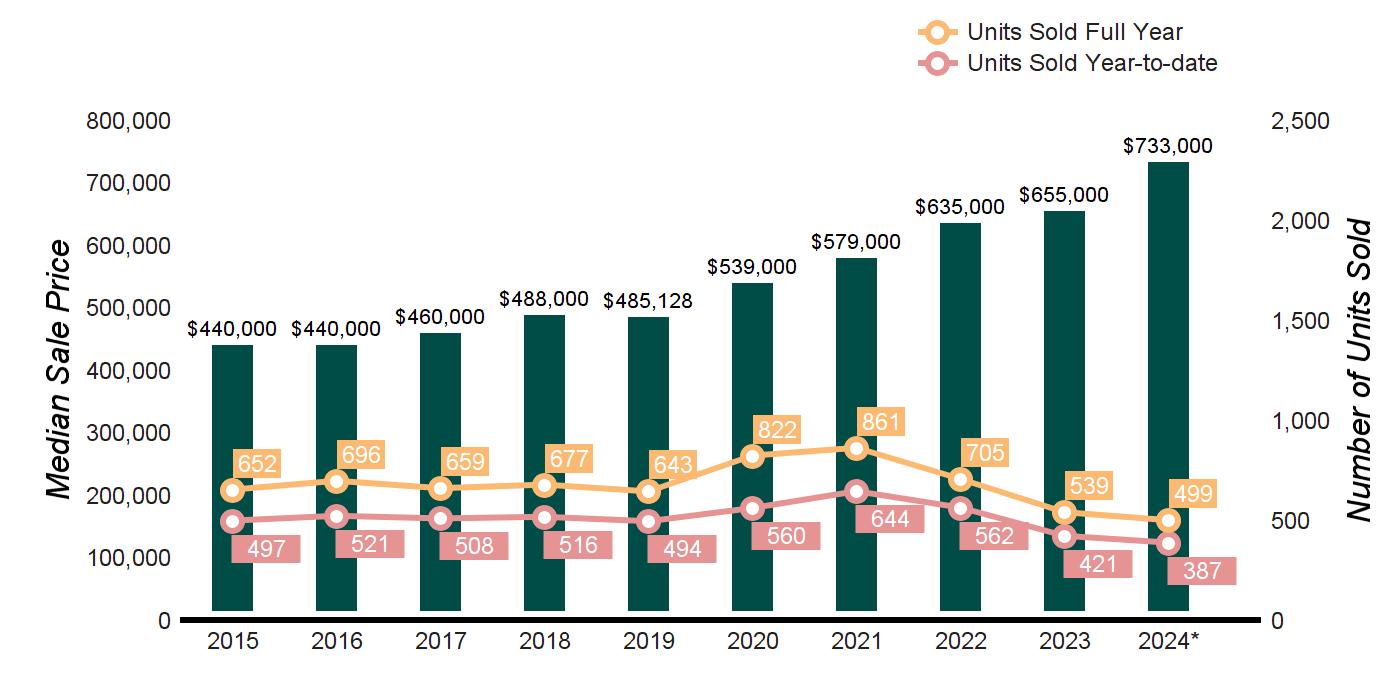
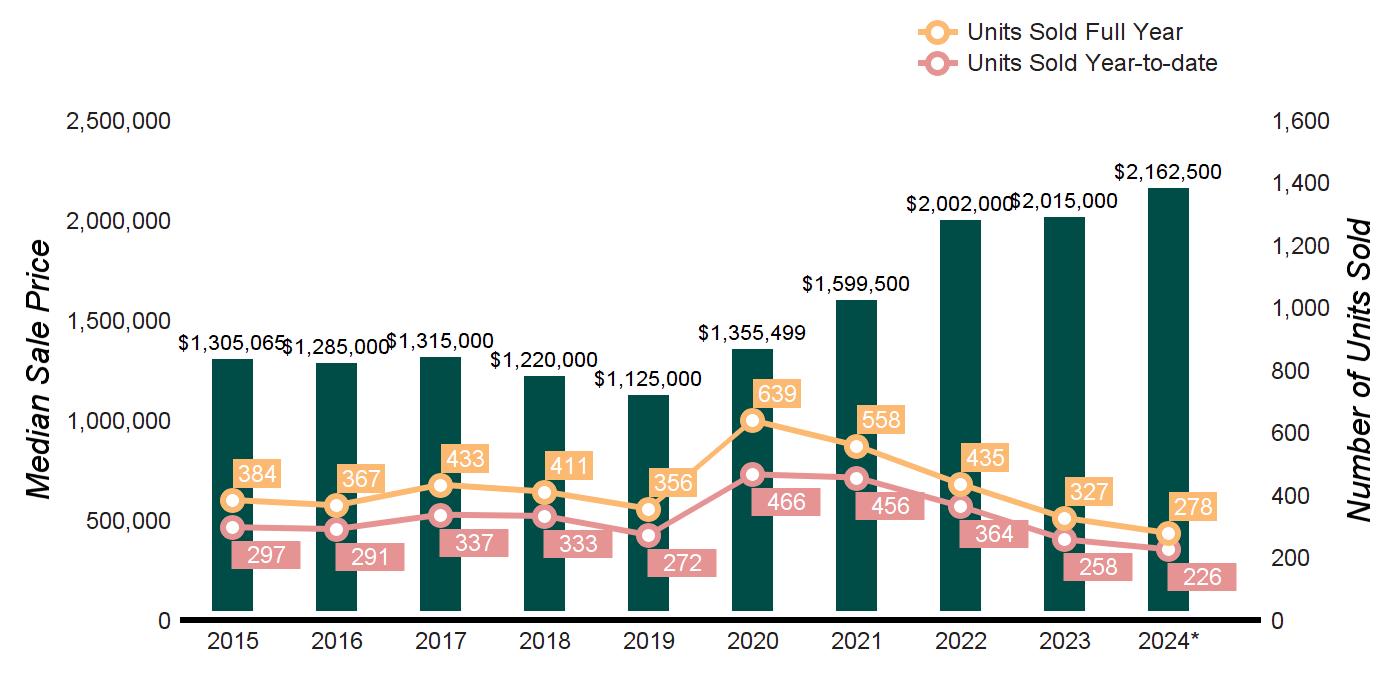
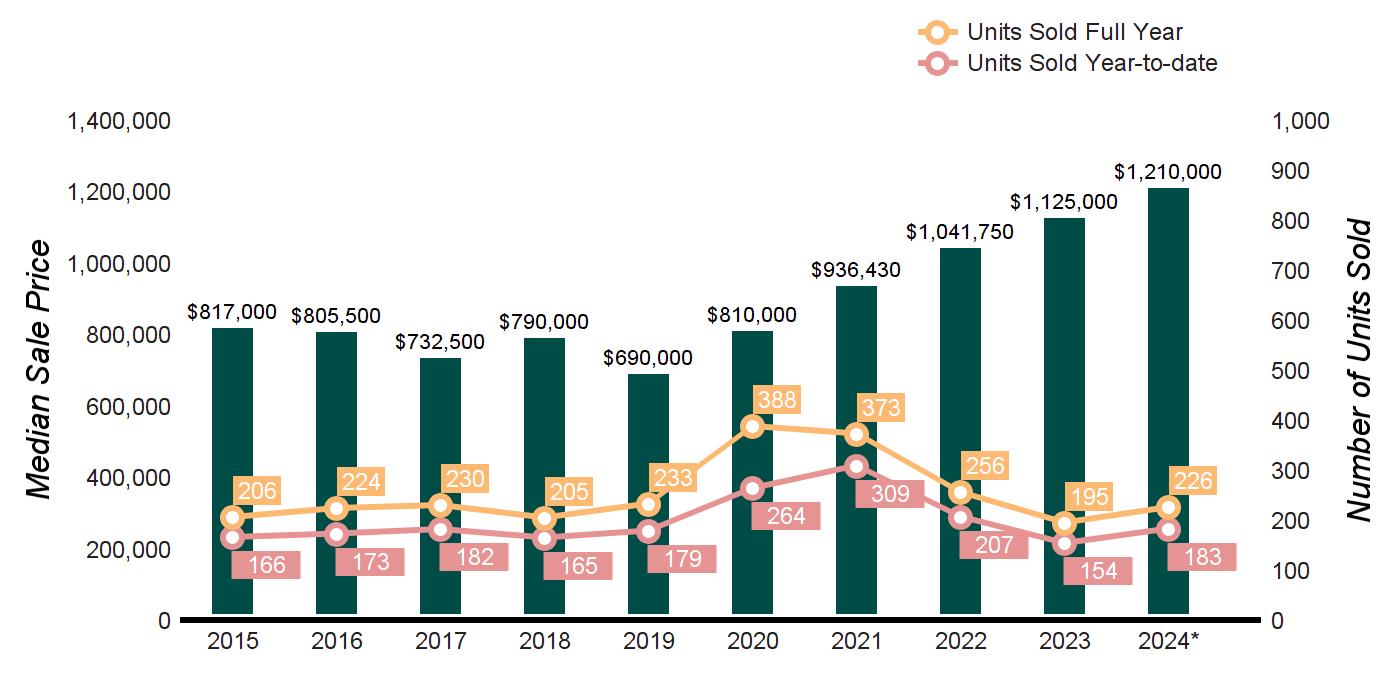
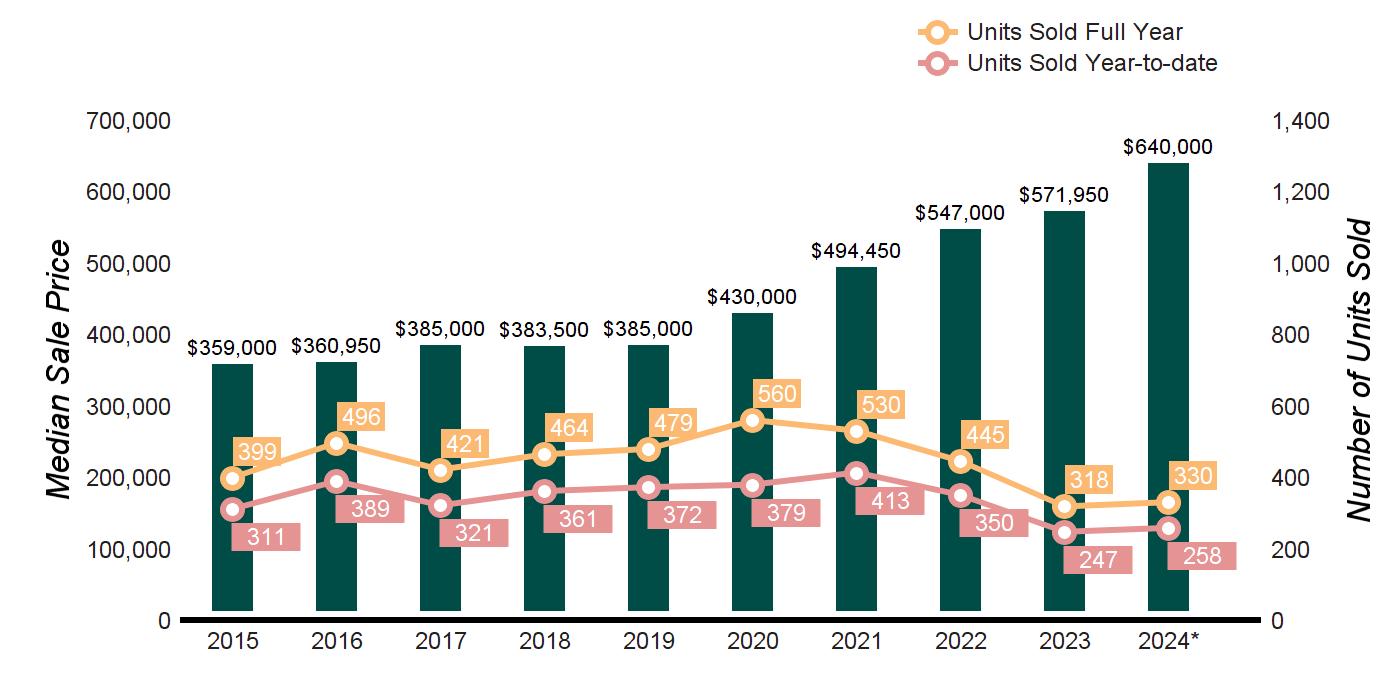
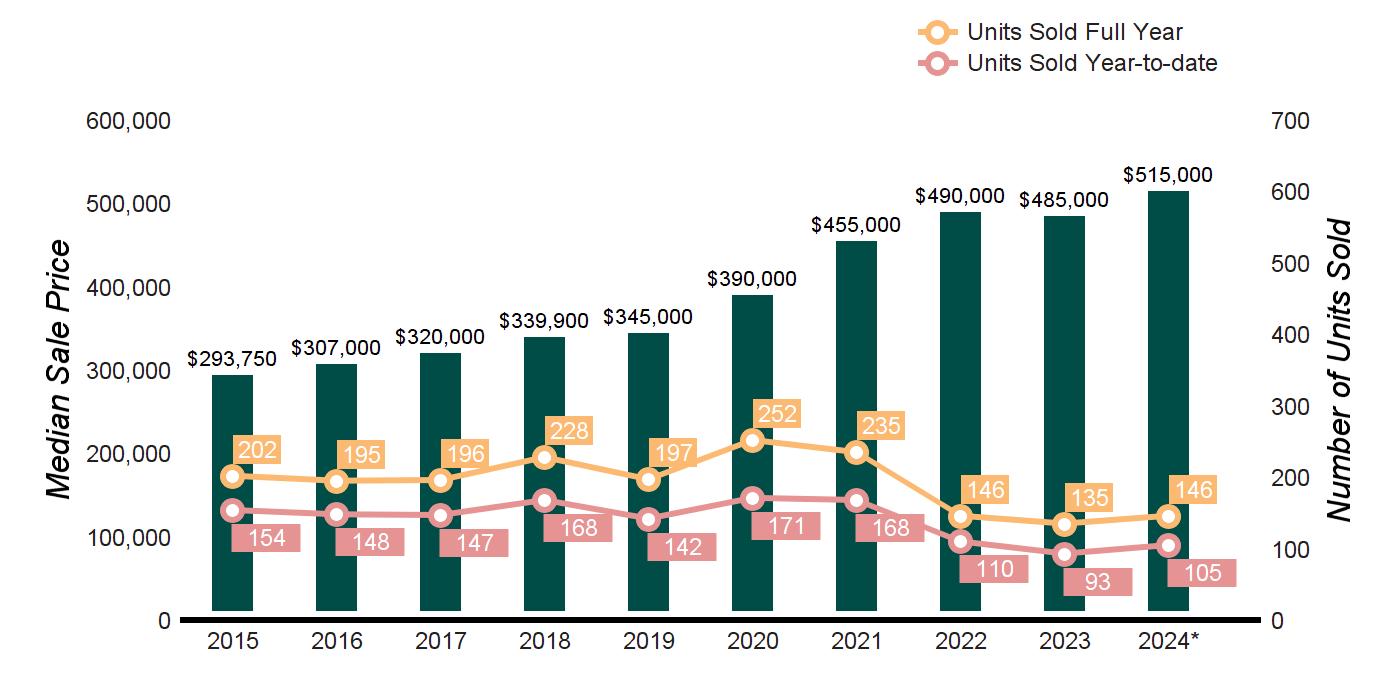
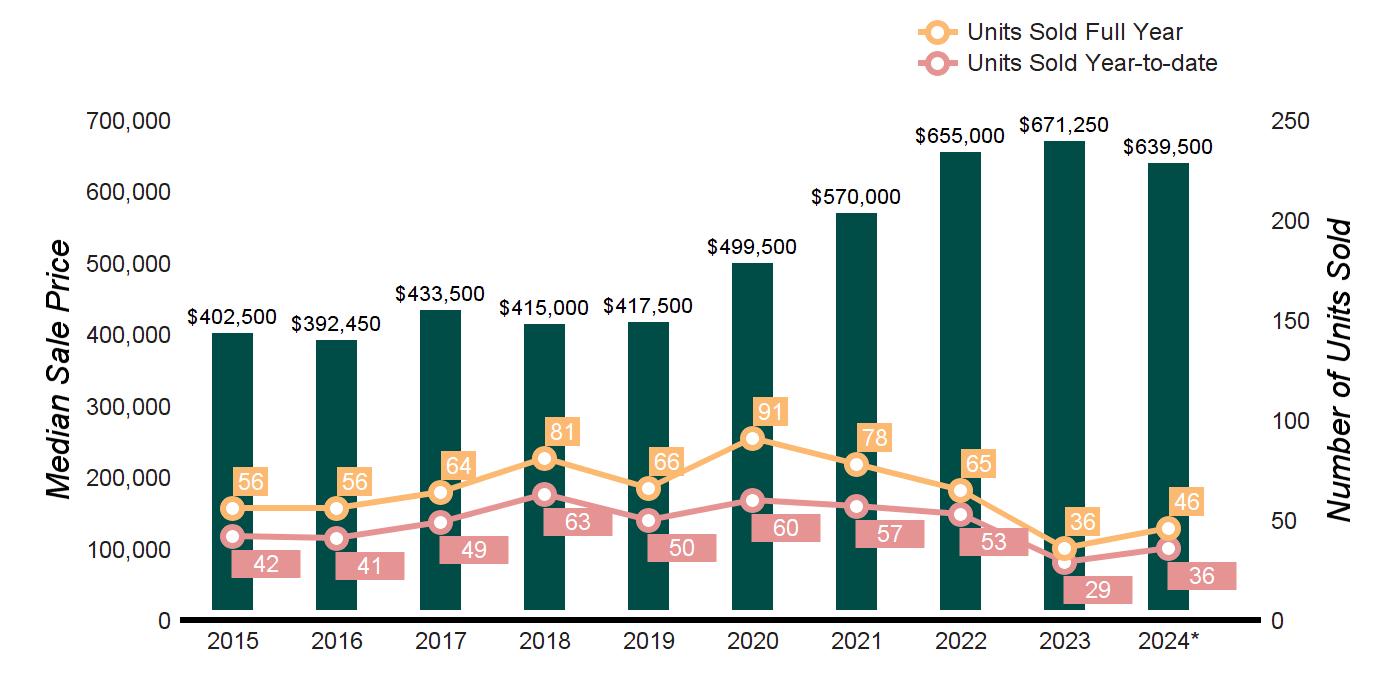
TEN-YEAR MARKET HISTORY
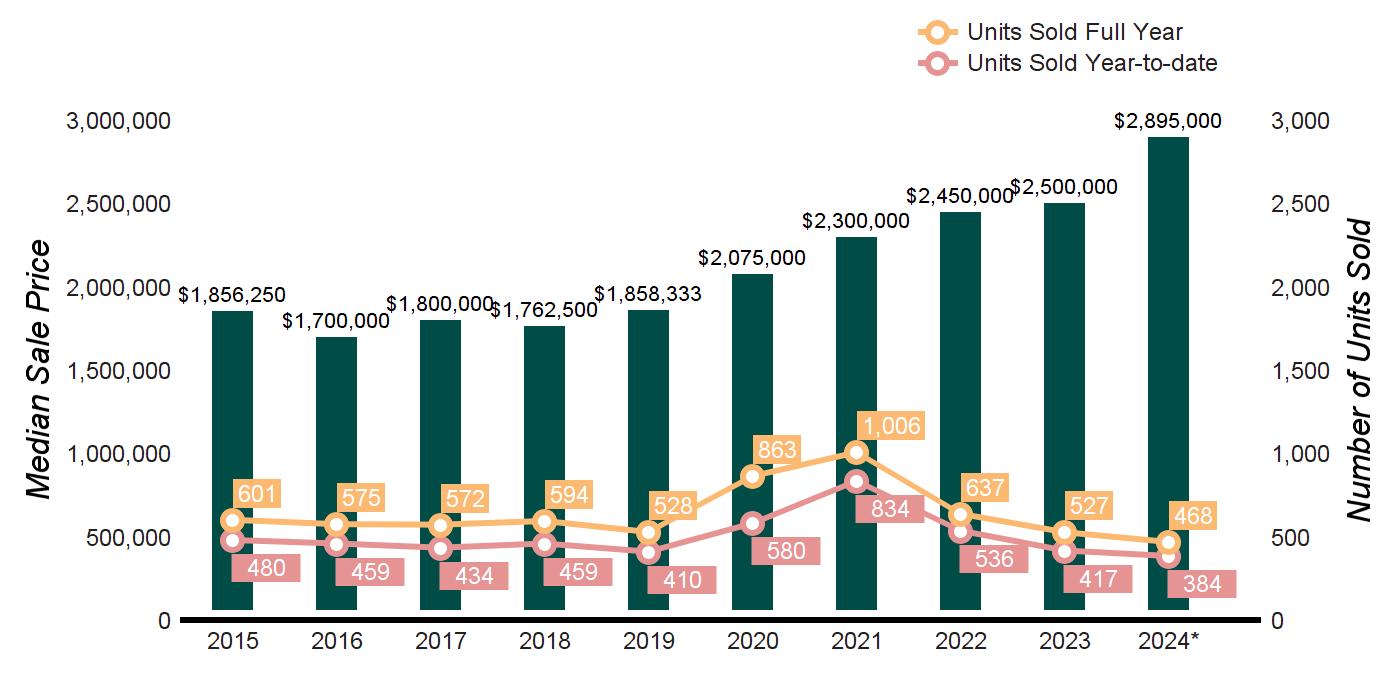
Source : Greenwich MLS, Residential / Single Family Homes * Homes sold for 2024 are annualized based on actual sales year-to-date
Demand Ratio Key 1-4: High Demand 5-6: Balanced 7-9: Low Demand
$10,000,000
Source : Greenwich MLS, Residential / Single Family Homes

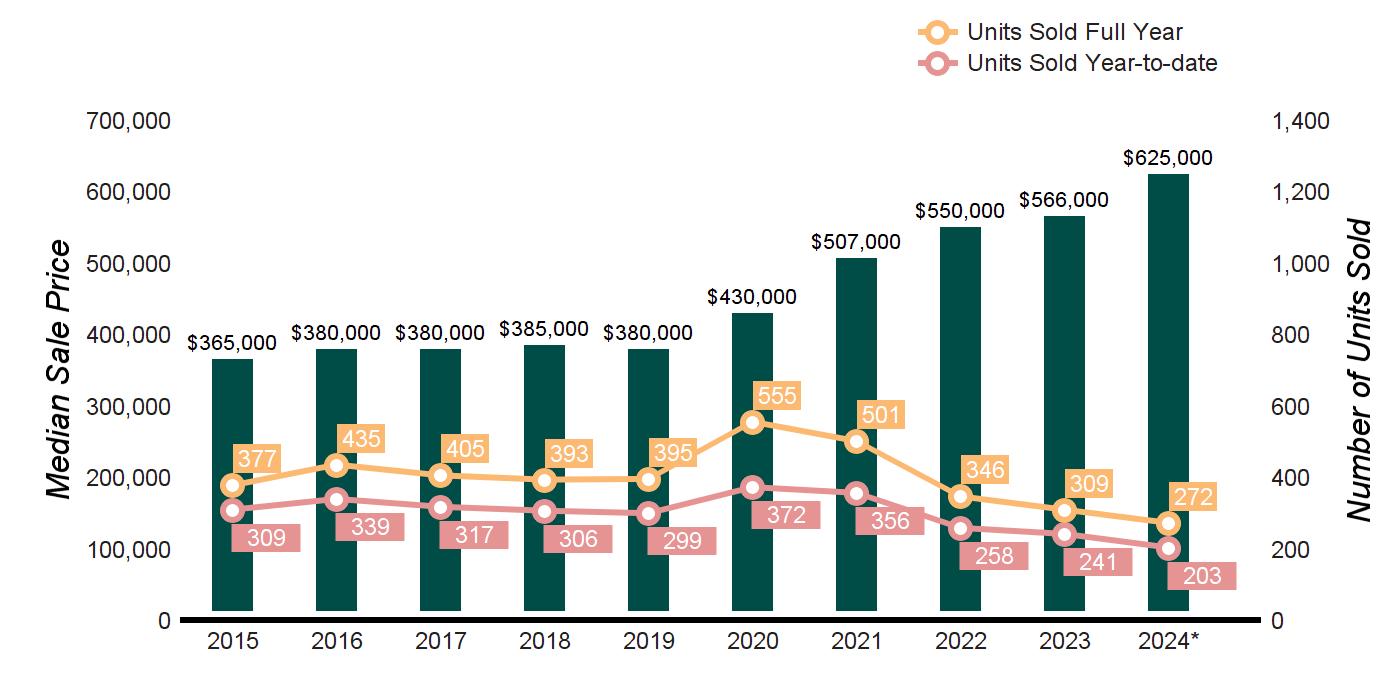
TEN-YEAR MARKET HISTORY
Source : Smart MLS, Single Family Homes

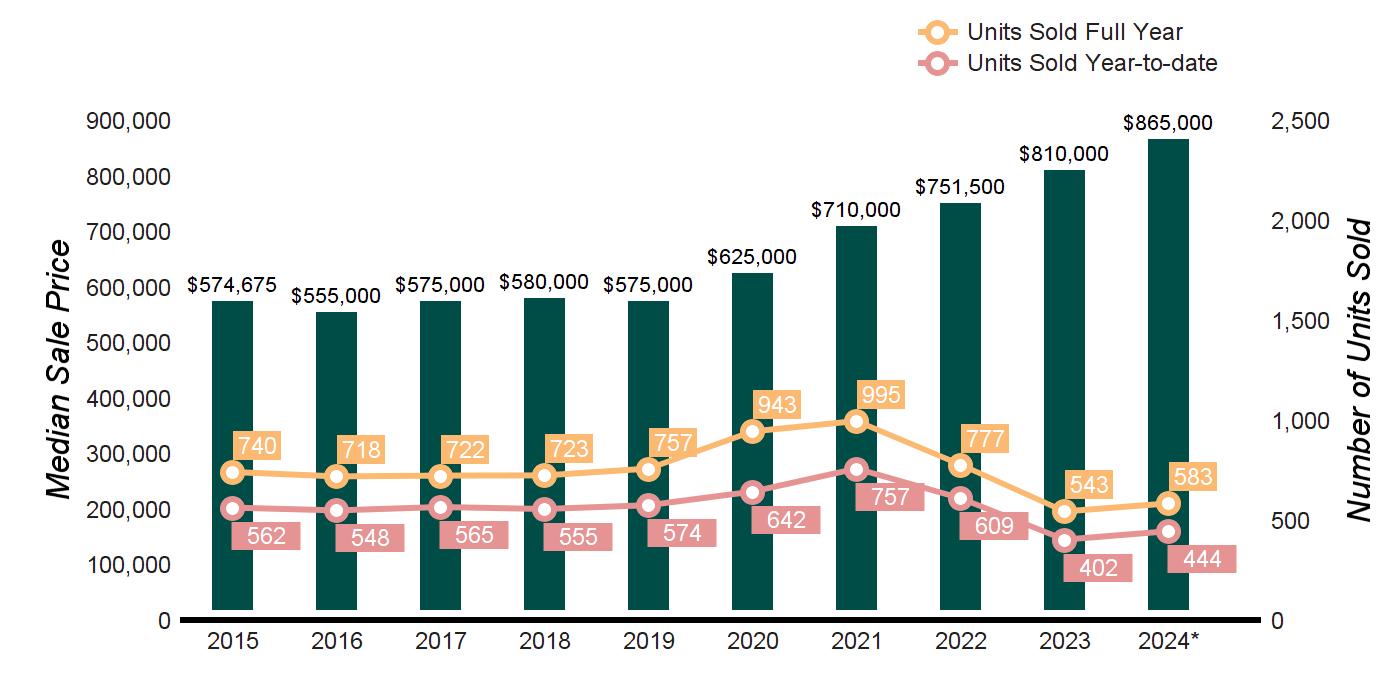
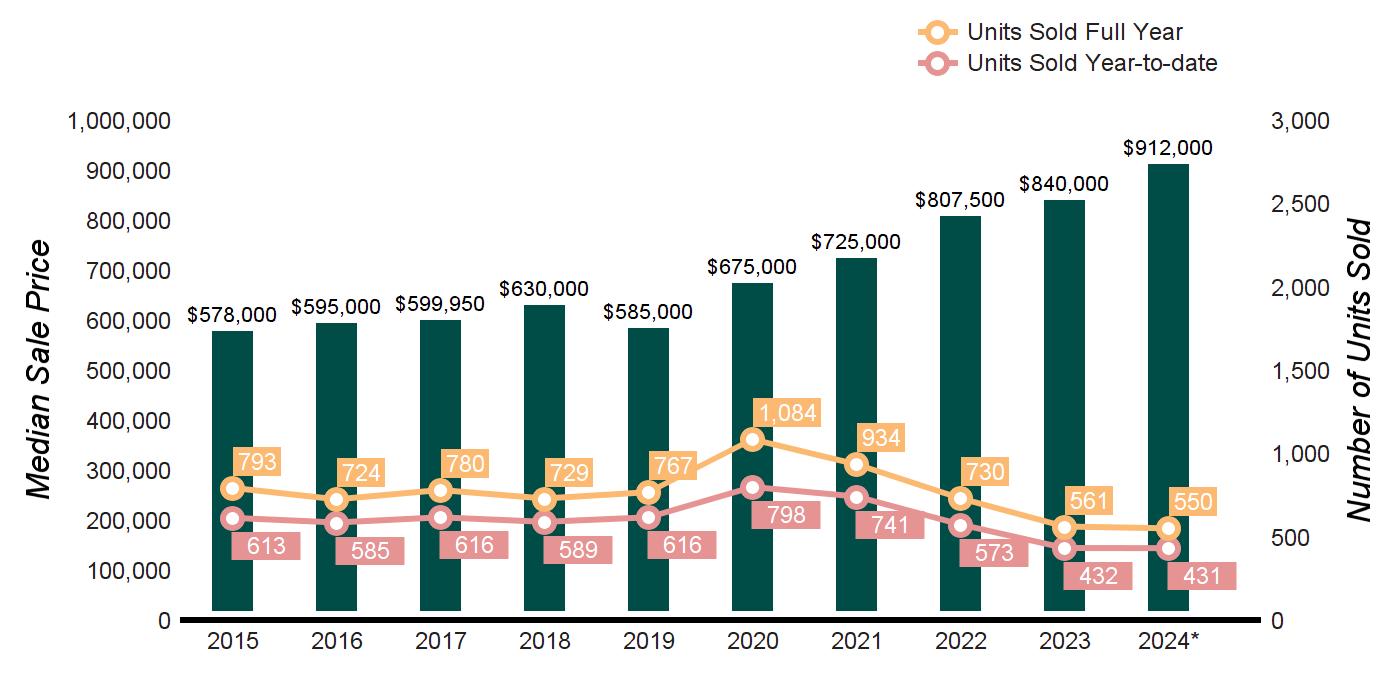
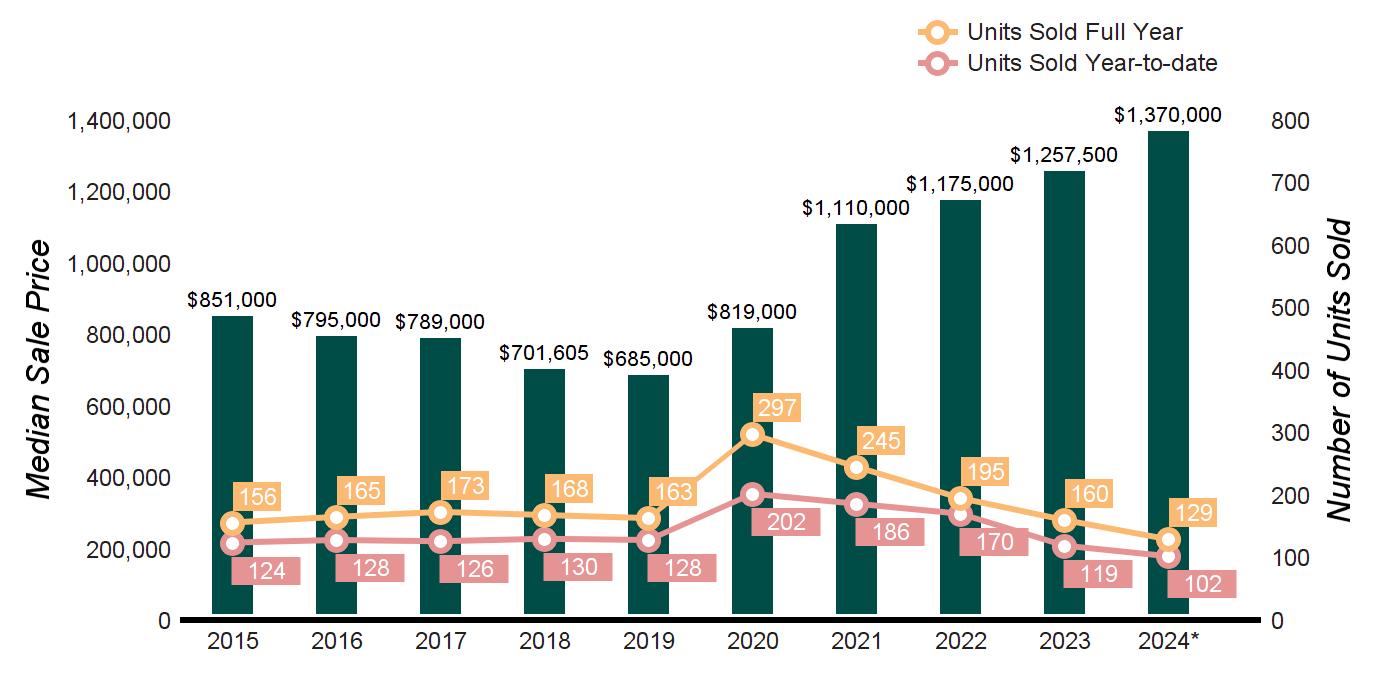
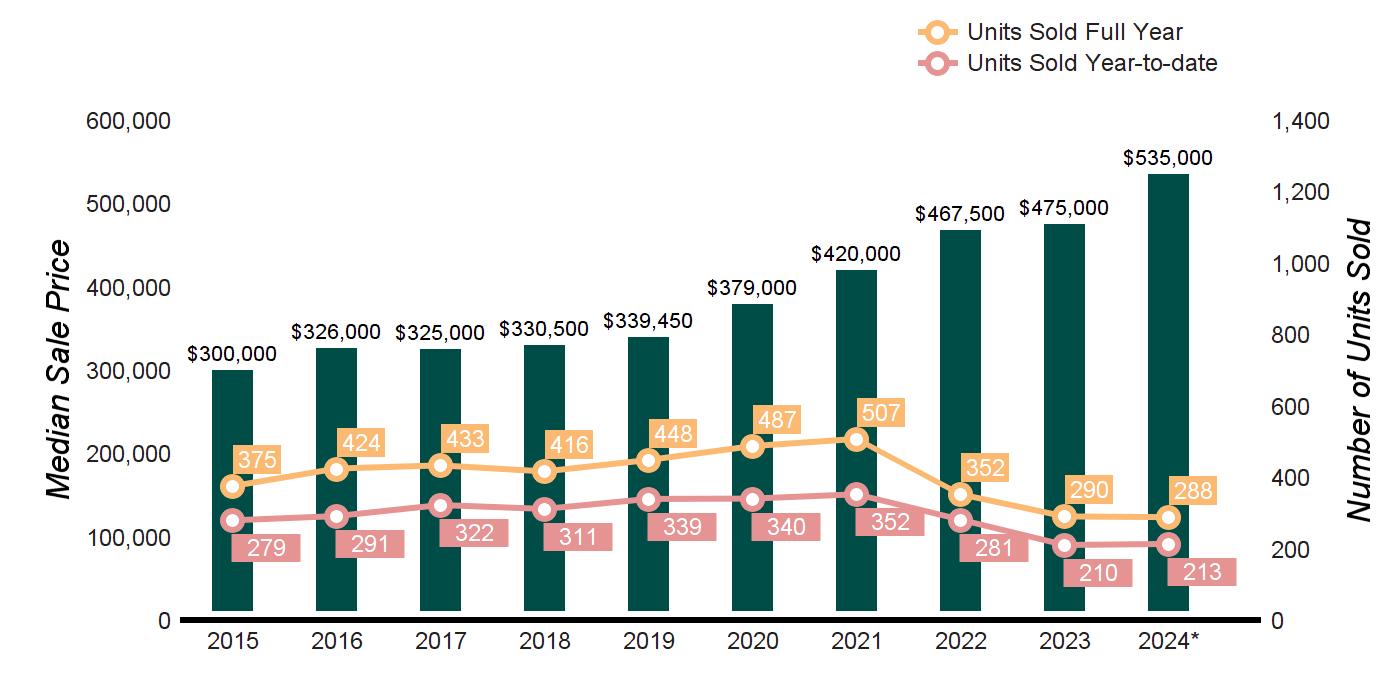
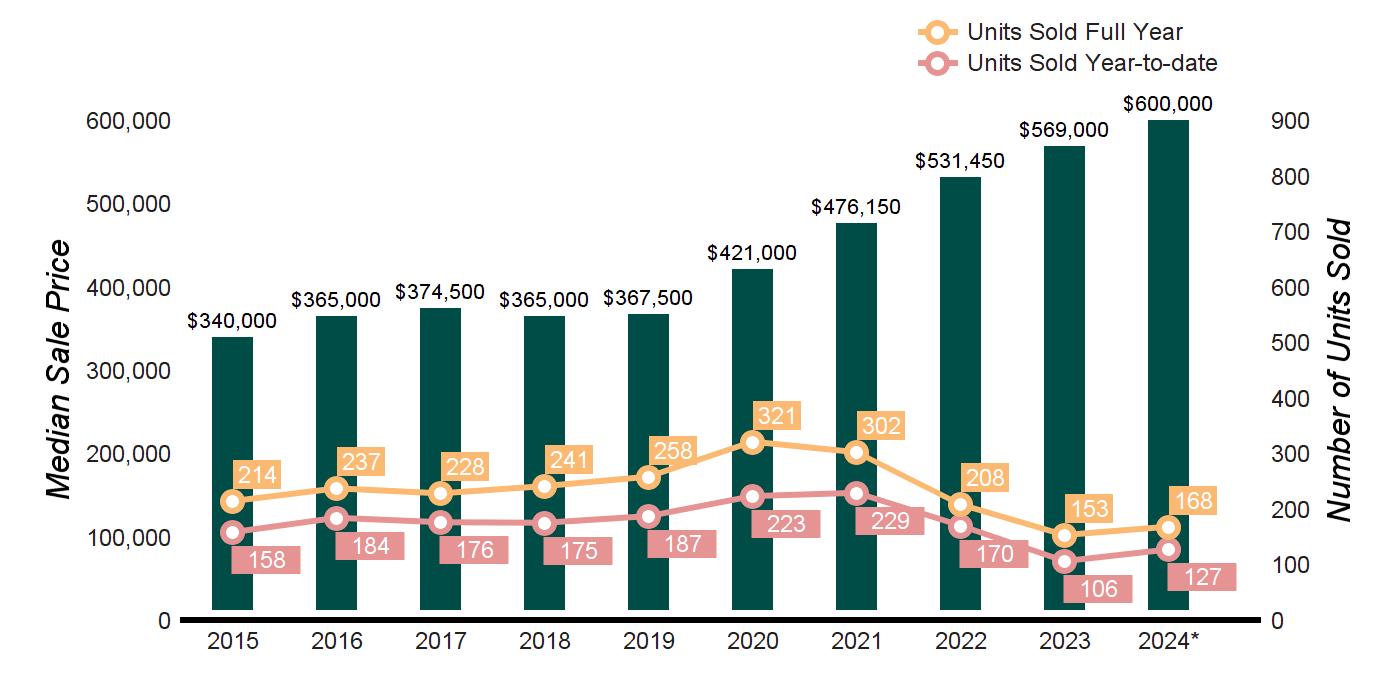
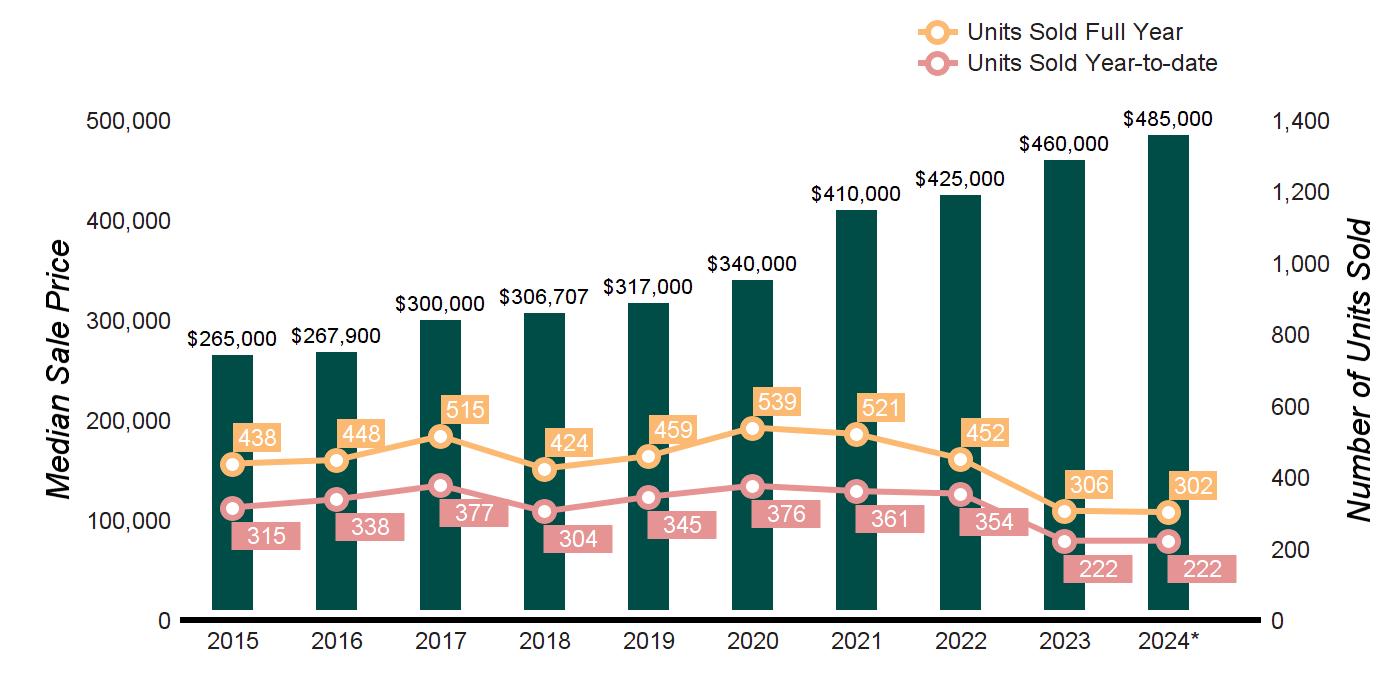
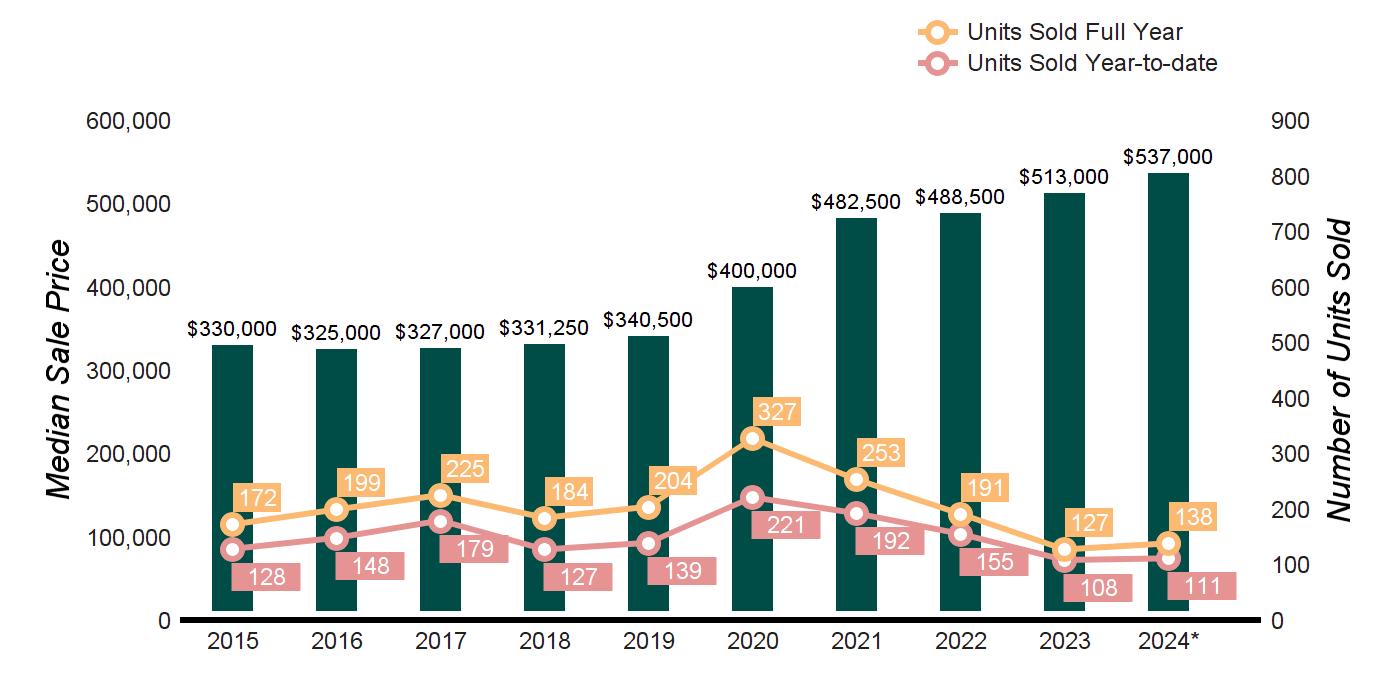
TEN-YEAR MARKET HISTORY
Source : Smart MLS, Single Family Homes * Homes sold for 2024are annualized based on the actual sales year-to-date
OF SEPTEMBER 30, 2024
$5,000,000 and up
Source : Smart MLS, Single Family Homes
OF SEPTEMBER 30, 2023
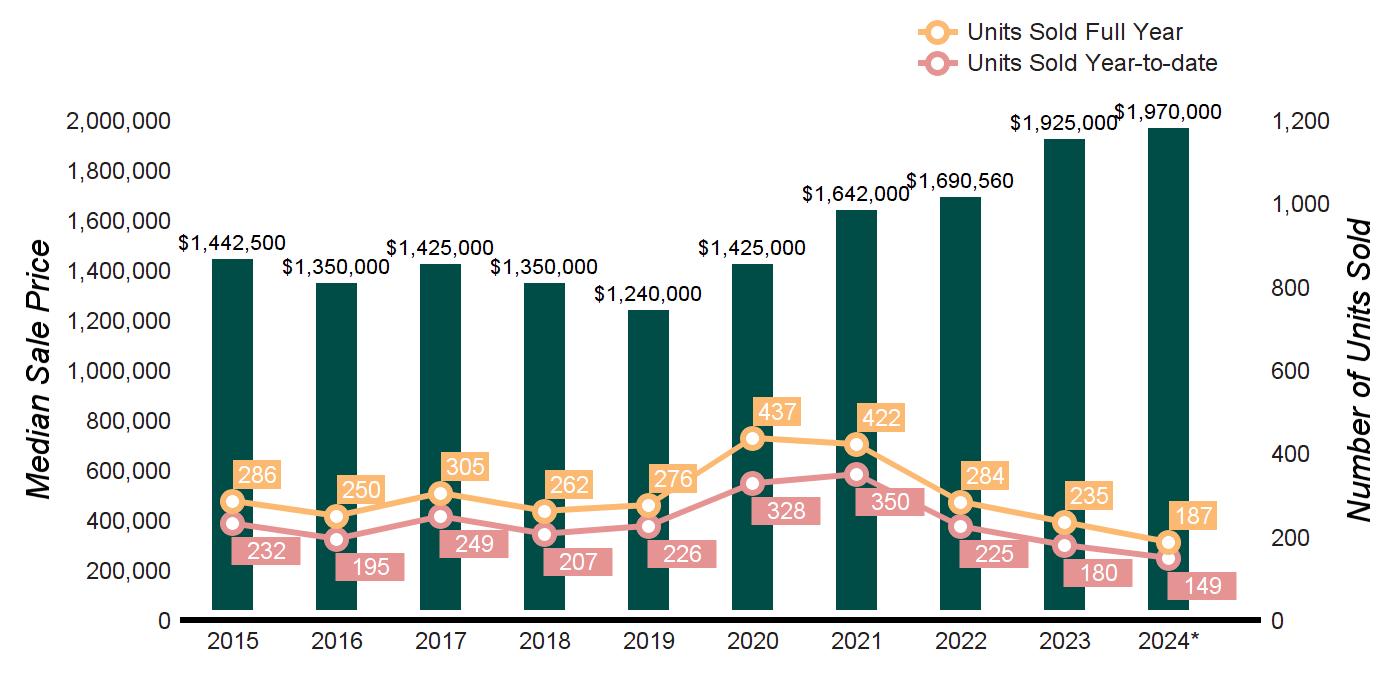
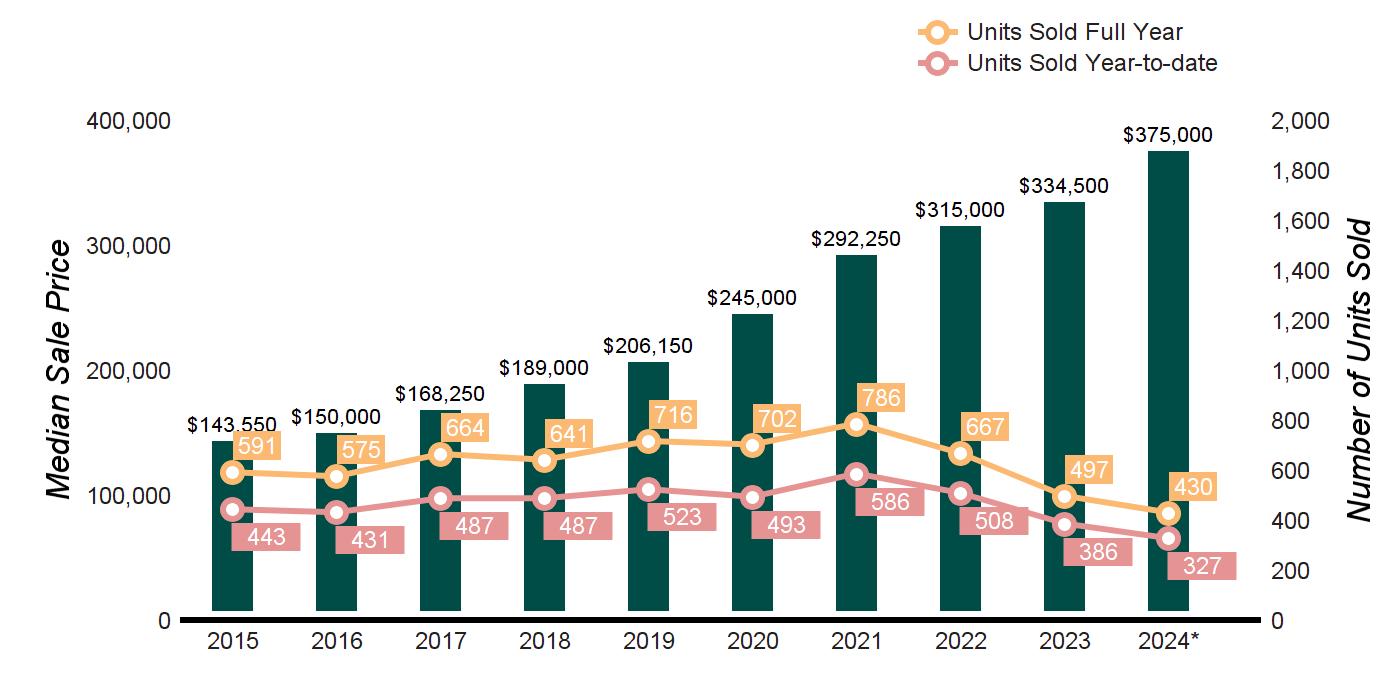
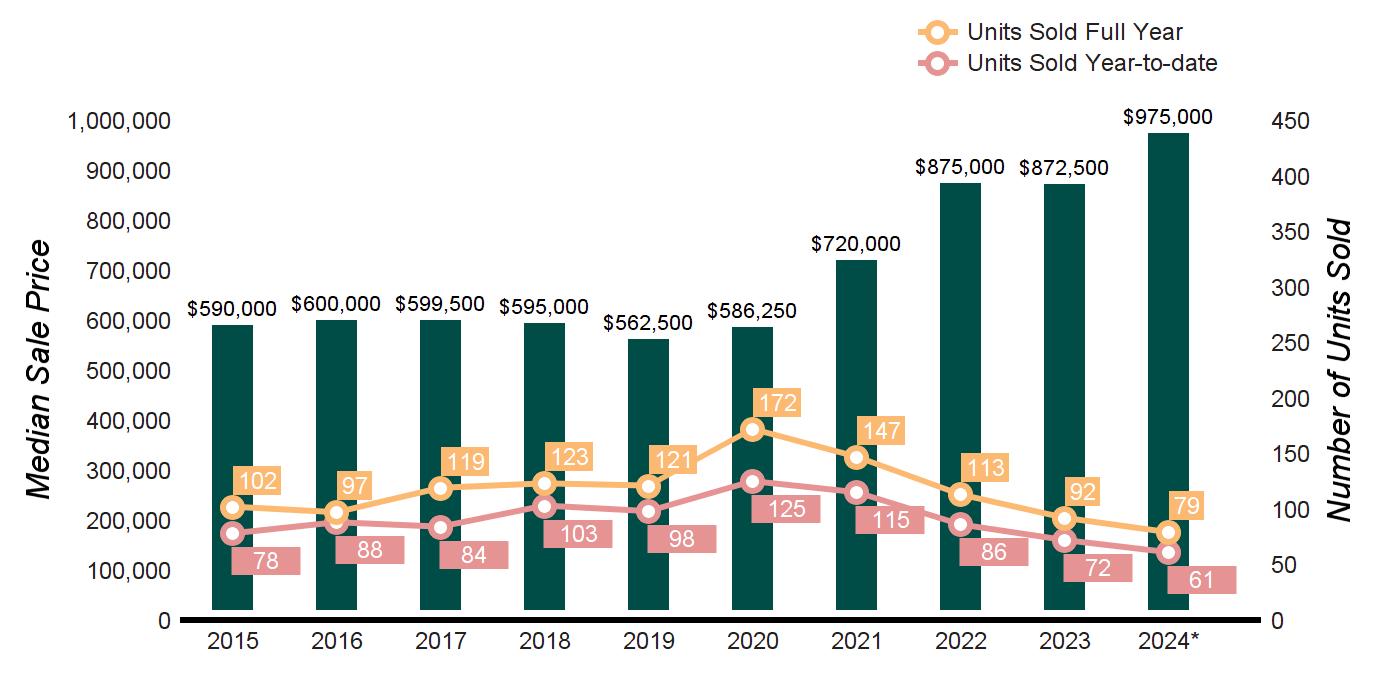
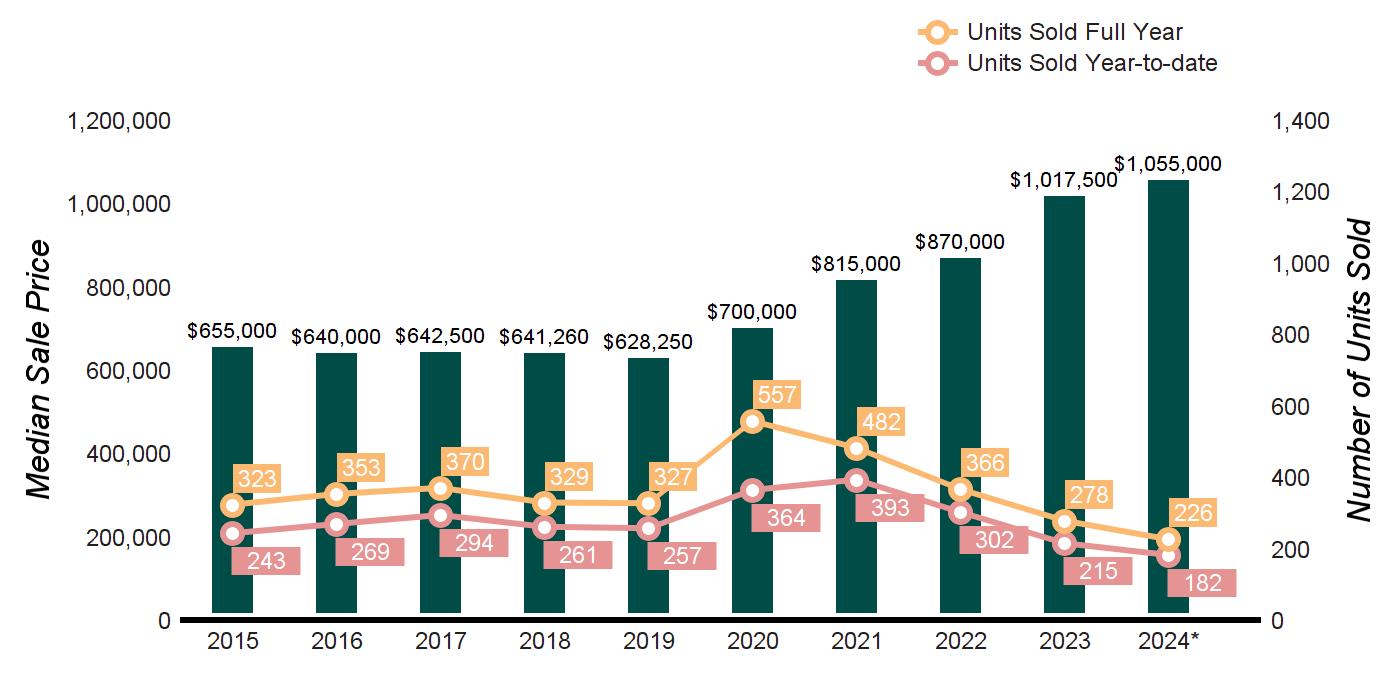
TEN-YEAR MARKET HISTORY
Source : Smart MLS, Single Family Homes * Homes sold for 2024are annualized based on the actual sales year-to-date
Source : Smart MLS, Single Family Homes

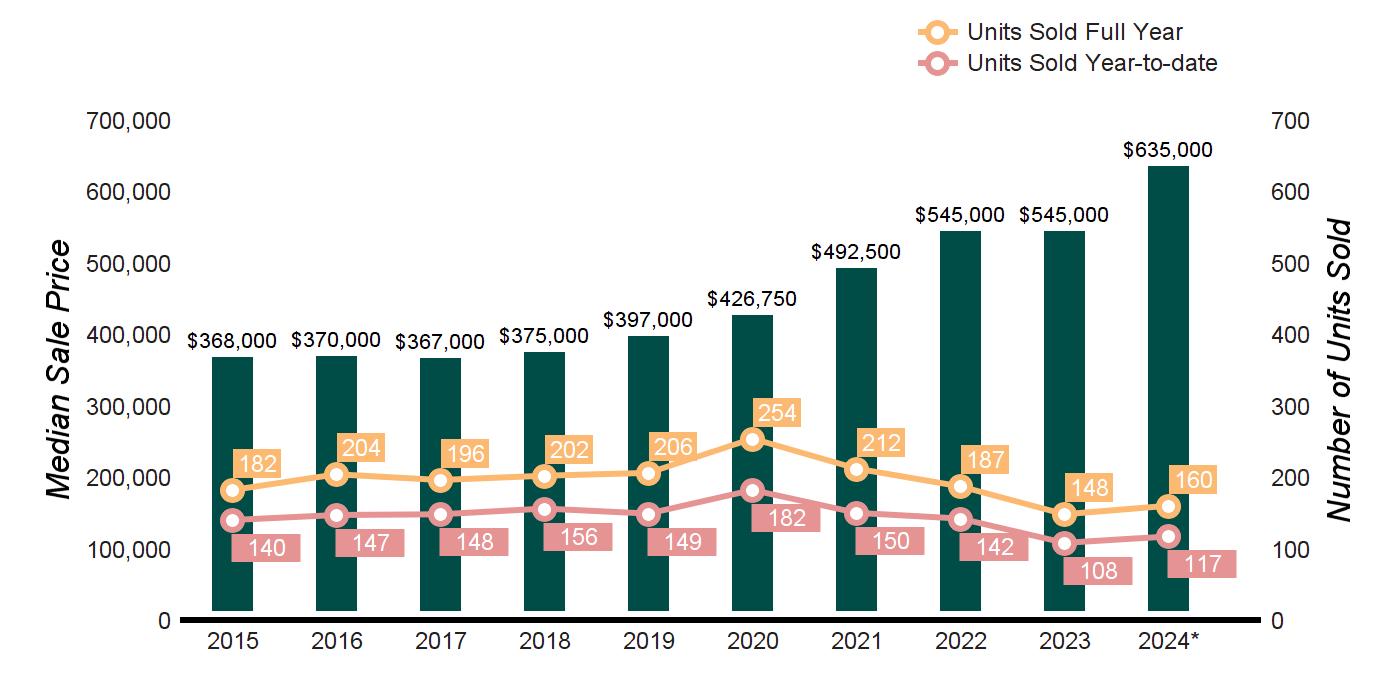
TEN-YEAR MARKET HISTORY
Source : Smart MLS, Single Family Homes
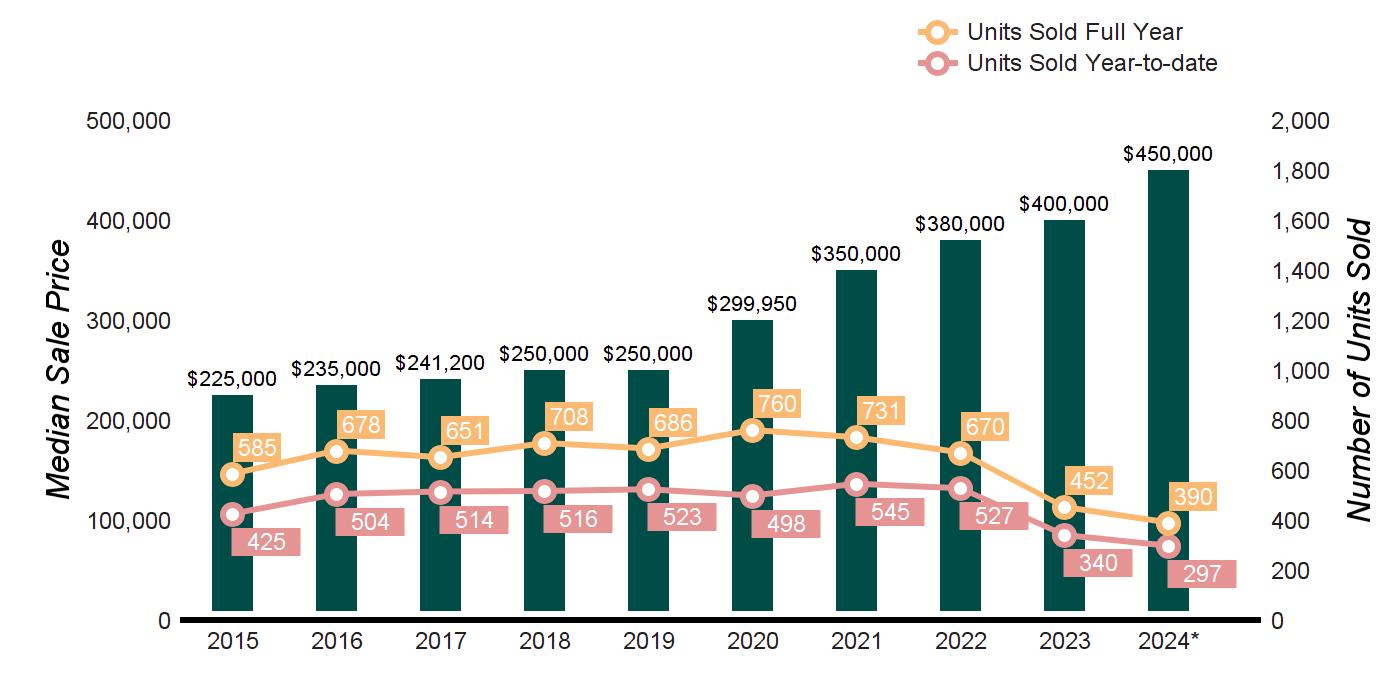
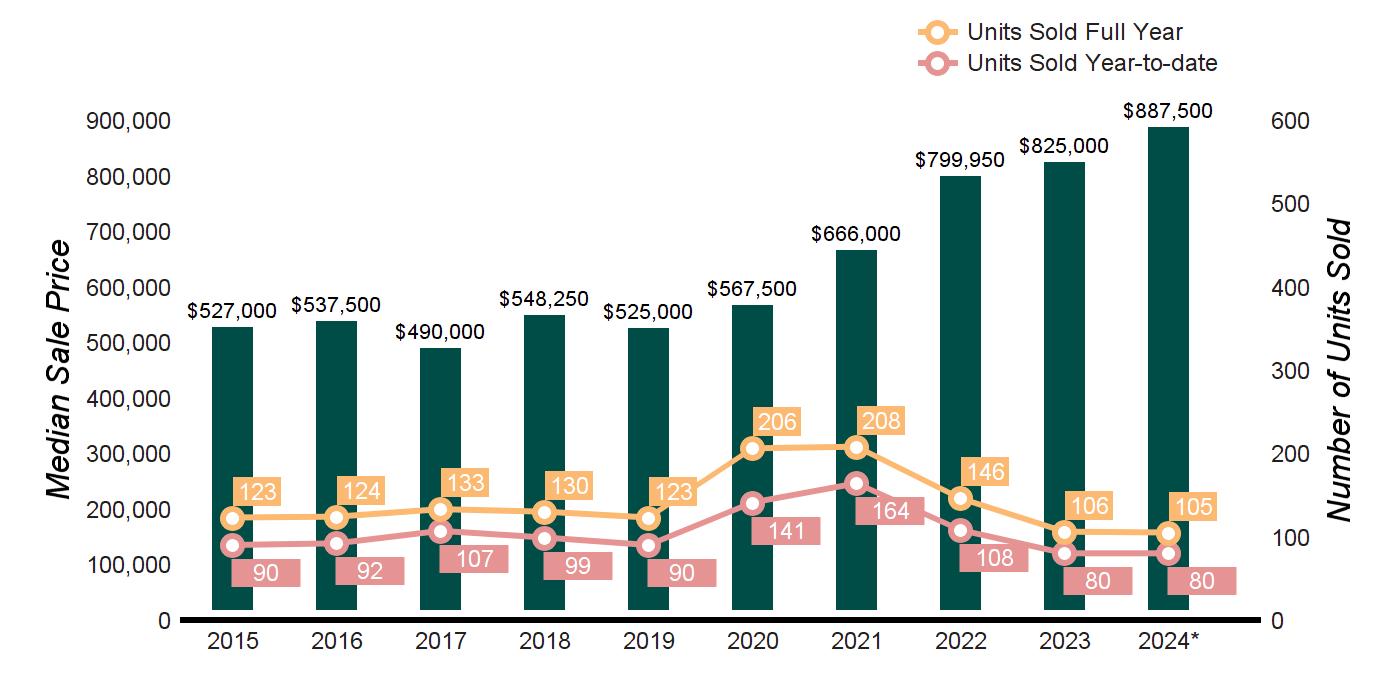
TEN-YEAR MARKET HISTORY
Source : Smart MLS, Single Family Homes * Homes sold for 2024are annualized based on the actual sales year-to-date
OF SEPTEMBER 30, 2024
$5,000,000 and up
Source : Smart MLS, Single Family Homes
OF SEPTEMBER 30, 2023

TEN-YEAR MARKET HISTORY
Source : Smart MLS, Single Family Homes

TEN-YEAR MARKET HISTORY
Source : Smart MLS, Single Family Homes

TEN-YEAR MARKET HISTORY
Source : Smart MLS, Single Family Homes

TEN-YEAR MARKET HISTORY
Source : Smart MLS, Single Family Homes * Homes sold for 2024are annualized based on the actual sales year-to-date
Source : Smart MLS, Single Family Homes
TEN-YEAR MARKET HISTORY
Source : Smart MLS, Single Family Homes * Homes sold for 2024are annualized based on the actual sales year-to-date
OF SEPTEMBER 30, 2024
Demand Ratio Key 1-4: High Demand 5-6: Balanced 7-9: Low
$3,000,000 - $4,999,999
$5,000,000 and up
Source : Smart MLS, Single Family Homes
OF SEPTEMBER 30, 2023

TEN-YEAR MARKET HISTORY
Source : Smart MLS, Single Family Homes
AS OF SEPTEMBER 30, 2024
$5,000,000 and up
Source : Smart MLS, Single Family Homes
OF SEPTEMBER 30, 2023

TEN-YEAR MARKET HISTORY
Source : Smart MLS, Single Family Homes

TEN-YEAR MARKET HISTORY
Source : Smart MLS, Single Family Homes

TEN-YEAR MARKET HISTORY
Source : Smart MLS, Single Family Homes
Homes sold for 2024are annualized based on the actual sales year-to-date
OF SEPTEMBER 30, 2024
$5,000,000 and up
Source : Smart MLS, Single Family Homes
OF SEPTEMBER 30, 2023

TEN-YEAR MARKET HISTORY
Source : Smart MLS, Single Family Homes * Homes sold for 2024are annualized based on the actual sales year-to-date
OF SEPTEMBER 30, 2024
Source : Smart MLS, Single Family Homes
OF SEPTEMBER 30, 2023

TEN-YEAR MARKET HISTORY
Source : Smart MLS, Single Family Homes
TEN-YEAR MARKET HISTORY
Source : Smart MLS, Single Family Homes
TEN-YEAR MARKET HISTORY
Source : Smart MLS, Single Family Homes

TEN-YEAR MARKET HISTORY
Source : Smart MLS, Single Family Homes

TEN-YEAR MARKET HISTORY
Source : Smart MLS, Single Family Homes

TEN-YEAR MARKET HISTORY
$5,000,000 and up
Source : Smart MLS, Single Family Homes

TEN-YEAR MARKET HISTORY
OF SEPTEMBER 30, 2024
Source : Smart MLS, Single Family Homes
OF SEPTEMBER 30, 2023

3 GLOBAL NETWORKS - REACHING 56 COUNTRIES & 6 CONTINENTS
Leading Real Estate Companies of the World | Luxury Portfolio International Board of Regents Luxury Real Estate