Global Burden of Disease 2021
Findings from the GBD 2021 Study


Findings from the GBD 2021 Study
INSTITUTE FOR HEALTH METRICS AND EVALUATION
UNIVERSITY OF WASHINGTON
This booklet was prepared by the Institute for Health Metrics and Evaluation (IHME) through core funding from the Gates Foundation. The views expressed are those of the authors. The contents of this publication may be reproduced and redistributed in whole or in part, provided the intended use is for noncommercial purposes, the contents are not altered, and full acknowledgment is given to IHME.
This work is licensed under the Creative Commons Attribution-NonCommercial-NoDerivs 4.0 Unported License. To view a copy of this license, please visit https://creativecommons.org/licenses/by-nc-nd/4.0/ For any usage that falls outside of these license restrictions, please contact IHME Global Engagement at engage@healthdata.org
Citation: Institute for Health Metrics and Evaluation (IHME). Global Burden of Disease 2021: Findings from the GBD 2021 Study. Seattle, WA: IHME, 2024.
Institute for Health Metrics and Evaluation
3980 15th Ave NE Seattle WA 98195
USA
www.healthdata.org
© 2024 Institute for Health Metrics and Evaluation
To request copies of this report, please contact IHME:
Telephone: +1-206-897-2800
Fax: +1-206-897-2899
Email: engage@healthdata.org
the global burden of diseases, injuries, and risk factors study (gbd) 2021 examines health trends worldwide. The study, which leverages 328,938 data sources, reveals health disparities across age, sex, location, and socioeconomic groups, emphasizing the impact of the COVID-19 pandemic alongside other health challenges.
A worrisome finding is the staggering global reduction in life expectancy by 1.6 years between 2019 and 2021 due to the COVID-19 pandemic, with the most significant decreases seen in subnational locations such as Mexico City, KwaZulu-Natal and Limpopo provinces in South Africa, and countries including Peru and Bolivia. Despite the devastating impact of the pandemic, the long-term view shows sustained global progress in reducing mortality worldwide, with life expectancy increasing by 22.7 years from 1950 to 2021. However, the COVID-19 pandemic underscores the fragility of health gains and highlights the need for continued vigilance and preparedness.
The study also explores demographic trends, including the global fertility transition leading to most countries reaching below-replacement fertility levels by 2100, or fewer than 2.1 children per person who could give birth, raising concerns about population aging and the need for ethical immigration policies and protection for reproductive health rights. Additionally, GBD 2021 examines the burden of non-communicable diseases and the contribution of risk factors such as high blood sugar, drug use, and obesity on health outcomes.
Despite the challenges presented by current global threats, including antimicrobial resistance and climate change, the GBD 2021 study offers a cautiously optimistic outlook for the future of global health, advocating for evidence-based strategies to mitigate risks and enhance health outcomes. It predicts that global life expectancy will increase by 4.6 years in roughly three decades. Forecasts up to 2050 suggest the potential for even greater health improvements if key risk factors – notably exposure to particulate matter air pollution and high blood sugar, high body mass index, and other risks related to obesity and metabolic syndrome – are addressed equitably, across all peoples and places.
Disability-adjusted life years (DALYs)
Healthy life expectancy (HALE)
Life expectancy
Replacement rate
Risk factors
Socio-demographic Index (SDI)
Super-regions
Total fertility rate
Under-5 mortality
Years lived with disability (YLDs)
Years of life lost (YLLs)
Years of healthy life lost to premature death and disability. DALYs are the sum of years of life lost (YLLs) and years lived with disability (YLDs).
The number of years that a person at a given age can expect to live in good health, taking into account mortality and disability.
Number of years a person is expected to live based on their present age. For GBD, the life expectancy for an age group (e.g., 50- to 54-year-olds), is determined from the first year in the age range.
The total fertility rate at which a population replaces itself from generation to generation, assuming no migration, or approximately 2.1 live births per woman.
Potentially modifiable causes of disease and injury.
A summary measure that identifies where countries or other geographic areas sit on the spectrum of development. Expressed on a scale of 0 to 1, SDI is a composite average of the rankings of the incomes per capita, average educational attainment, and fertility rates of all areas in the GBD study.
Seven world regions whose constituent countries are grouped on the basis of cause of death patterns:
• Central Europe, Eastern Europe, and Central Asia
• High-income
• Latin America and the Caribbean
• North Africa and the Middle East
• South Asia
• Southeast Asia, East Asia, and Oceania
• Sub-Saharan Africa
The average number of children a woman would bear if she survived through the end of the reproductive age span (age 10 to 54 years) and experienced at each age a particular set of age-specific fertility rates observed in the year of interest.
The probability (expressed as the rate per 1,000 live births) that children born alive will die before reaching the age of 5 years.
Years of life lived with any short-term or long-term health loss.
Years of life lost due to premature mortality.
New details about locations hit hard by the COVID-19 pandemic: Mexico City, KwaZulu-Natal and Limpopo provinces in South Africa, Peru, and Bolivia.
The COVID-19 pandemic caused the most severe drops in life expectancy seen in 50+ years.
Encouragingly, child mortality continued to drop during the pandemic.
Rates of population growth are declining in most countries.
First GBD update to examine the COVID-19 pandemic.
Incorporated thousands of new data points from sources including vital registration systems, sample vital registration systems, censuses, and surveys.
Used improved methods.
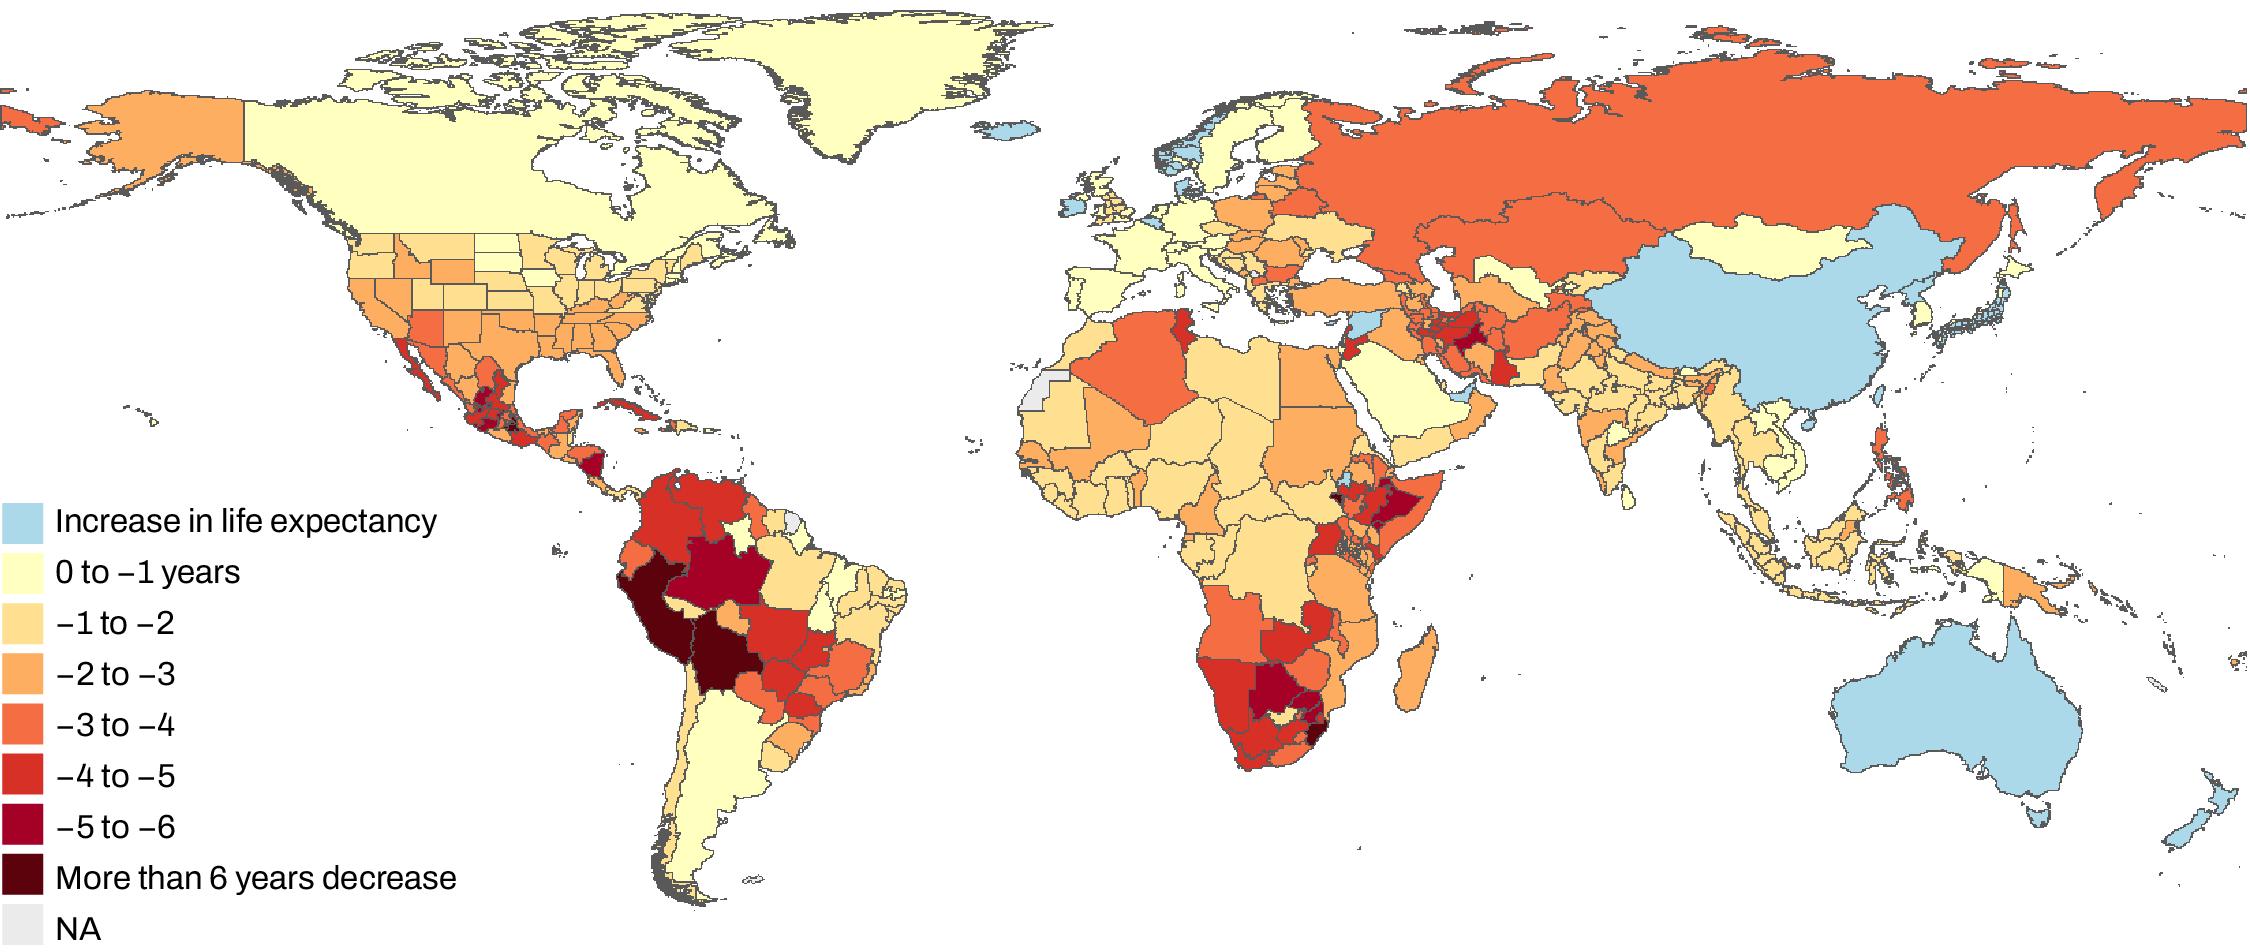
Life expectancy declined in 84% of countries and territories during the COVID-19 pandemic.
Change in life expectancy amid the COVID-19 pandemic, 2019–2021
While global mortality rates rose sharply amid the COVID-19 pandemic, child mortality continued to fall.
All-age mortality and mortality for children under age 5 globally, 1990–2021

Stark differences in the number of deaths that occur in children under 5 years persist between regions.
Proportion of child deaths by GBD super-region, 2021
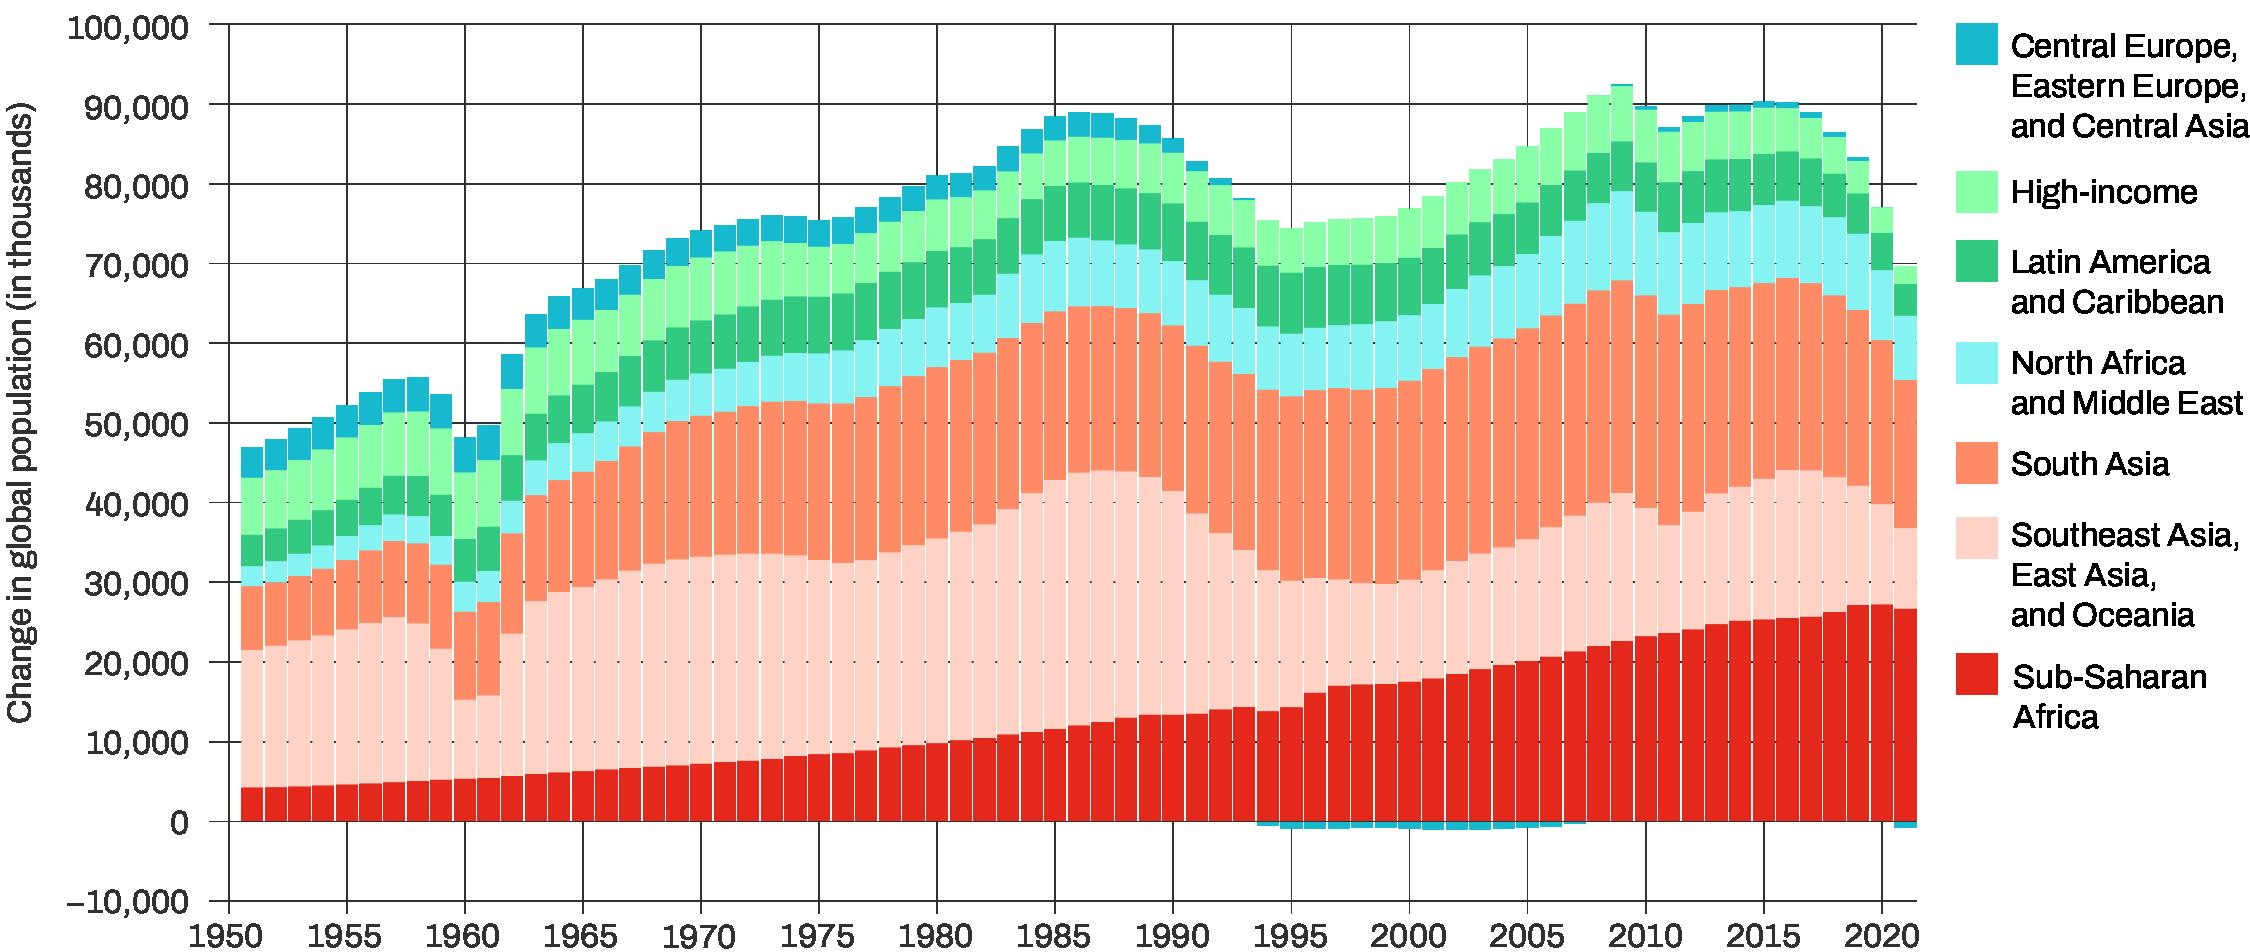
Population growth rates continued to decline during the COVID-19 pandemic.
Annual changes in the global population, 1950–2021
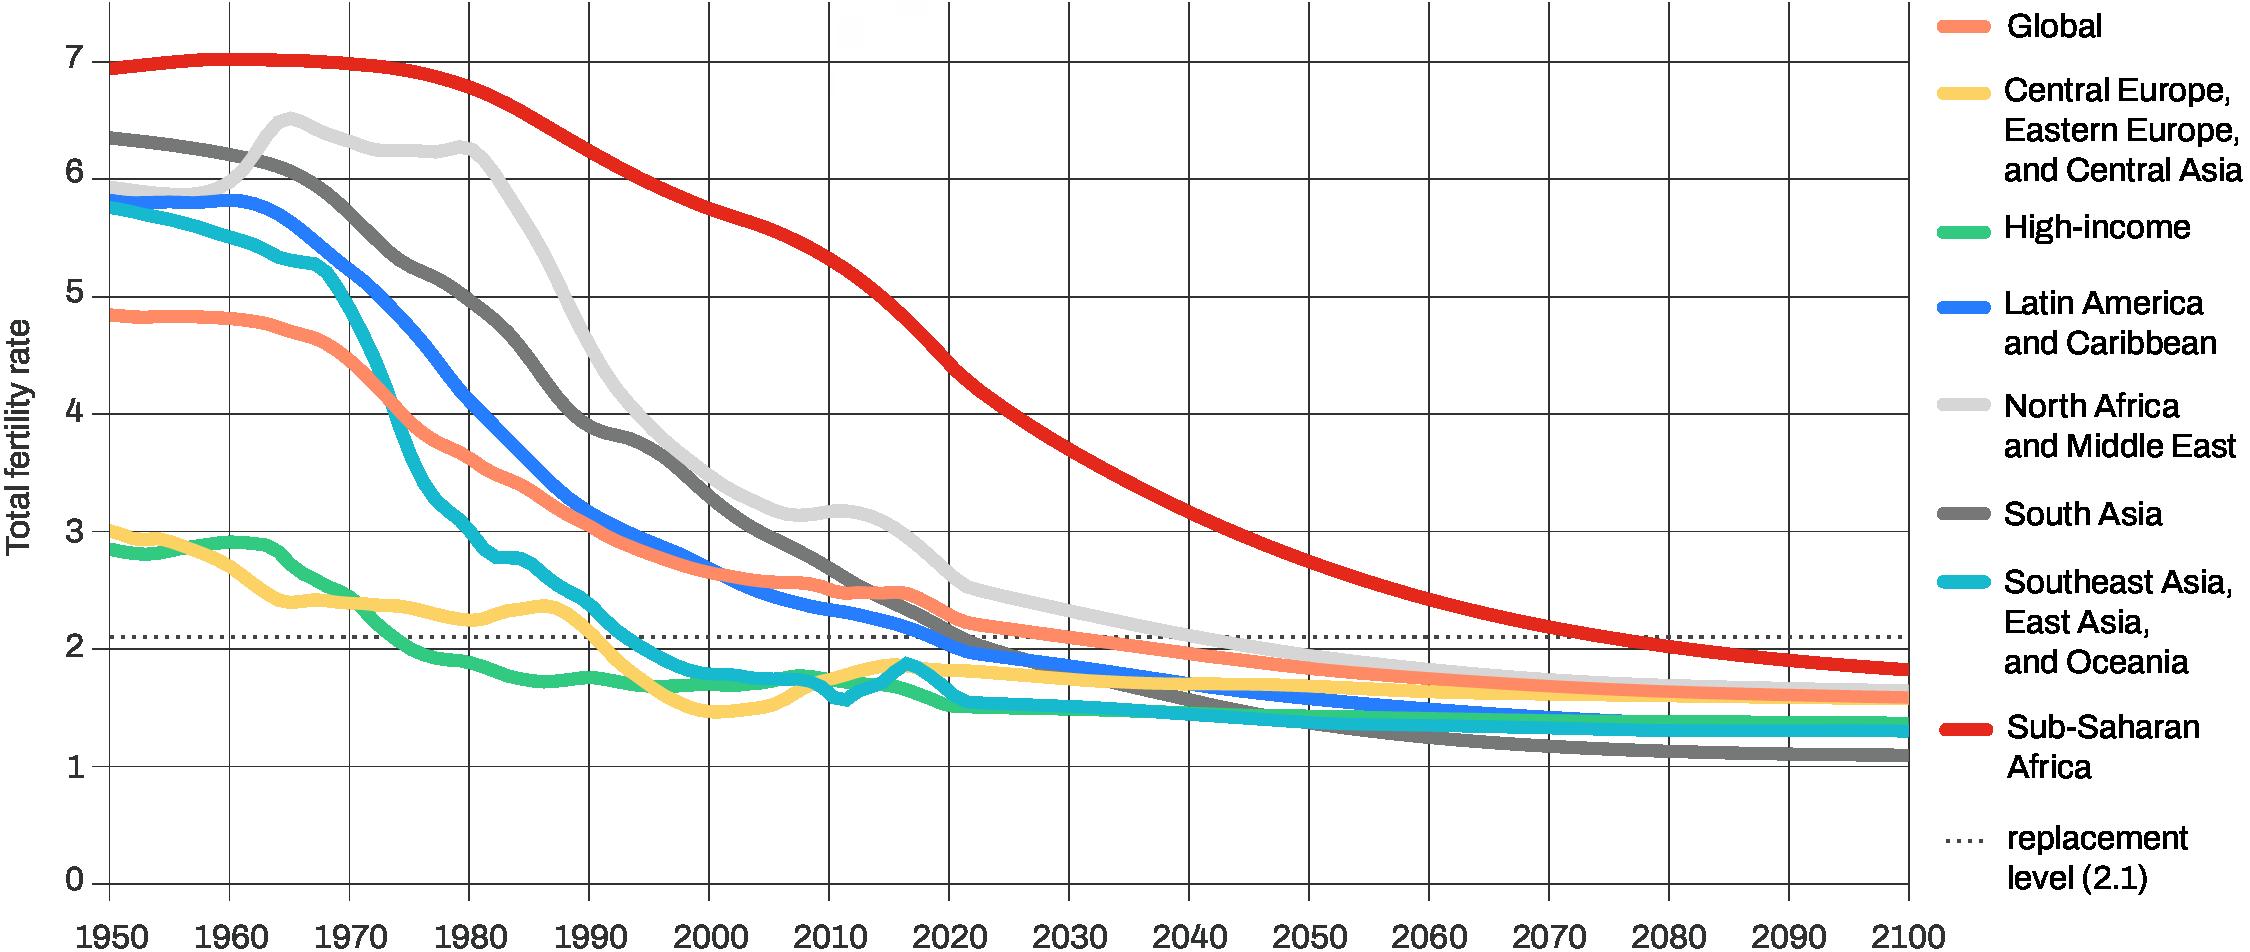
Most countries will experience below-replacement* levels of fertility by mid-century.
Researchers anticipate a massive shifting of births from high-income countries to low-income countries.
Unless countries facilitate ethical immigration, populations are expected to contract in areas where fertility is below 2.1 children per person who could give birth.
Increasing support for parents and caregivers could prevent ultra-low fertility.
Innovative, more accurate forecasting methods grounded in real-world evidence.
Study incorporated hundreds of new data points from surveys, censuses, and vital and sample registration.
Pro-natal alternative scenario for policymakers in countries with low fertility (see Table 2 in study for country results).
*Fertility below replacement levels is defined as fewer than 2.1 children per person who could give birth.
By 2100, fertility rates will not be high enough to sustain population growth over time in 97% of countries and territories.
Total fertility rate, 1950–2100, by GBD super-region and for the globe
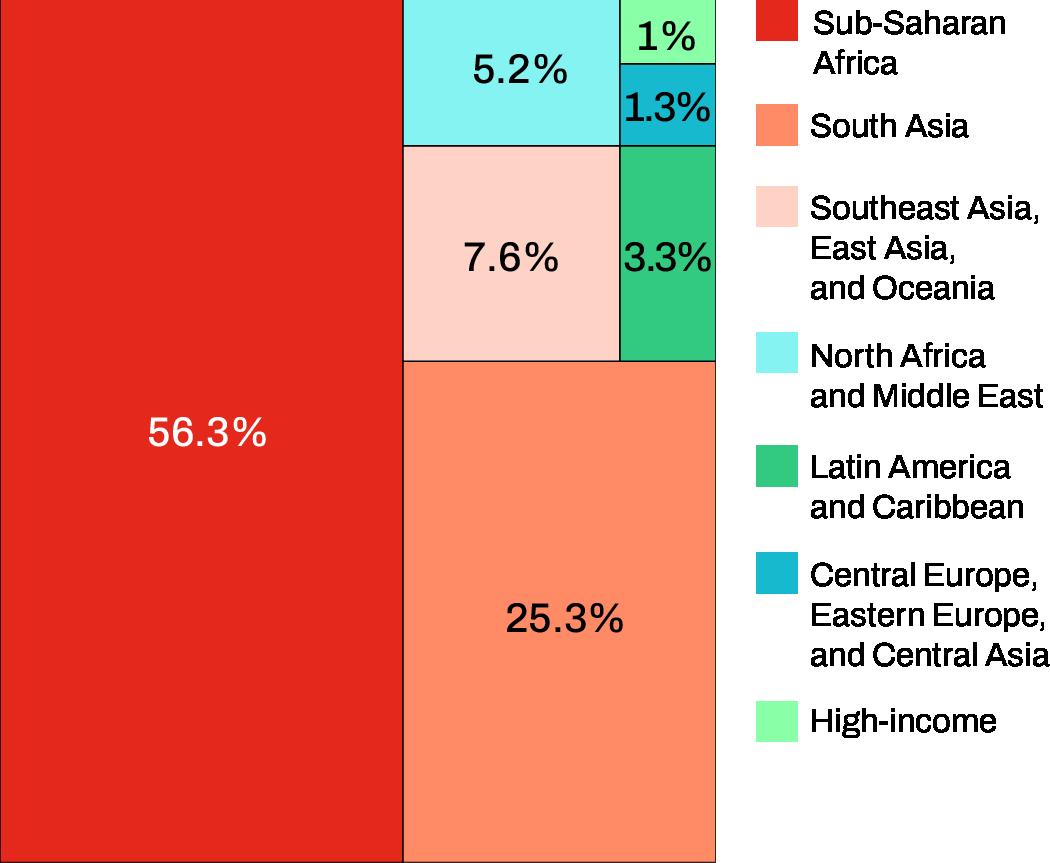
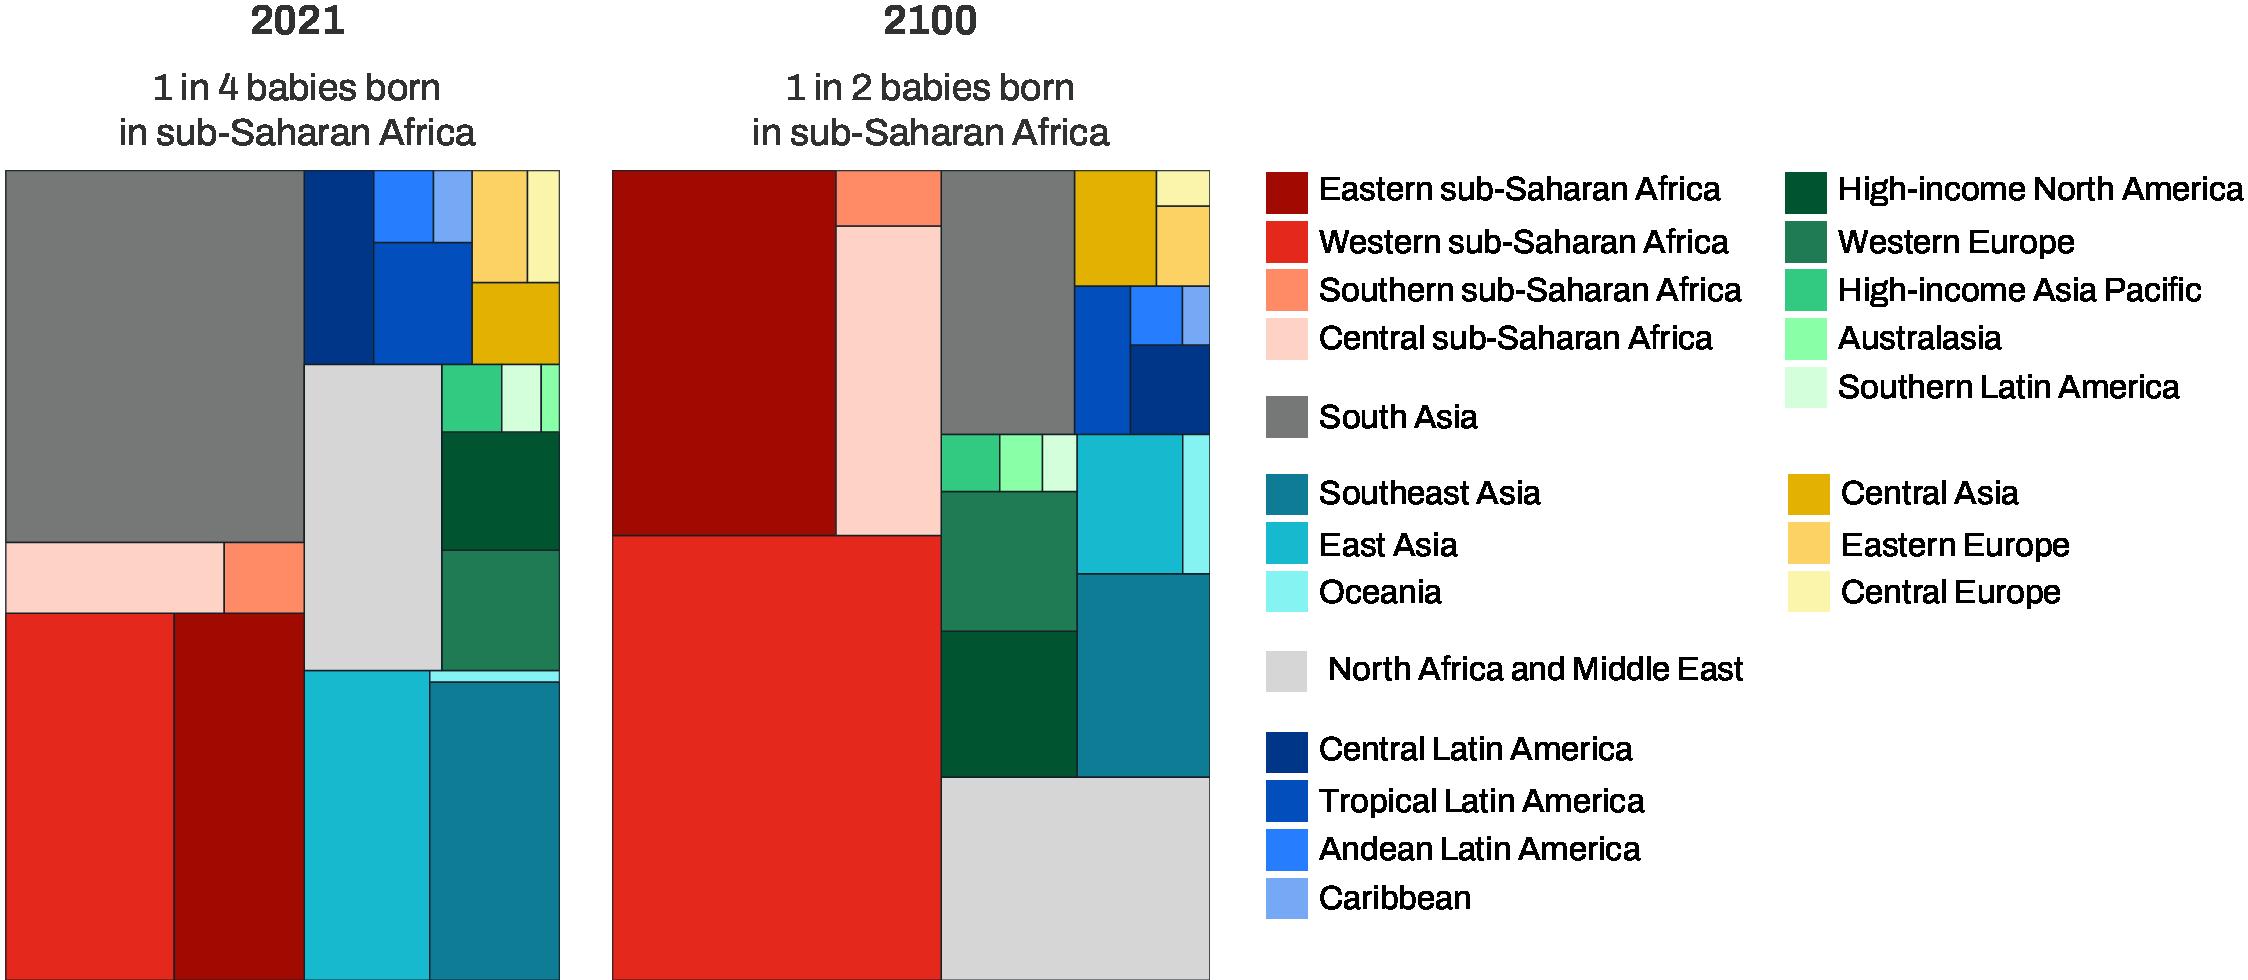
By 2100, more than half of all babies will be born in sub-Saharan Africa, primarily in Western and Eastern sub-Saharan Africa.
Proportion of births by GBD region in 2021 and 2100
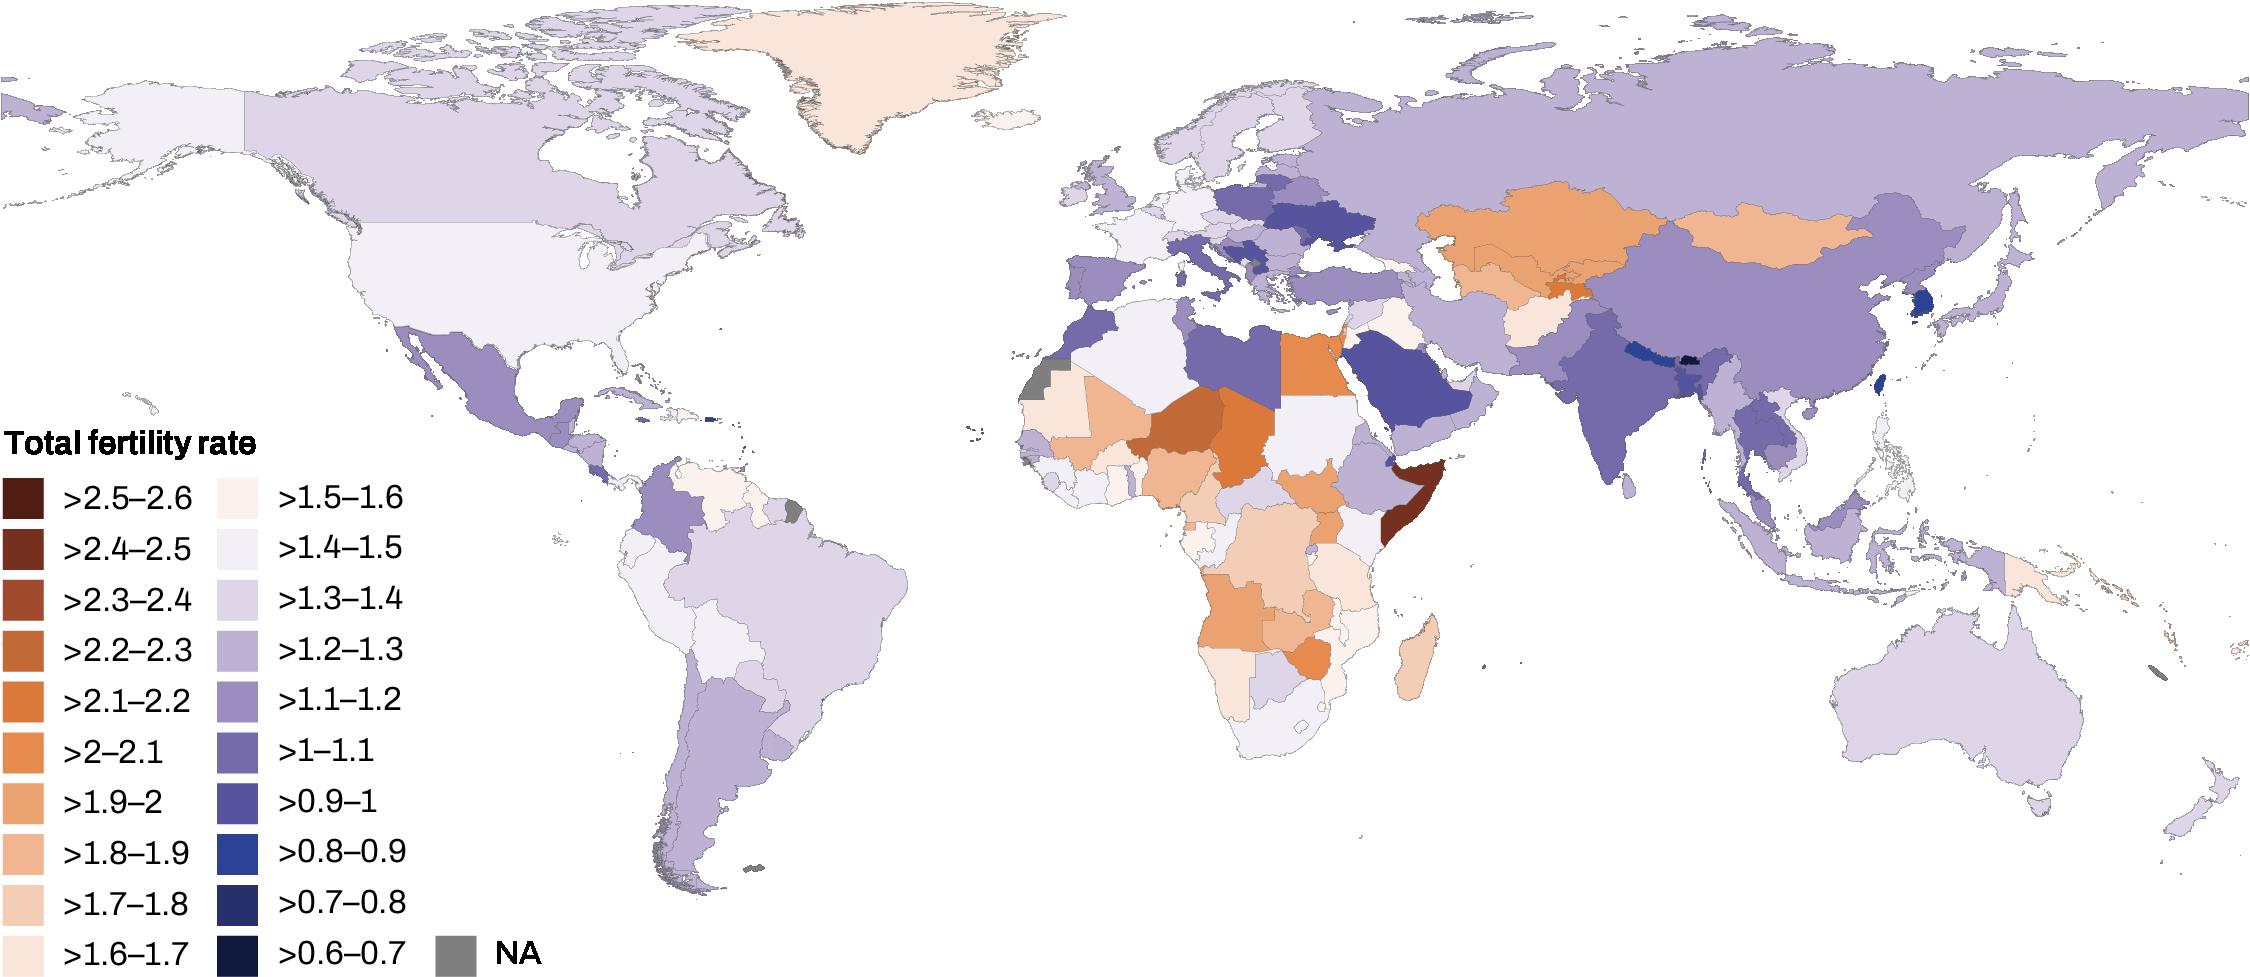
Only six countries are projected to experience fertility rates above replacement levels (2.1 children per person who could give birth) by 2100.
Projected fertility rates by country in 2100
Global life expectancy increased by 6.2 years since 1990, largely thanks to:
lower mortality rates for diarrhea and lower respiratory infections.
lower mortality rates in ages over 55 for stroke, cancers, and ischemic heart disease.
COVID-19 derailed health improvements in many locations.
Diabetes and kidney diseases are rising threats to health all over the world.
First study to compare deaths from COVID-19 to deaths from other causes globally.
Links specific causes of death to changes in life expectancy.
Utilized hundreds of new data sources and improved statistical methods.
Added 12 new causes of death and more detailed age groups.
Mortality from leading causes of death declined over the past 30 years, but COVID-19 radically altered these rankings.
Leading causes of death around the world in 1990, 2019, and 2021

† Uncertainty intervals are a range of values that are likely to include the correct estimate of health loss for a given cause.
* Chronic obstructive pulmonary disease
** Other pandemic-related mortality; includes excess mortality associated with the pandemic.
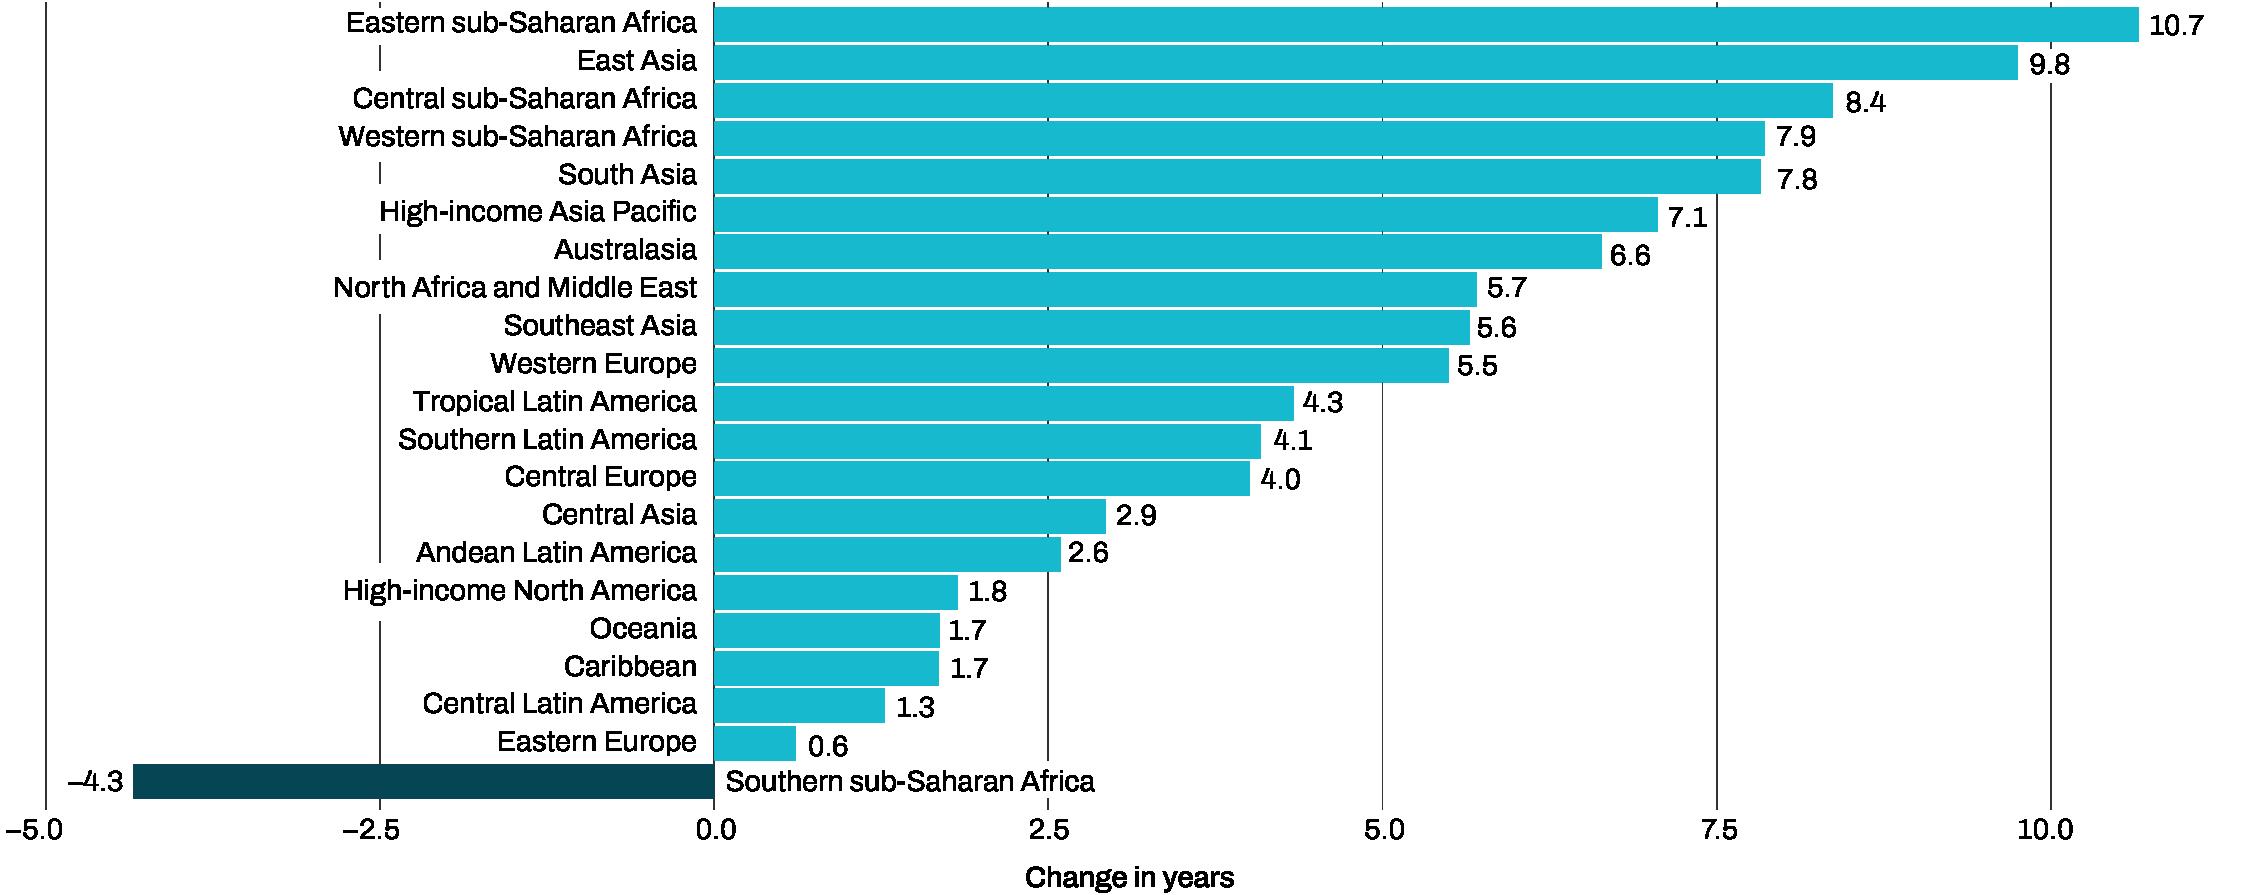
Eastern sub-Saharan Africa saw the largest increase in life expectancy among regions; the region’s biggest gains stemmed from efforts to combat combat diarrhea, tuberculosis, lower respiratory infections, HIV/AIDS, and measles.
Change in life expectancy by region, 1990–2021
The highest increases in global life expectancy have come from progress against enteric diseases, including diarrhea and typhoid. The largest decreases in life expectancy have come from COVID-19 and COVID-related causes.
Years of life expectancy gained or lost from leading causes of death globally, 1990–2021

* Other pandemic-related mortality includes excess mortality associated with the pandemic.
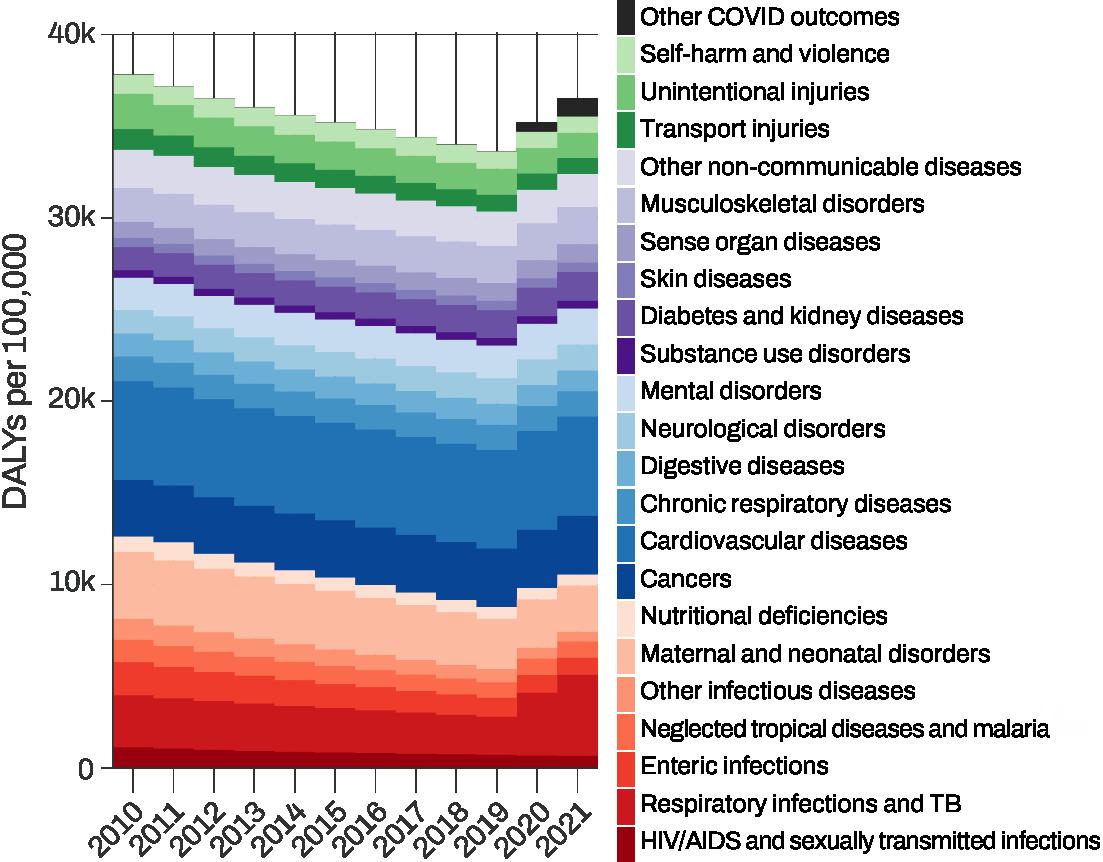
Since 2010, the world succeeded in:
Halving the burden of many diseases such as HIV/AIDS and diarrhea*
Slashing by a quarter the health loss from injuries*
The total rate of global disease burden dropped by 14.2% between 2010 and 2019, but the COVID-19 pandemic interrupted these downward trends.
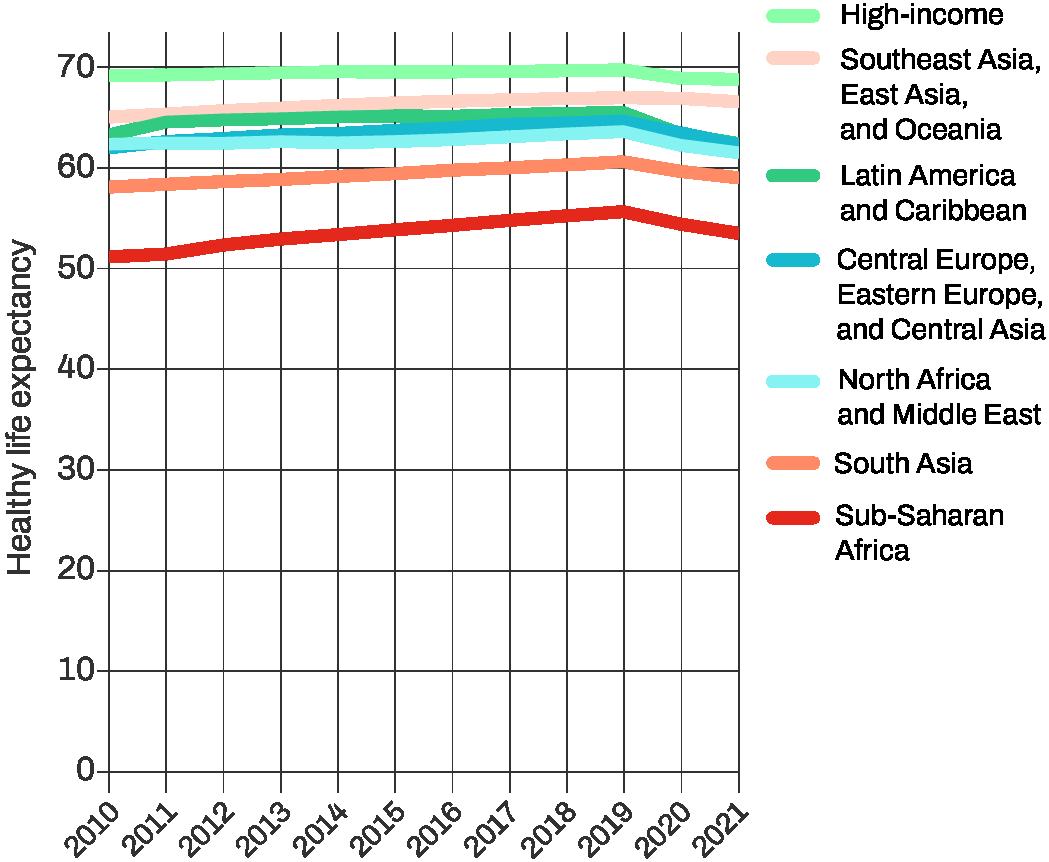
Healthy life expectancy rose significantly in 59 countries and territories between 2010 and 2021.
Diabetes experienced the most rapid growth among causes of health loss after adjusting for age and population size.
*After accounting for differences in age and population size across countries.
First study to measure premature death and disability due to the COVID-19 pandemic globally and compare it to other diseases and injuries.
Utilized thousands of new data sources and improved statistical methods.
Added 12 new causes of disease burden and more detailed age groups.
Added 12 new causes of death and more detailed age groups.
Among the top causes of disease burden globally, diarrheal diseases, congenital birth defects, and HIV/AIDS dropped the most in the rankings between 2010 and 2021. COVID-19 was the single leading cause of disease burden in 2021.
† Uncertainty intervals are a range of values that are likely to include the correct estimate of health loss for a given cause.
* Chronic obstructive pulmonary disease.
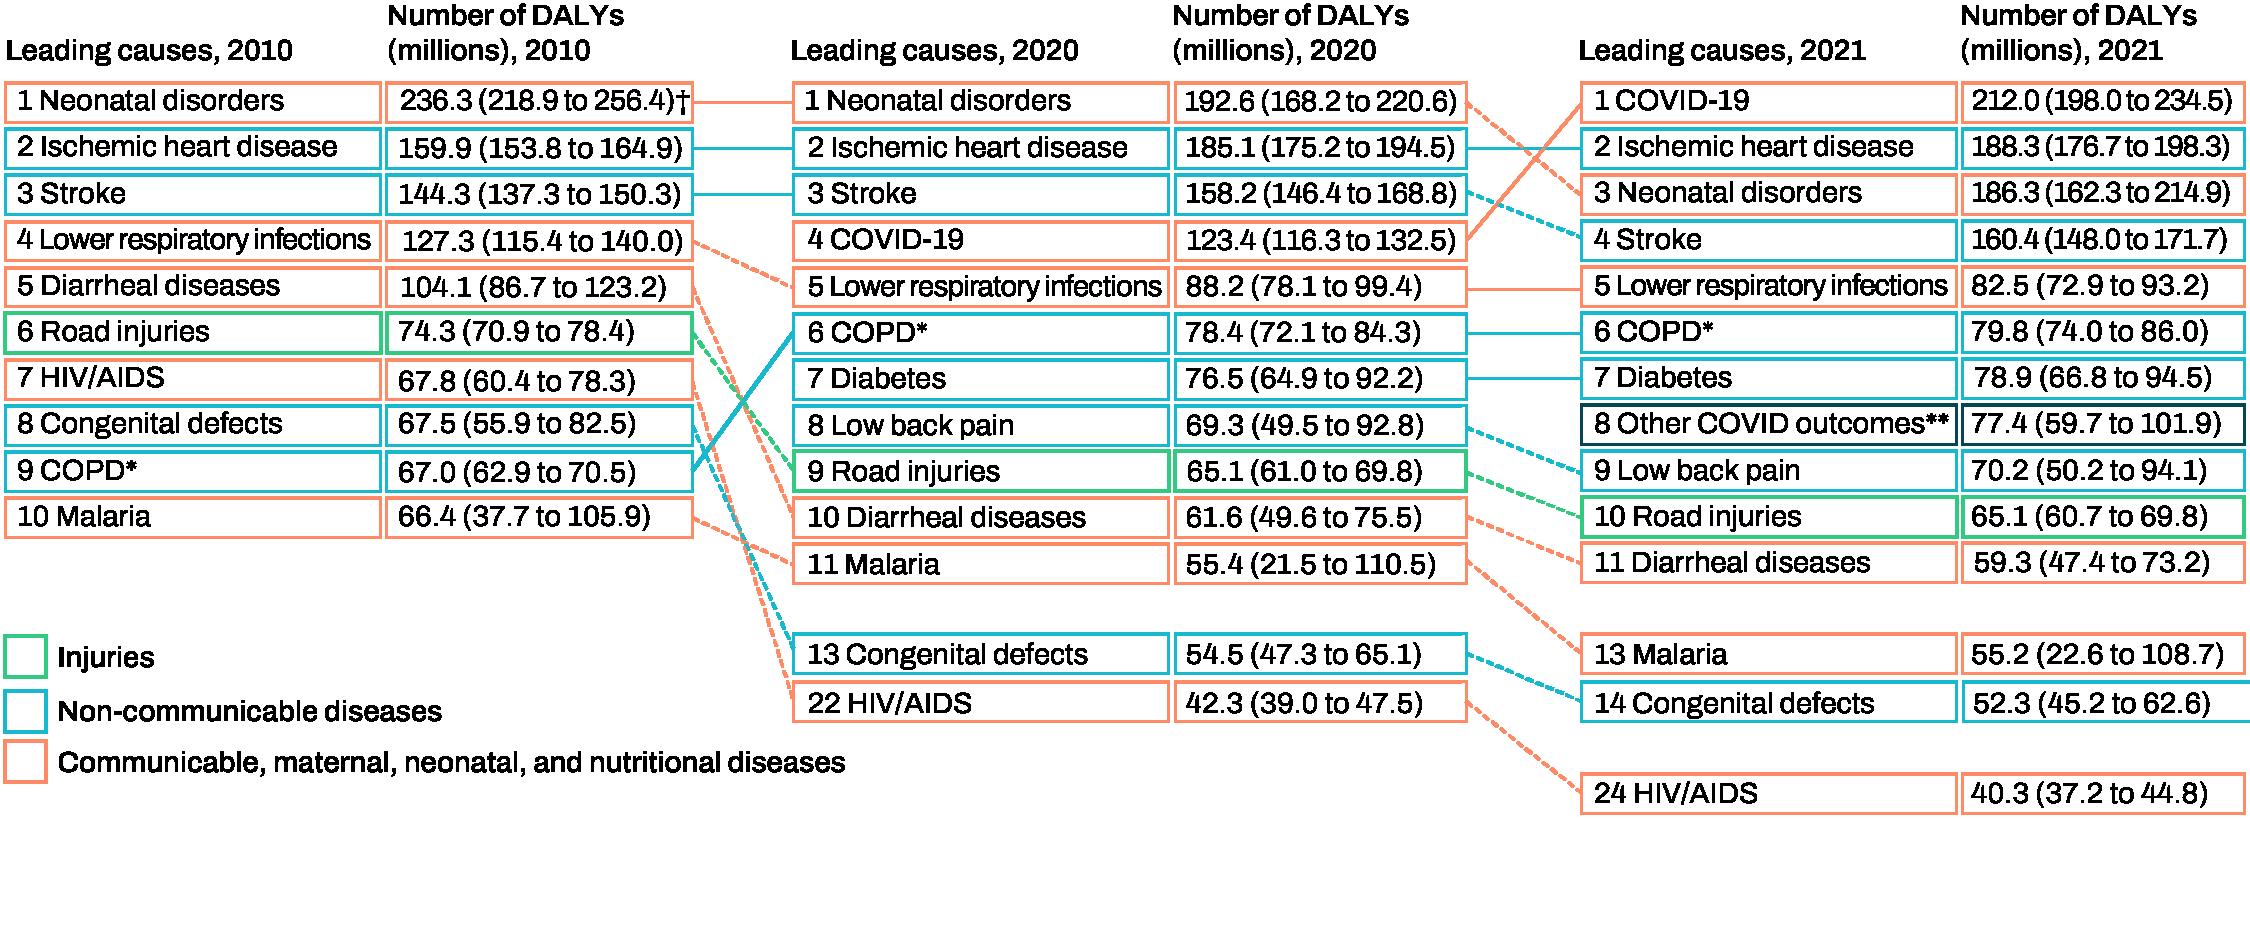
** Other pandemic-related mortality; includes excess mortality associated with the pandemic.
While disease burden fell between 2010 and 2019, it increased overall since 2019 amid the pandemic, rising by 4.1% in 2020 and by 7.2% in 2021.
Total rates of global disease burden, 2010–2021
The largest improvements in healthy life expectancy occurred in countries ranking lowest on the Socio-demographic Index, a measure of income, fertility, and education.
Change in healthy life expectancy by GBD super-region, 2010–2021
Age-adjusted years lived with disability due to diabetes rose by 25.9% between 2010 and 2021, increasing in every country.
Annual change in age-adjusted rates of disease burden due to diabetes, 2010–2021

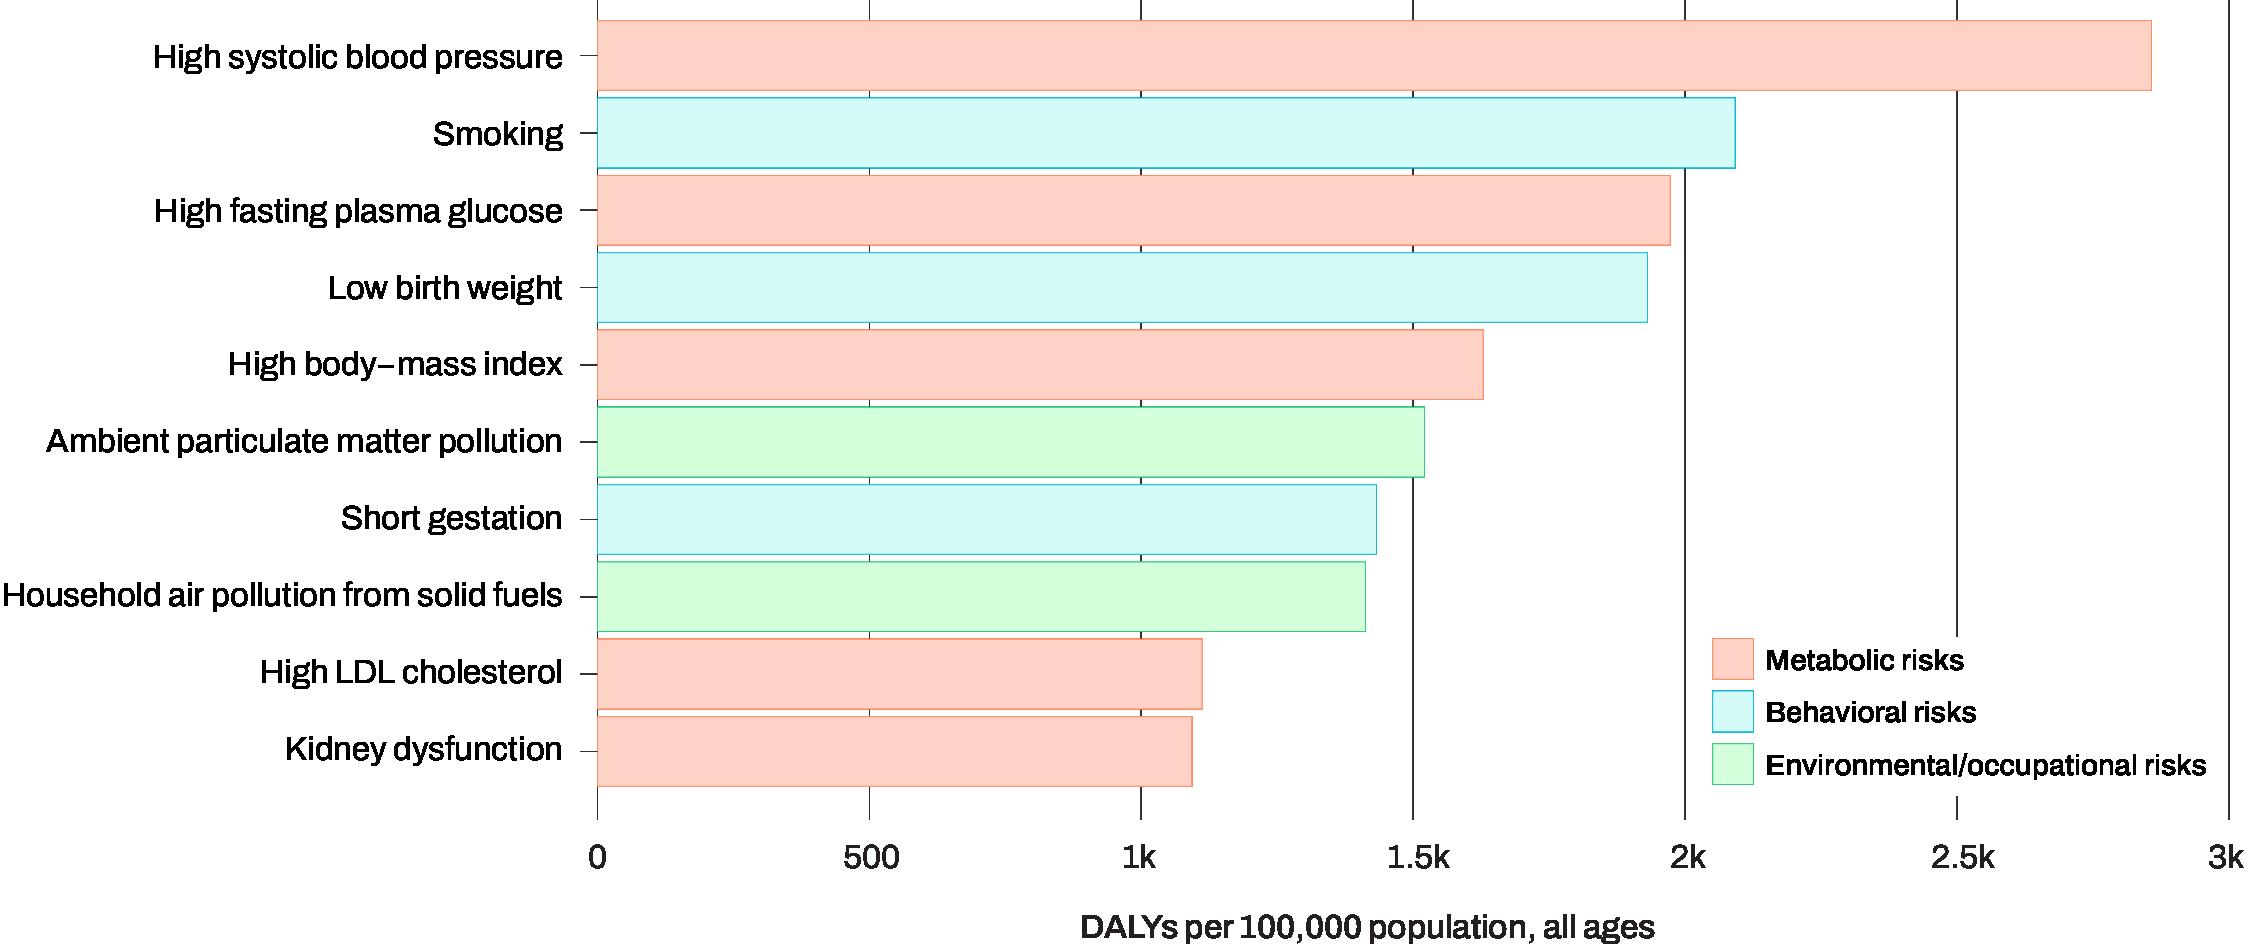
High blood pressure, smoking, high blood sugar, and ambient particulate matter air pollution are among the leading risk factors globally and at each level of the Socio-demographic Index.*
Policy interventions to date have been insufficient to address rising exposure to risk factors including high body mass index, high blood sugar, ambient air pollution, drug use, and high temperatures.
Countries have made rapid progress in reducing exposure to childhood and maternal malnutrition, household air pollution, and unsafe water, sanitation, and handwashing.
*The Socio-demographic Index is a measure of income, fertility, and education.
More than 50,000 new data sources.
Updated analysis using IHME’s groundbreaking burden of proof methodology, which measures the strength of evidence linking risk factors to diseases and injuries: https://vizhub.healthdata.org/burden-of-proof
New risk factor: nitrogen dioxide air pollution, which is linked to childhood asthma.
High blood pressure, smoking, and high blood sugar (high fasting plasma glucose) were the three leading risk factors for early death and poor health worldwide in 2021.
Leading risk factors for disease burden, 2021
While low birthweight, short gestation, and child underweight were top risk factors for children under age 5 in 2021, risk factors including high blood pressure, high blood sugar, and smoking were leading risk factors among older people.
Top 10 risk factors for disease burden among children vs. older adults globally, 2021
Rank* Children under 5 People aged 70+
1 Low birth weight High blood pressure
2 Short gestation High fasting plasma glucose (high blood sugar)
3 Child underweight Smoking
4 Household air pollution from solid fuels Ambient particulate matter pollution
5 Child wasting High body mass index (adult)
6 Child stunting Kidney dysfunction
7 Unsafe water source High LDL cholesterol
8 Ambient particulate matter pollution Household air pollution from solid fuels
9 Unsafe sanitation and handwashing Diet high in sodium
10 No access to handwashing facility Lead exposure in bone
*Attributable DALYs per 100,000
Since 2000, disease burden linked to high body mass index and high blood sugar rose by 16% and 8%, respectively, as exposure to these risk factors has grown.
Rates of disease burden attributable to high body mass index, high fasting plasma glucose, high blood pressure, smoking, and low birth weight, age-standardized, 2000–2021

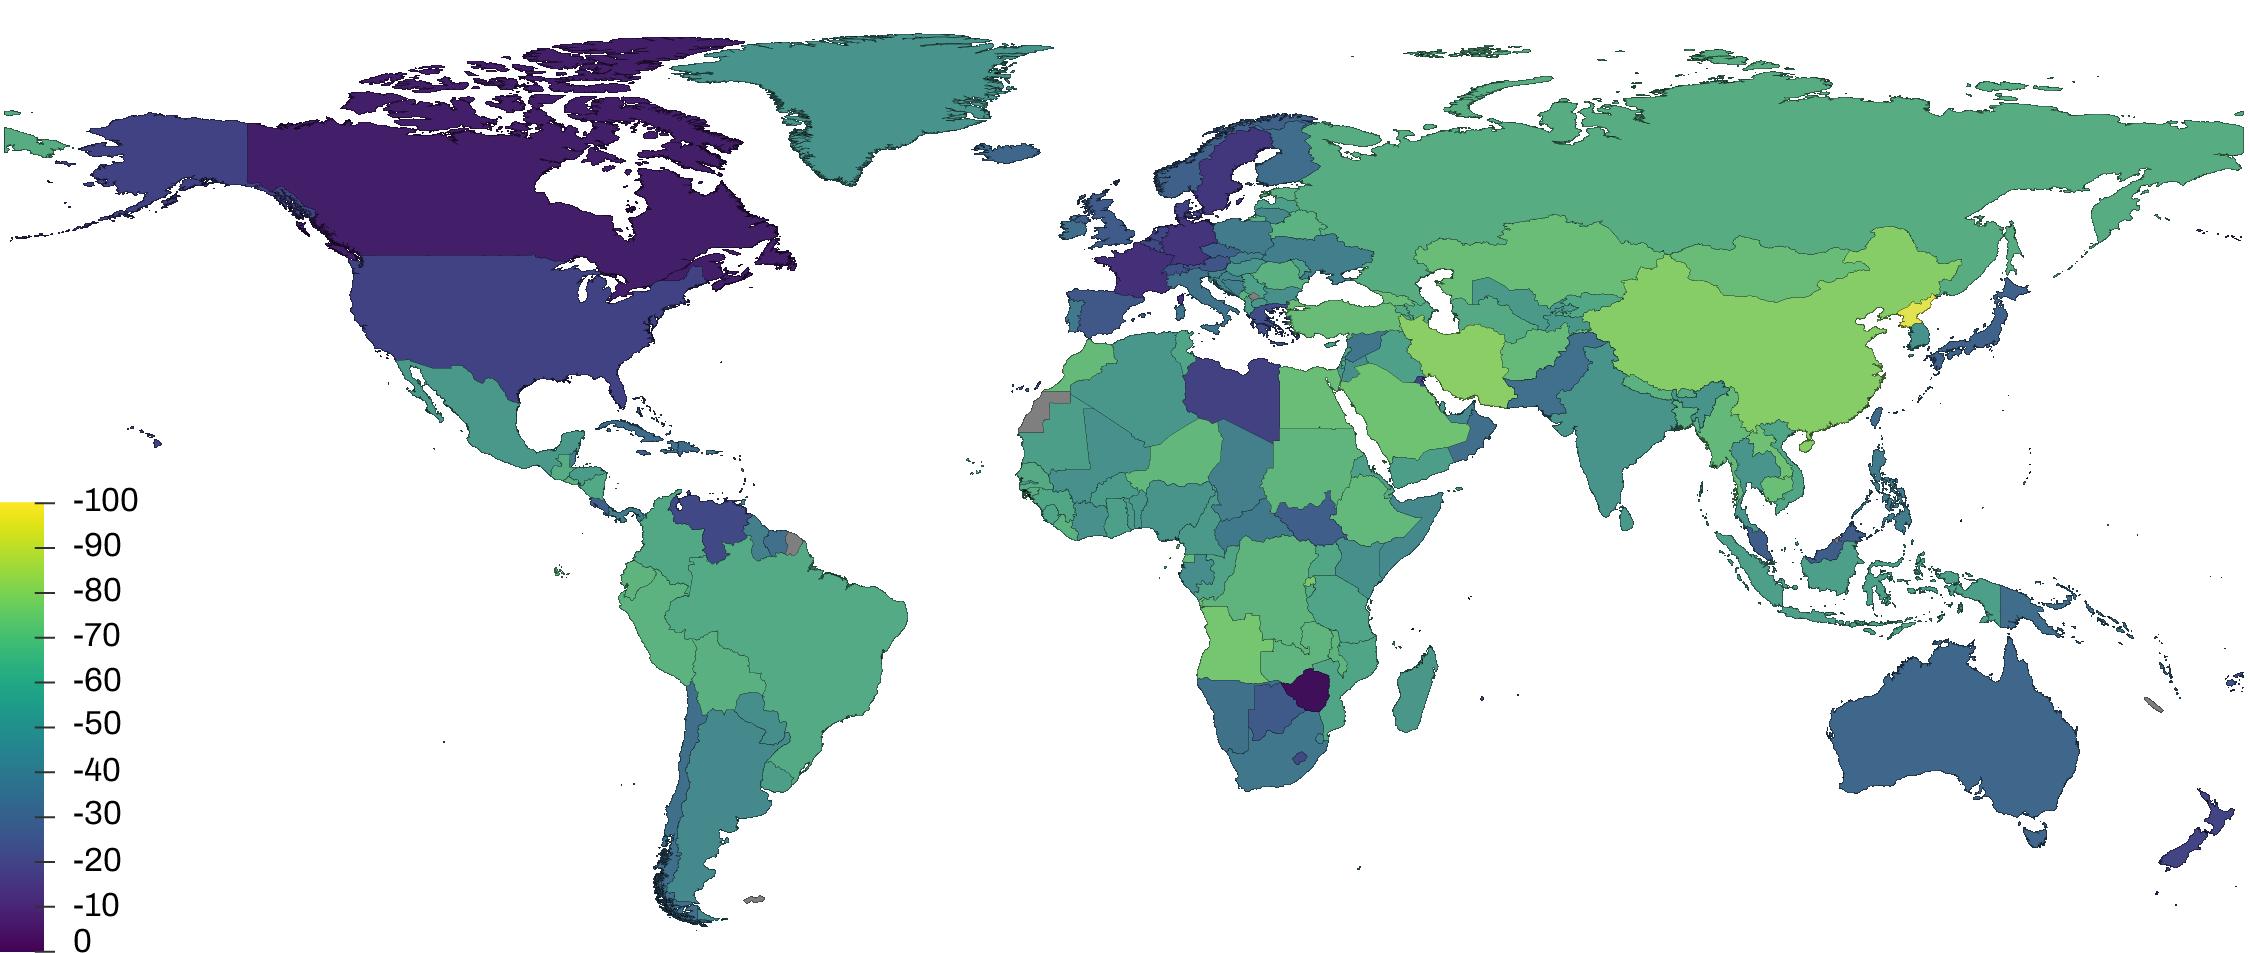
The burden of disease related to child and maternal malnutrition has dropped rapidly, especially in locations ranking lower on the Socio-demographic Index.
Percentage change in disease burden attributable to child and maternal malnutrition by country, age-standardized, 2000–2021
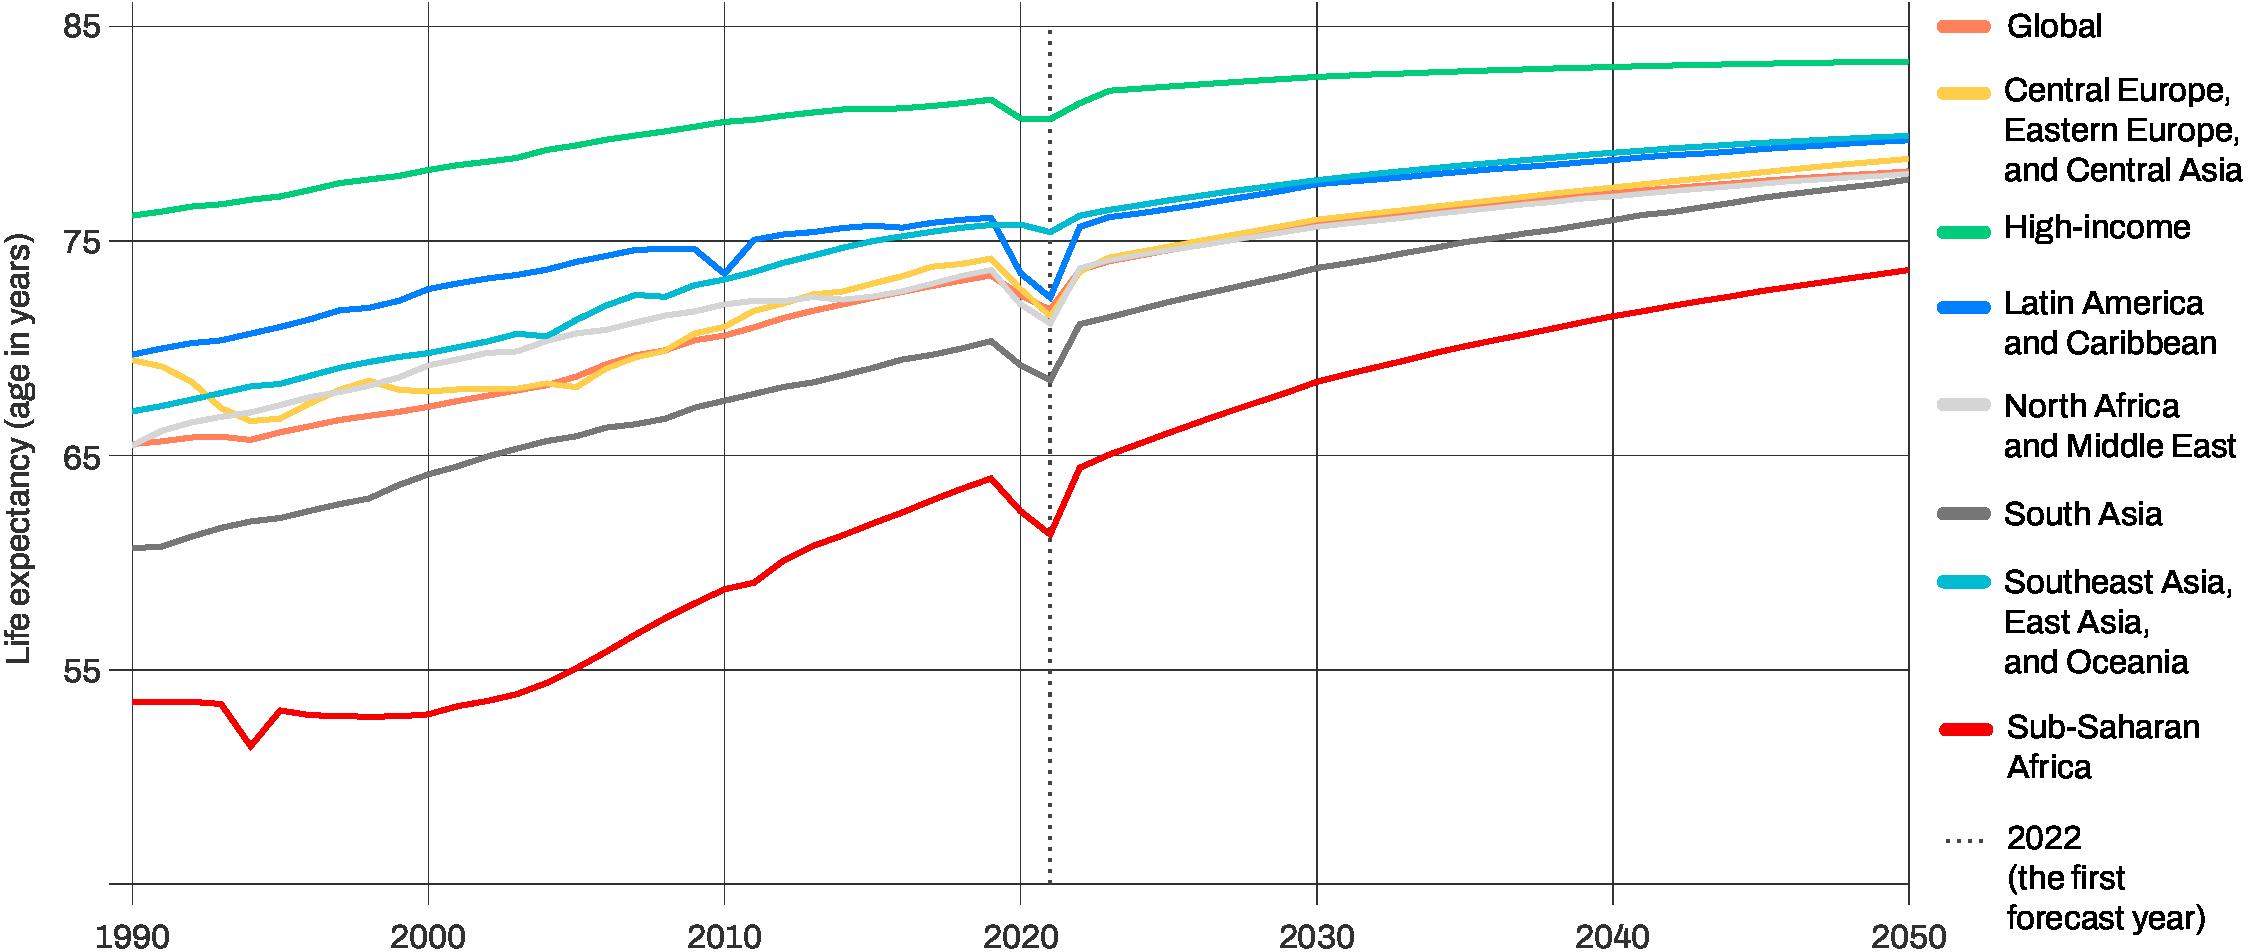
Our forecasts reveal that life expectancy will continue to climb globally, increasing by 4.6 years from 2022 to 2050, even after factoring in rising temperatures, indicating a very different future than many experts have predicted.
Causes contributing to improvements in life expectancy include declining deaths from cardiovascular diseases, respiratory infections and tuberculosis,* and maternal and neonatal deaths.
Our findings indicate that increases in life expectancy will be largest in countries where it is currently lower, and inequalities between countries will shrink.
There is an opportunity to speed up progress by addressing behavioral and metabolic risks, which include high blood sugar, high body mass index, high blood pressure, and smoking.
Marks the first time that GBD Collaborators have produced forecasts for all the study’s key metrics.
Provides a picture of disease burden for the first four years of the COVID-19 pandemic.
Includes forecasts for 359 diseases and injuries.
Utilizes improved methods.
*Declining deaths from “respiratory infections and tuberculosis” were largely due to reductions in deaths from COVID-19, a disease that is included in this category.
We forecast that life expectancy improvements will be larger in sub-Saharan Africa than in any other super-region between 2022 and 2050.
Global and super-regional life expectancy, 1990–2050
Between 2022 and 2050, we forecast that poor health and early death from communicable, maternal, nutritional, and neonatal diseases will decline, and the burden of non-communicable diseases will rise.
Leading causes of disease burden* worldwide in 2022 versus 2050
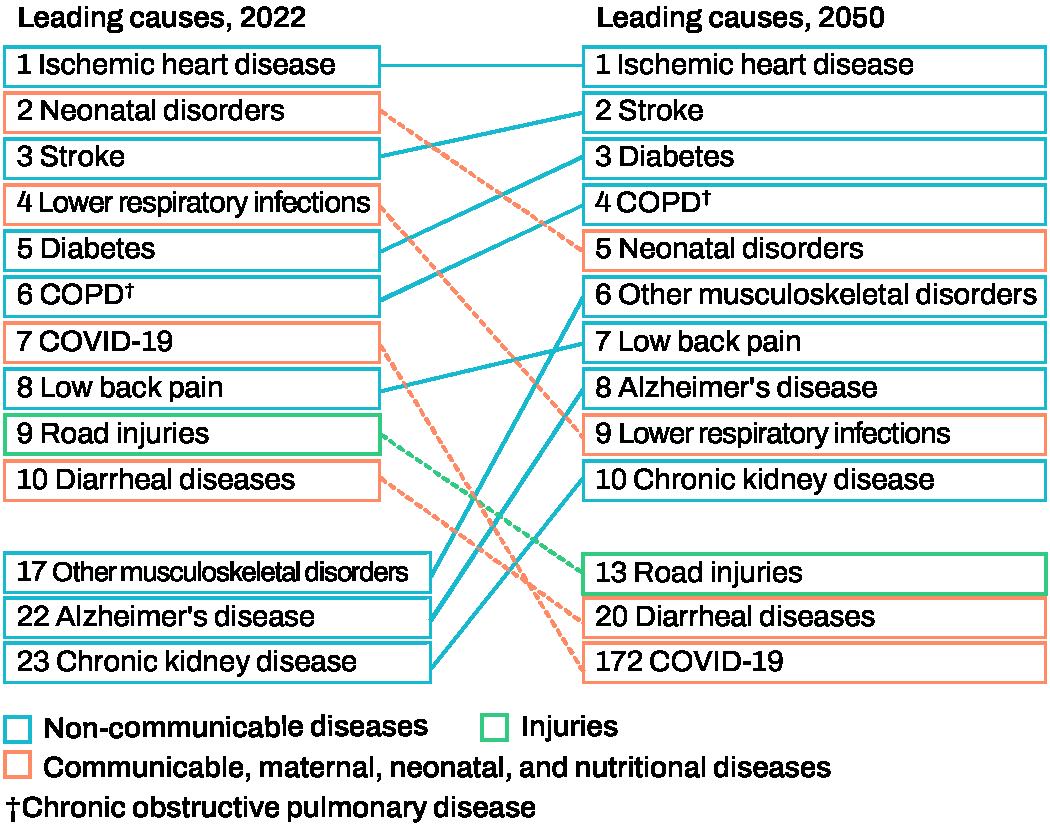
*Measured in number of disability-adjusted life years (DALYs)
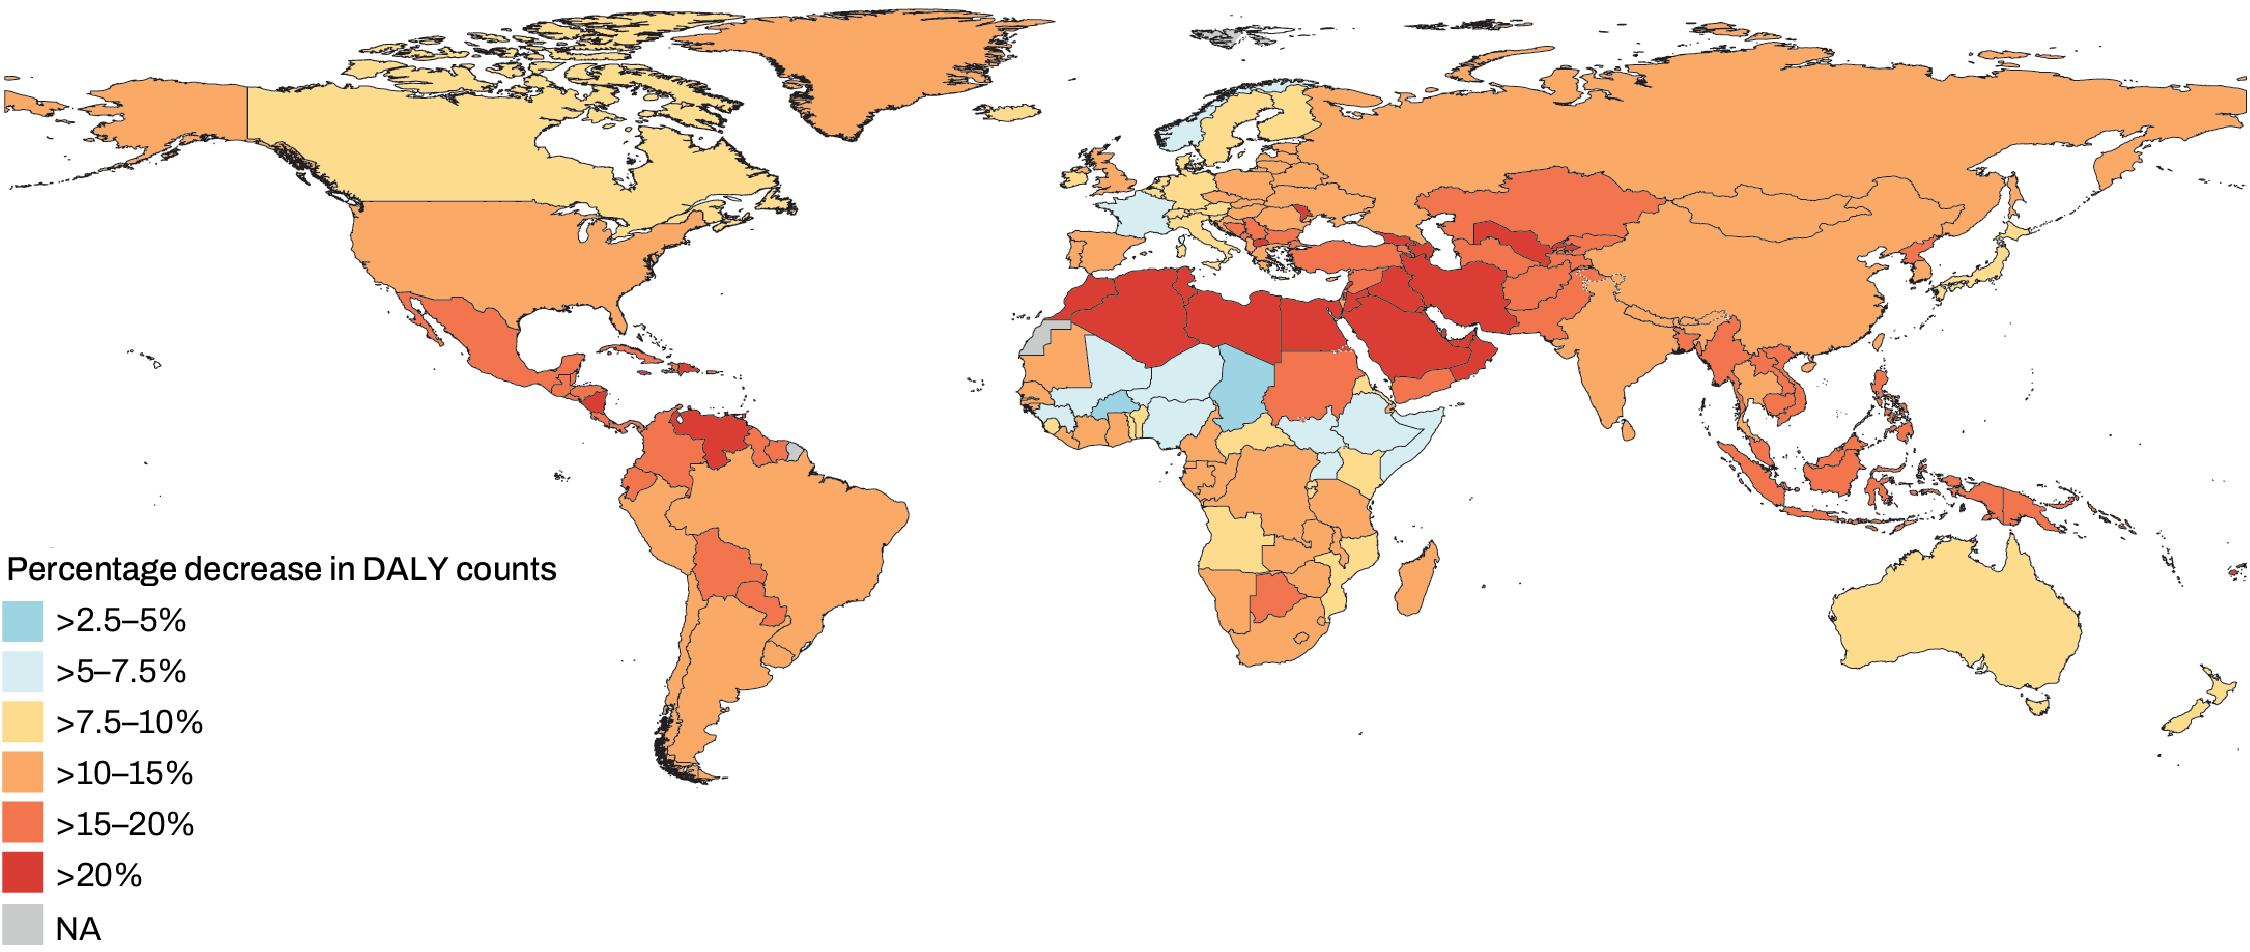
The researchers devised different intervention scenarios in which key risk factors are eliminated – “Safer Environment,” “Improved Behavioral and Metabolic Risks,” and “Improved Childhood Nutrition and Vaccination.” The “Improved Behavioral and Metabolic Risks” scenario leads to the largest reduction in global disease burden (13% fewer DALYs in 2050 than the most likely [Reference] scenario).
Forecasted global disease burden** by scenario through 2050

**Measured in disability-adjusted life years (DALYs)
In 2050, we forecast that the impacts of the “Improved Behavioral and Metabolic Risks” scenario will be greatest among countries in North Africa and the Middle East.
Percentage decrease in disease burden in 2050 for the “Improved Behavioral and Metabolic Risks” scenario compared to the most likely (Reference) scenario
Information about the study
https://www.healthdata.org/research-analysis/gbd
Downloadable results data
GBD Results tool https://vizhub.healthdata.org/gbd-results Global Health Data Exchange https://ghdx.healthdata.org/gbd-2021
Interactive data visualizations
GBD Compare http://vizhub.healthdata.org/gbd-compare
GBD Cancer Compare http://vizhub.healthdata.org/gbd-compare/cancer
GBD Foresight https://vizhub.healthdata.org/gbd-foresight Causes of Death http://vizhub.healthdata.org/cod Mortality http://vizhub.healthdata.org/mortality Epi http://vizhub.healthdata.org/epi
Country- and subnational-level profiles
https://www.healthdata.org/research-analysis/health-by-location/profiles
Sources
https://ghdx.healthdata.org/gbd-2021/sources
Statistical, analytical, processing, and estimation code
https://ghdx.healthdata.org/gbd-2021/code
Download results and other GBD data: http://ghdx.healthdata.org/gbd-2021