

A SPECIAL REPORT ON GLOBAL EXPOSURE TO AIR POLLUTION AND ITS HEALTH IMPACTS, WITH A FOCUS ON CHILDREN’S HEALTH

In partnership with

The State of Global Air is a collaboration between the Health Effects Institute and the Institute for Health Metrics and Evaluation’s Global Burden of Disease project.
Citation: Health Effects Institute. 2024. State of Global Air 2024. Special Report. Boston, MA:Health Effects Institute.
2578-6873 © 2024 Health Effects Institute
ISSN
WHAT IS THE STATE OF GLOBAL
The State of Global Air is a research and outreach initiative to provide accurate, meaningful, and the latest information about air quality and its health impacts around the world . A collaboration of the Health Effects Institute and the Institute for Health Metrics and Evaluation’s Global Burden of Disease project, the program gives citizens, journalists, policymakers, and scientists access to high-quality, objective information about air pollution and its health impacts All data, tools, and reports are free and available to the public
ABOUT THIS REPORT
Now in its fifth iteration, the State of Global Air 2024 report presents information on exposures to and health impacts of exposure to common air pollutants including fine particulate matter, ozone, and for the first time, nitrogen dioxide, from 1990–2021 . The report draws upon the best available air quality data, estimates of health risks, and demographic data to produce globally comparable country-level data . The SoGA initiative provides a comprehensive resource that complements other sources of information on air pollution and health This report is produced in partnership with UNICEF and includes a focus on children’s health
HOW CAN I EXPLORE THE DATA?
This report has a companion interactive website with tools to explore, compare, and download data and graphics Anyone can use the website to access data for cities and countries around the world and track long-term trends for air pollutants and associated health impacts at www.stateofglobalair.org


CONTENTS Introduction 4 Exposure to Air Pollution 7 Air Pollution’s Burden of Disease 14 Air Pollution and Children’s Health . . . . . . . . . . . 21 The Rising Threat of Noncommunicable Diseases 27 Conclusions 29 Key Resources 30 Contributors and Funding 32 APPENDIX I: Methodology 33 Data and figures from this publication may be used for noncommercial purposes. Contents of this report may not be used for any commercial purposes without prior permission from the Health Effects Institute. Please write to us at contactsoga@healtheffects.org for more information.
AIR?
@HEISoGA

2nd
largest risk factor of deaths in 2021
Countries in South Asia and Africa face the highest burden of disease.

Global Risk Factors for Death
1. High blood pressure
2. Air pollution 3. Tobacco 4. Diet
5. High fasting plasma glucose

8.1
million total deaths due to air pollution in 2021
Since 2000
The disease burden for household air pollution (HAP) has decreased largely due to reductions in exposure in China and South Asia.
There has been a 36% decline in deaths from HAP.
30% of deaths from lower respiratory infections.
Air pollution is responsible for 28% of deaths from ischemic heart disease.

48% of deaths from chronic obstructive pulmonary disease.
Lower respiratory infection deaths are decreasing across most regions.


The interim targets (ITs) were developed based on current scientific evidence and are intended to be used in diverse conditions to support air quality management.
For more, see the WHO air quality guidelines.
Children Under 5
709,000 total deaths from air pollution in 2021. The largest burden of disease is seen in Asia and Africa.


The Good News
The disease burden linked to air pollution in children under 5 has decreased by 35% since 2010, driven largely by reductions in HAP.

Globally, ambient PM2.5 levels are reducing or stabilizing in many regions.
31.3 µg/m3 average global exposure of ambient PM2.5
2nd
largest risk factor of deaths in 2021
In South Asia and East, West, Central and Southern Africa, air pollution accounts for nearly 30% of all deaths in the first month after birth.
Populations from low- and middleincome countries are exposed to 1.3—4 times higher levels of ambient PM2.5.
Global Risk Factors for Death for Children Under 5 Years
Malnutrition 2. Air pollution
3. Water, sanitation, and hygiene
4. High or low temperature
5. Tobacco


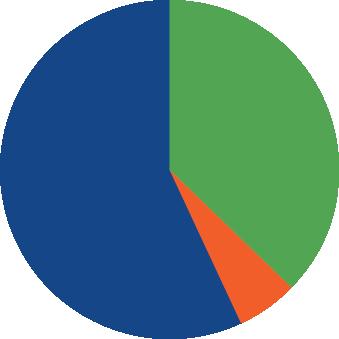
58% deaths from ambient PM2.5 38% 6% deaths from household air pollution deaths from ozone
air pollution–related deaths by pollutant
72% HAP 28% PM2.5 81% of countries met WHO IT-1 (35 µg/m3) 64% of countries met WHO IT-2 (25 µg/m3) 34% of countries met WHO IT-3 (15 µg/m3) 14% of countries met WHO IT-4 (10 µg/m3)
1.
INTRODUCTION

The United Nations General Assembly has formally declared access to a clean, healthy, and sustainable environment a universal human right, especially for children . In 2023, the United Nations Committee on the Rights of the Child emphasized the children’s right to a clean, healthy, and sustainable environment Yet, it is a right that goes unfulfilled for billions of people
In 2021, air pollution contributed to 8.1 million deaths — more than 1 in 8 deaths worldwide.
Most people on Earth are exposed to unhealthy levels of air pollution
Each year, millions of people die early, and many more live with debilitating chronic diseases because of breathing polluted air
The threat of air pollution is not new, but it is changing Air pollution has contributed to death and disease and has hurt economic prospects and community resilience for decades During that time, policies and technologies have succeeded in drastically improving air quality in some areas, saving lives, and proving that pollution is not an inevitable byproduct of economic development . Yet despite this encouraging progress, the threats posed by air pollution have continued to mount as they merge with the threats posed by global climate change and increasingly aging populations
Many sources of air pollution — including the burning of fossil fuels and biomass — are also contributors to greenhouse gas emissions that are causing our planet to warm As we continue to burn these fuels in our vehicles, power plants, factories, fields, and homes, both air pollution and the impact on our climate grow worse
At the same time, the symptoms of climate change are further exacerbating air pollution . As droughts become more severe and prolonged and land becomes drier, wildfires ravage once-thriving
forests and dust storms impact vast plains, filling the air with particles that linger for long periods of time When summer temperatures soar, airborne pollutants such as nitrogen oxides catalyze with increased vigor, speeding the formation of ozone, which also has health implications As societies struggle to adapt and limit suffering caused by the changing climate, finding solutions that can address such interconnected challenges is of increasing importance
Like climate change, air pollution affects us all but brings disproportionate impacts for some: pregnant people, babies and children, older people, those living in poverty, and those who have been historically marginalized The scale and urgency of the challenges are hard to overstate Yet there are also glimmers of hope all around us By describing the magnitude of the air pollution problem and its true toll on human health — and providing examples of actions being taken to improve air quality around the globe — we intend this report to inspire and inform efforts to reclaim and rebuild the healthy environment
Air pollution was the second leading risk factor for death among children under 5 in 2021, after malnutrition.
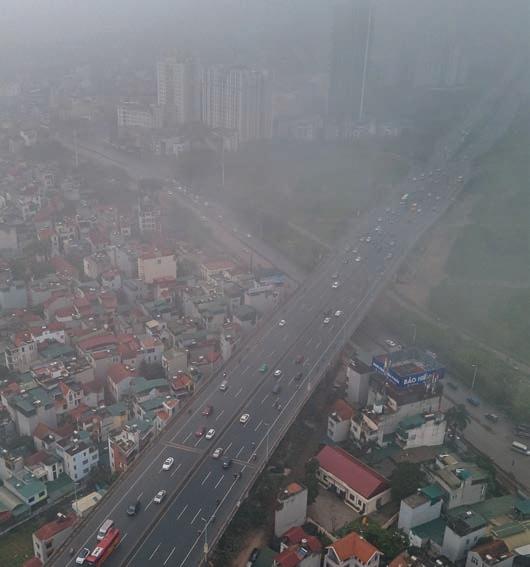
© UNICEF/Linh Air
Pollution in Hanoi, Vietnam
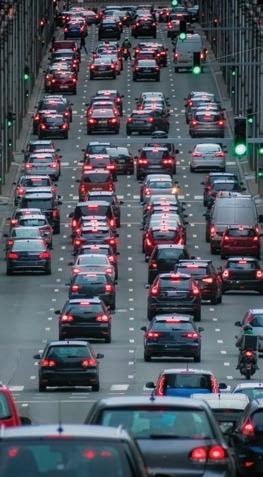
Brussels, Belgium
What This Report Covers
This State of Global Air report presents the latest comprehensive estimates of exposures to fine particulate matter (PM2 5), nitrogen dioxide (NO2), and ozone and their impacts on human health around the world . The main data source is the Global Burden of Diseases, Injuries, and Risk Factors Study (GBD 2021) of the Institute for Health Metrics and Evaluation, which is a collaboration of more than 10,000 researchers worldwide that produces comparable global estimates of 88 environmental, behavioral, and dietary risk factors on health across 204 countries and territories from 1990–2021 Updated regularly, this comparative risk assessment uniquely describes both the absolute and relative importance of the multiple health risk factors that contribute to the global burden of disease and put air pollution into perspective The results, reported here, offer a comprehensive account of exposures and a foundation for informing decisions and actions toward a healthier world .
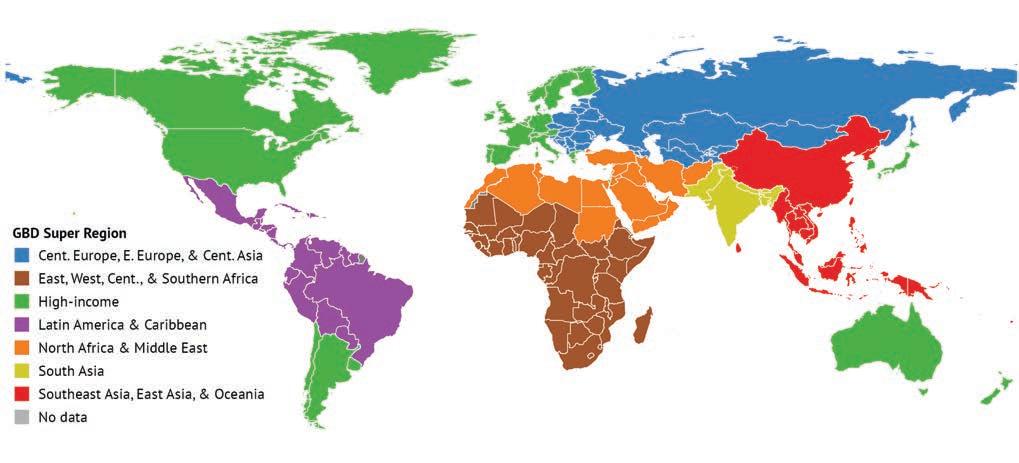
The repor t focuses on air pollution and health trends seen globally within the GBD Super Regions (countries grouped by similar cause-of-death patterns; see Figure i) and in the most populous countries . Interactive maps and figures, downloadable data, and additional resources on the State of Global Air website allow deeper exploration and visualization of air pollution levels and health impacts in individual cities, countries, and regions
What’s New for This Iteration
With each update, the GBD Study incorporates the latest scientific evidence and methods to refine estimates of the burden of disease — or impacts on population health — from air pollution and other risk factors
Inclusion of a new pollutant: Previous iterations have presented trends for two categories of fine-particle air pollution — ambient
PM2 5 and household air pollution from cooking with solid fuels — as well as ground-level ozone This report covers trends for those same pollutants plus NO2, a pollutant common in urban areas that is often used as a marker of traffic-related air pollution . In many cities, exposure to NO2 continues to be high; NO2 can also react with other chemicals in the atmosphere to produce particulate matter and ozone
Inclusion of a new health outcome: As the first iteration developed in partnership with UNICEF, this report also provides an in-depth analysis of the impacts of air pollution on children, including, for the first time, estimates of the impact of NO2 exposures on the development of childhood asthma
Effect of COVID-19 on the global burden of disease: The report is also the first report since the COVID-19 pandemic and provides disease burden estimates through 2021 The latest GBD estimates, GBD 2021, provide the first comprehensive global assessment of the effects of COVID-19 on the burden of disease (disability-adjusted life years, or DALYs), mortality, and life expectancy in the context of 288 causes of death from 1990 to 2021 . From 1990 through 2019, the leading global causes of death were ischemic heart disease (IHD), stroke, chronic obstructive pulmonary disorder (COPD), and lower respiratory disease, for which air pollution is a leading risk factor However, in 2021 the COVID pandemic shifted this ordering, with age-standardized mortality from COVID ranking second after IHD and stroke and COPD dropping to third and fourth place, respectively . GBD 2021 did not attempt to estimate the burden of disease or mortality from COVID attributable to any risk factor, including air pollution, due to limitations in the understanding of COVID risk factors
Note: The data presented are global estimates based on a range of publicly available datasets and do not necessarily represent datasets submitted to UN agencies by national governments. All GBD estimates are subject to a rigorous peer-review process; the data reported have been published in The Lancet in May 2024; and the exposure data reported are for the year 2020.
STATE OF GLOBAL AIR 2024 5
i. Countries included in the seven GBD Super Regions
FIGURE
Key Definitions
Total number of deaths
The number of deaths in a given year attributable to past exposure to air pollution
Age-standardized rates
The total number of deaths or DALYs per 100,000 people, calculated based on a standard population distribution across age categories Agestandardized rates allow direct comparison of the disease burden among countries with different population sizes and age distribution (e g , older or younger) Higher air pollution–attributable, age-standardized disease rates reflect a combination of higher air pollution levels and sicker populations
Disability-adjusted life years (DALYs)
DALYs represent both the years of life lost from premature deaths and years lived in poor health (e g , years lived with paralysis from a stroke related to air pollution exposure) One DALY equals one lost year of healthy life DALYs are higher when young people die compared with when old people die because young people still have many years ahead of them Given the set of diseases currently attributed to air pollution in GBD, most of the DALY burden stems from early deaths rather than years of life with a disability; for this reason, the State of Global Air focuses largely on mortality
Uncertainty intervals (UIs)
Estimates of uncertainty are provided for every value in the form of 95% uncertainty intervals (UIs), representing the range between the 2 5th and 97 5th percentiles of the distribution of possible values
6 STATE OF GLOBAL AIR 2024
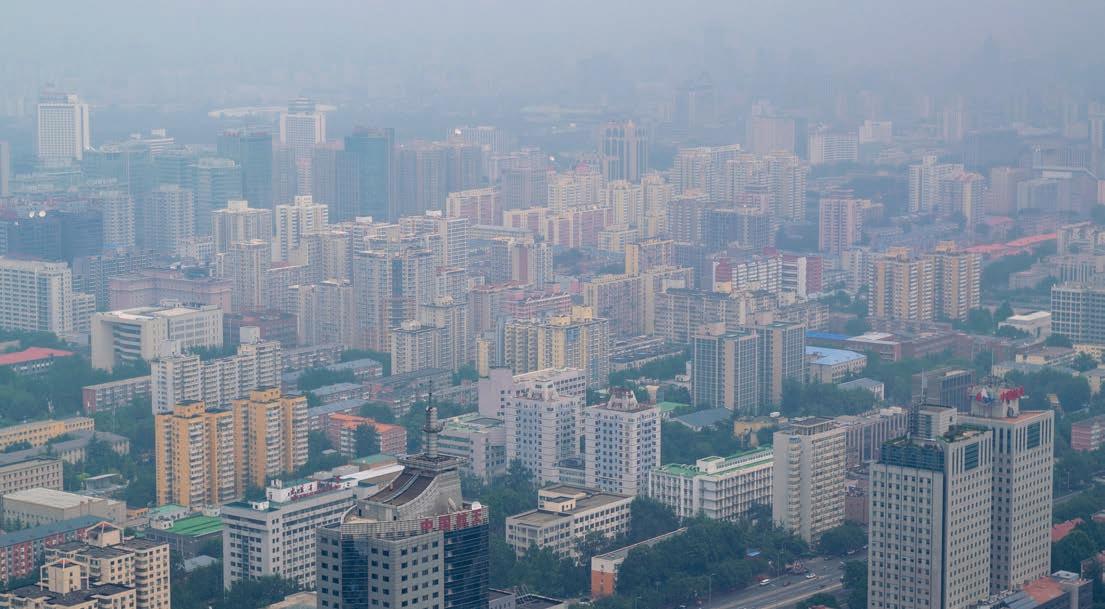
Unsplash
Beijing, China
EXPOSURE TO AIR POLLUTION
Air pollution is a complex mixture including particles and different gases with sources and composition varying over space and time While hundreds of chemical compounds can be measured in the air, governments typically measure only a small subset as indicators of the different types of air pollution and major sources contributing to that pollution Sometimes referred to as criteria pollutants, these pollutants include particulate matter, nitrogen dioxide, sulfur dioxide, ozone, and carbon monoxide, and are known to harm our health and ecosystems PM2 5, NO2, and ozone are the three indicators used to quantify air pollution exposures in the GBD study .
99% of the world’s population lives in places with unhealthy levels of PM2.5 pollution. 34% lives in areas that exceed even the least stringent WHO interim air quality targets.
FINE PARTICLE AIR POLLUTION
Fine particle air pollution, or PM2 5, refers to airborne particles measuring less than 2 5 micrometers in diameter (less than a 30th of the diameter of a human hair) These particles, as well as precursor chemicals that contribute to their formation in the atmosphere, are emitted from vehicles, residential fuel use, coal-burning power plants, agricultural and industrial activities, waste burning, wildfires, and many other human and natural sources . Among the key air pollutants that are currently measured, long-term exposure to PM2 5 is the most consistent and accurate predictor of poor health outcomes across populations Recent studies, including several from the Health Effects Institute conducted in Europe, Canada, and the United States, have shown that even people living in areas with very low levels of PM2 5 (e g , as low as 4 µg/m3 or even lower) can still experience adverse health effects
Much of the research on PM2 5 divides exposures into two main categories: exposures due to pollution from outdoor sources (ambient air pollution) and pollution due to household solid fuel use for cooking (household air pollution) High levels of ambient PM2 5 pollution persist in large areas of the world and billions of people are currently exposed Household air pollution affects nearly half the world’s population but is heavily concentrated in specific geographic areas including Asia and Africa . Both indoor and outdoor exposures to air pollution pose serious problems for human health
Ambient PM2 5 concentrations are measured in micrograms of particulate matter per cubic meter of air, or µg/m3 . The GBD study estimates exposure as the population-weighted annual average
concentration, a measure that represents annual averages across an entire country or geographic region It is also impor tant to recognize that people may be exposed to considerably higher concentrations day to day or during certain seasons, especially around cities or major pollution sources and during episodes such as those related to wildfire smoke or agricultural burning
Household air pollution exposure results from burning solid fuels for cooking, heating, or other domestic tasks Burning these fuels produces an array of health-harming pollutants, including PM2 5 and its constituent black carbon and carbon monoxide The GBD study estimates household air pollution exposures based on the proportion of the population that lives in households burning solid fuels, such as coal, wood, dung, or agricultural residues for cooking (a major source of this pollution), in combination with estimates of levels of PM2 5 from household and personal exposure measurement studies . These estimates are likely to understate the total exposure and disease burden in some locations because they do not include exposures related to the use of solid fuels for heating, boiling water, or other residential tasks, nor do they include exposures from burning of liquid fuels, such as kerosene Household air pollution is also a major contributor to ambient PM2 5 and it is sometimes a dominant source For example, a recent review article estimated that nearly 20% of the global ambient PM2 5 is attributed to household air pollution reaching outdoor air However, these exposures are accounted for as part of exposures to ambient PM2 5 in the data discussed below
PM2.5 TRENDS
Globally, ambient PM2 5 levels are decreasing or stabilizing in many regions The global average exposure for ambient PM2 5 in 2020 was 31 3 µg/m3 (95% uncertainty interval [UI]: 29 6–33 3 µg/m3) The highest annual average exposures were seen in South Asia; East, West, Central, and Southern Africa; North Africa; and the Middle East (Figure 1) Worldwide, eight of the ten countries with the highest PM2 5 exposures are in Africa, and the remaining two are in the Middle East . At the regional level, major sources of PM2 5 in the Middle East and North Africa include dust, power plants, transportation, and industries, while South Asia has some of the largest PM2 5 exposure due to residential fuel use, energy generation, industries, and agriculture Of note, high PM2 5 exposures in North and West Africa are influenced by windblown mineral dust, in addition to
Countries in Asia, Africa, and the
Middle East
continue to experience the highest levels of ambient PM2.5.
STATE OF GLOBAL AIR 2024 7
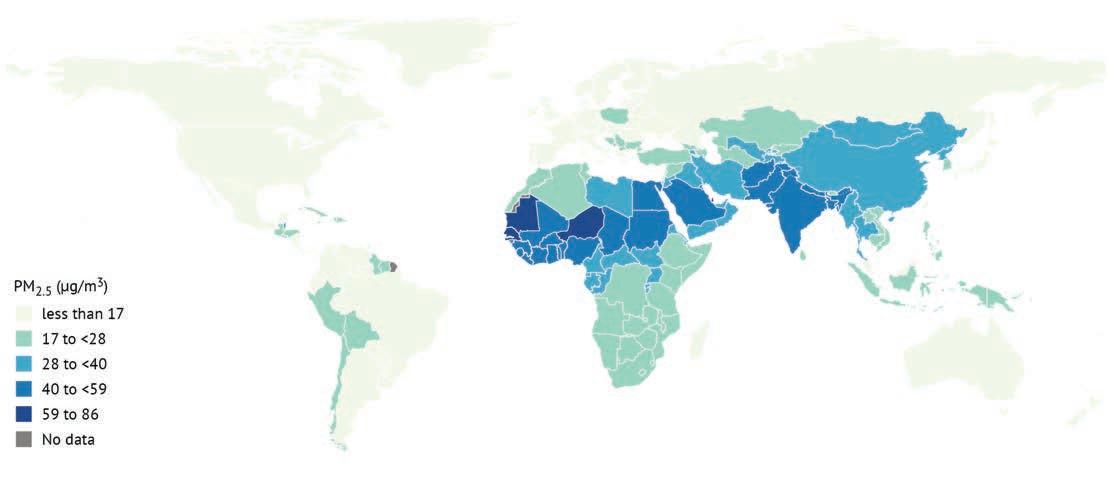
FIGURE 1. Global map of national population-weighted annual average PM2 5 concentrations in 2020 Visit stateofglobalair.org to explore the data for your country or region
human-made sources Concurrently, in many of these countries, large proportions of the population use solid fuels for cooking and may engage in open burning of agricultural lands or forests, all of which contribute to outdoor air pollution
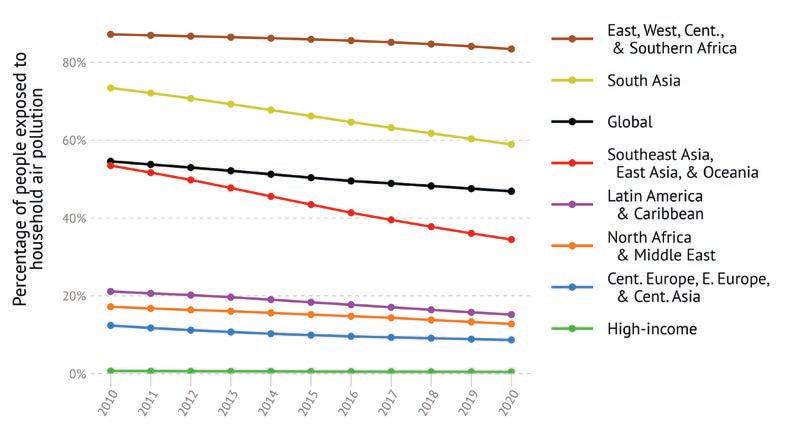
The differences in exposure to PM2 5 across these regions have largely remained constant over the past decade: in low- and middleincome countries (LMICs) exposures are between one and four times higher compared to those in high-income countries (HICs) (Figure 2) In large part, these regional trends track closely with socioeconomic development and national policy actions Regions including South
WHO Air Quality Guidelines
In response to a request by governments at the 68th World Health Assembly in May 2015, in Geneva, Switzerland, the World Health Organizaton (WHO) revised the Air Quality Guidelines (AQGs) as of 2021 The updated guidelines are based on evidence from studies around the world and offer evidence-based public health recommendations and guidance on air quality (Table i) In addition to the AQG values, WHO has also recommended interim targets to facilitate realistic plans that can lead to gradual and meaningful reductions in the disease burden linked to air pollution . Together, the AQG values and interim targets provide a thorough, datadriven framework for countries to improve air quality and protect people’s health
Asia, Southeast and East Asia and Oceania (especially China), Central and Eastern Europe, and Central Asia have seen reductions in PM2 5 exposures in the last two decades .
Tracking progress: Although nearly all of the world’s population is exposed to air pollution, the good news is that 81% of the 194 countries already meet the Interim Target 1 (IT-1, 35 µg/m3) for annual PM2 5 established by the WHO Only one country, Finland, had a population-weighted, annual average PM2 5 lower than the most stringent WHO Air Quality Guideline of 5 µg/m3 in 2020 .
TABLE i. World Health Organization Air Quality Guideline Values and Interim Targets for Various Pollutants
AQG = air quality guideline; IT-4 ITI = specific interim targets *Average of daily maximum 8-hour mean ozone concentration in 6 consecutive months with highest 6-month running average ozone concentration . **Not to be exceeded more than 4 days/year
8 STATE OF GLOBAL AIR 2024
Pollutant Averaging Time AQG IT-4IT-3IT-2IT-1 Change Compared to 2005 AQG PM2 5 (µg/m3) Annual 24-hour** 5 15 10 25 15 37 5 25 50 35 75 Tightened Tightened PM10 (µg/m3) Annual 24-hour** 15 45 20 50 30 75 50 100 70 150 Tightened Tightened Ozone (µg/m3) Peak season* 8-hour 60 100 70 120 100 160 New Unchanged N02 (µg/m3) Annual 24-hour** 10 25 2030 50 40 120 Tightened New SO2 (µg/m3) 24-hour**40 50125Loosened CO (mg/m3) 24-hour** 4 7 New
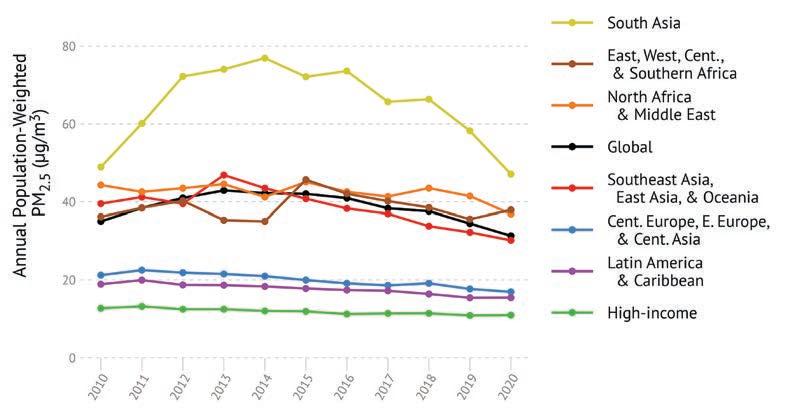
FIGURE 2 Trends in population-weighted annual average PM2 5 concentrations globally and in the GBD Super Regions, 2010–2020
Visit stateofglobalair.org to explore the data for your country or region.
in the proportion of population cooking with solid fuels globally and in the GBD Super Regions, 2010–2020
Visit stateofglobalair.org to explore the data for your country or region
*Finland is the only country that met the annual WHO AQG in 2020
Because these population-weighted PM2 5 concentrations represent annual averages across entire countries, they include — but do not fully represent — the considerably higher concentrations that may be observed day to day or in certain seasons, especially around cities or major pollution sources . For instance, in Southeast Asia, countries including Thailand, Vietnam, and Singapore experience air pollution episodes during the months when agricultural and peat fires occur, while US and Canada also experience higher pollution levels during the wildfire season Similarly in South Asia, Central Asia, and Eastern Europe, PM2 5 levels tend to be very high during the winter season, resulting in high exposures Although shor t-term exposure spikes can affect health, it is long-term exposures that contribute most to the burden of disease and mortality from air pollution, and therefore are the focus of this report However, there is a growing concern linked to health effects from such episodic exposures .
Household Air Pollution Trends
Measured by the percentage of the population that uses solid fuels for cooking, exposure to household air pollution (HAP) is most widespread in East, West, Central, and Southern Africa as well as in parts of Asia (Figure 3) Despite progress in the last few decades, 47% (95% UI: 46%–48%) of the world’s population — almost 3 6 billion people — are still exposed to pollution from household use of solid
fuels for cooking In 18 African countries, including Burundi, Mali, South Sudan, Niger, and Uganda, more than 95% of the population relies on solid fuels for cooking In the last decade, Nigeria, Ethiopia, and the Democratic Republic of the Congo have experienced more than a 20% increase in exposure to household air pollution, in large part due to population growth
SOURCES OF PM2.5
To reduce the disease burden attributable to air pollution exposure, we need to understand air pollution’s major sources, both now and in the future This is the critical first step toward identifying the highest priority actions for air quality emissions control and the most costeffective solutions to protect public health
STATE OF GLOBAL AIR 2024 9
WHO Target – Annual Mean % of people living in areas that meet WHO Air Quality Guidelines for PM2.5 20102020 IT-1, 35 µg/m3 59%66% IT-2, 25 µg/m3 39%45% IT-3, 15 µg/m3 16%22% IT-4, 10 µg/m3 5% 9%
<1% Finland less
Air Quality Guideline, 5 µg/m3
than 1%*
FIGURE 3. Trends
Visit the GBD-MAPS website to explore the data for your country or region
Progress in Air Quality Monitoring in Africa
As of 2023, several countries in Africa had representative, reference-grade ground-based air quality monitoring stations in place An important first step in understanding and improving exposure estimates over Africa is to expand ground-based monitoring networks across the continent Some regional examples of progressive action toward enabling and expanding access to and availability of air quality data:
In West Africa, Senegal created the Center for Air Quality Management (CGQA) in 2009 and established a continuous air quality monitoring network of five monitors in Dakar, the capital city Another monitor was added in 2017. CGQA also operates a reference laboratory . To increase the temporal and spatial resolution of data across Dakar, the center added low-cost sensor networks and a mobile laboratory with reference analyzers Data are made publicly available, which strengthens its utility
In Southern Africa, since 2005 South Africa’s air quality management approach allows for multilevel governance: local authorities are charged with implementation of national regulations, with provincial and national authorities playing an oversight role There are more than 130 fully automated air quality monitoring stations, which are managed mostly by metropolitan municipalities Data are disseminated through the South African Air
Quality Information System (SAAQIS), a one-stop shop for information on air quality SAAQIS was updated in 2017 to offer real-time air quality data, a mobile application, and ongoing collaboration with nongovernmental data providers to address wider community needs .
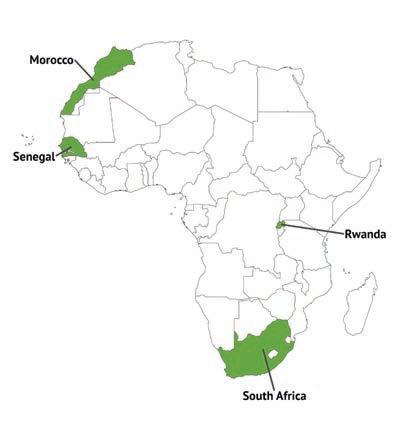
In East Africa, Rwanda launched its first integrated effort for long-term air quality monitoring at a national scale in 2017 The effor t had two objectives: to enhance the understanding of local emissions and to build the capacity of local scientists in interpreting air quality data . Continuous air quality monitoring was initially conducted in two locations and has expanded to 23 stations in 2021 Data are publicly available through a website and mobile application Rwanda’s approach to air quality monitoring involves (1) understanding ambient concentrations of criteria pollutants through a network of reference stations and low-cost sensors, and (2) investigating the composition of particulate matter using chemical speciation monitors to identify sources and inform mitigation measures
In North Africa, Morocco developed the National Air Program, 2018–2030, which aims to reduce pollution from stationary and mobile sources In 2022, the network had 36 stations across the 12 regions in the country (including all major cities) The goal is to set up over 140 stations by 2030
10 STATE OF GLOBAL AIR 2024
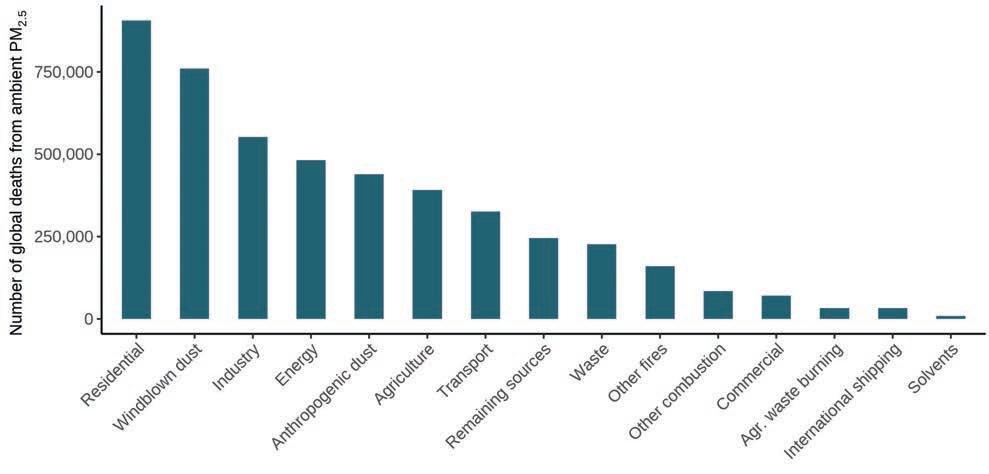
FIGURE 4. Contribution of key sources of PM2 5 to total number of global deaths in 2020 (Source: HEI Research Report 210 )
The sources responsible for PM2 5 pollution vary within and between countries and regions; significant contributors include residential fuel use, energy generation, industries, transportation, agriculture, windblown dust, waste combustion, and construction activities (Figure 4) Relative contributions of different sources to ambient PM2 5 vary across the globe For example, fossil fuel combustion is a large contributor to PM2 5 levels in countries such as Singapore and South Africa; windblown dust is a major source in many countries of Africa and the Middle East; and across South Asian countries, residential fuel combustion is the largest contributor to PM2 5
The contribution of different sources to the air pollution mixture is changing as some countries restrict activities or emissions to reduce air pollution, while others continue or increase their reliance on coal and other major contributors to air pollution

Curious about pollution in your city, country, or region? Track trends going back to 1990 at stateofglobalair.org
Find out how fossil fuels and other sources of PM2.5 contribute to air pollution in different areas of the world.
Our interactive StoryMap reveals the roles of different sources and sectors.
NITROGEN DIOXIDE
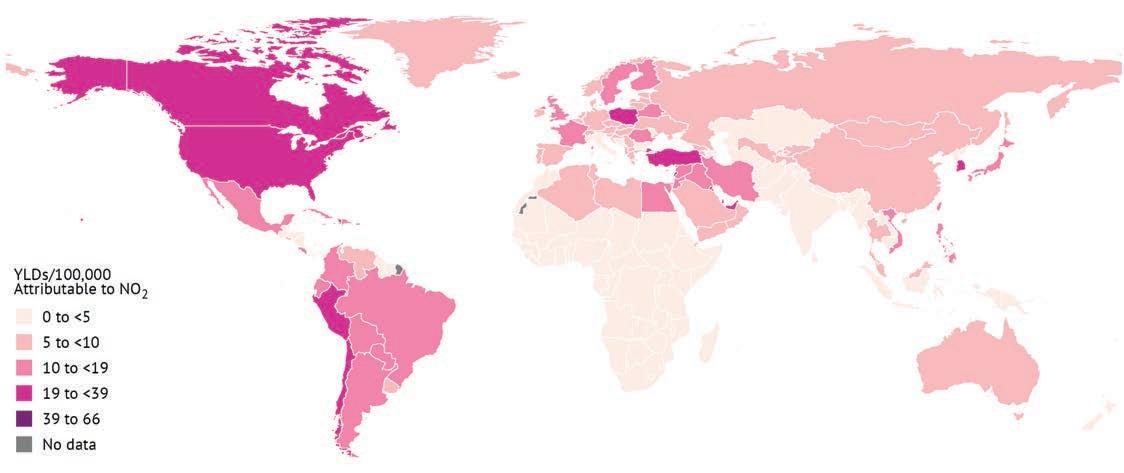
Nitrogen dioxide (NO2) is a gaseous air pollutant that is mainly generated through the burning of fuel in vehicles, power plants, and industrial facilities It belongs to a group of reactive gases known as nitrogen oxides and is often used as an indicator for this group and for the broader traffic-related air pollution mixture . Because traffic is a major source of NO2, its concentration is typically highest in urban areas and is considered a marker for the broader trafficrelated air pollution mixture . In addition to traffic, agriculture is another important source of nitrogen oxides For the GBD study, exposure to NO2 is defined as the population-weighted annual average concentration of NO2 The concentrations are measured in micrograms of particulate matter per cubic meter of air, or µg/m3 NO2 exposure has been linked to a variety of health effects, including asthma and other respiratory diseases In addition, nitrogen oxides contribute to the formation of other pollutants, including ozone and secondary particulate matter As a result, an increase in NO2 pollution can mean that these other forms of pollution — and their associated health effects — will get worse NO2 reacts with other pollutants and dissipates more quickly compared with PM2 5 Therefore, NO2 levels can vary dramatically hour by hour and across different neighborhoods within a city Pinpointing the traffic patterns and other factors that lead to spikes in NO2 pollution can help cities identify effective ways to control NO2 and reduce exposures
High-income countries see some of the highest levels of NO2, a pollutant that is most common in cities.
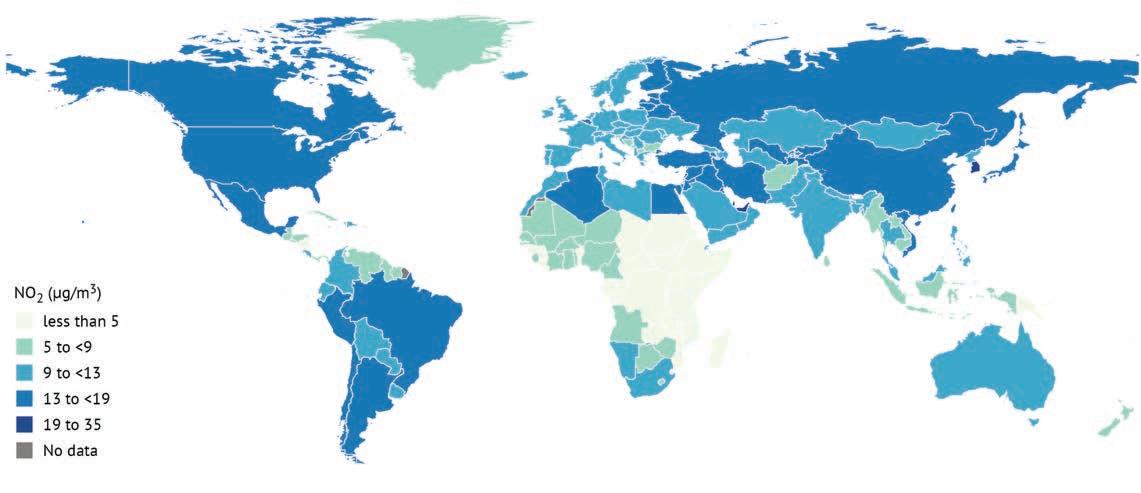
FIGURE 5. Global map of national population-weighted annual average NO2 concentrations in 2020 . Visit stateofglobalair.org to explore the data for your country or region
STATE OF GLOBAL AIR 2024 11
D
DIG
EEPER
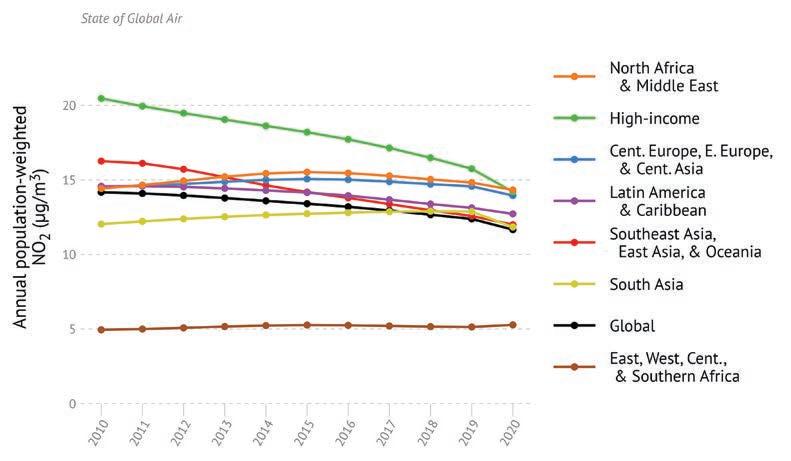
FIGURE 6. Trends in population-weighted annual average NO2 concentrations globally and in the GBD Super Regions, 2010–2020 Visit stateofglobalair.org to explore the data for your country or region
In contrast to PM2 5, some of the highest levels of NO2 pollution are seen in high-income countries The highest exposures to NO2 are seen in North Africa and the Middle East (26 .8 µg/m3), high-income countries (26 6 µg/m3), and in Central and Eastern Europe and Central Asia (26 1 µg/m3) (Figure 5) 55% of 194 countries do not yet meet the annual WHO AQG of 10 µg/m3, resulting in 42% of the world’s population being exposed to NO2 levels above the annual guideline value . Seven of the ten countries with the highest NO2 exposures are in the Middle East including Bahrain, Qatar, Kuwait, Lebanon, and the United Arab Emirates Russia and Turkey also experience high NO2 levels
Unlike PM2 5, the highest exposures to NO2 are seen in countries with a high socio-development index, or SDI Examples include Singapore, Japan, and Canada, all of which experience high exposures to NO2 . Thus, while the average NO2 exposure in countries with high SDI is 25 .5 µg/m3, the exposures are as low as 6 5 µg/m3 in countries with low SDI However, high-income countries are also experiencing a rapid decline in NO2 exposures over time as a result of sustained policy action and technological advancements (Figure 6)
Expressed on a scale of 0 to 1, SDI combines rankings of (1) the income per capita, (2) average educational attainment (mean education for those ages 15 and older), and (3) fertility rates (number of births per woman) of all areas in the GBD study and is an indicator of where countries sit in the spectrum of development .
OZONE
Ground-level, or tropospheric, ozone is a pollutant that harms human health, damages plants, and contributes to climate change . Globally, ozone levels are estimated to be 30%–70% higher today than they were 100 years ago This trend reflects rising emissions of the chemicals that form ozone as well as rising temperatures . Ozone is not released directly into the air but is formed through
chemical interactions between nitrogen oxides and volatile organic compounds (VOCs) in the presence of sunlight . The burning of fossil fuels in vehicles, power plants, factories, and homes and through industrial activities (such as oil and gas extraction and processing) produce precursor chemicals . Some VOCs also come from natural sources, such as trees . At the local level, ozone concentrations can vary widely from place to place Although ozone is often more concentrated around urban areas where emissions of its precursor chemicals tend to be highest, it can also travel long distances to suburban and rural areas and across national borders Ozone concentrations are measured in parts per billion (ppb) For the GBD study, exposure to ozone is defined as the population-weighted average 8-hour daily maximum concentration in the warmest six months of the year, which is the measure of exposure used in many epidemiological studies of ozone’s health effects and the annual WHO Air Quality Guidelines . Note that this ground-level ozone is different from stratospheric ozone, which is known to be protective against ultraviolet radiation .
Heat waves can worsen ozone pollution, threatening human health and crop yields.
The climate penalty. The chemical reactions that form ozone increase when the air is warmer, resulting in higher ozone pollution during heatwaves Studies have documented spikes in ozone pollution occurring around the same time as heatwaves in China and Europe Ozone is also a greenhouse gas
Exposure to ozone is associated with an increased risk of both acute and chronic respiratory illnesses, such as COPD Because of its effects on plants, ozone can also reduce crop yields and harm biodiversity, threatening food security and therefore nutrition for millions of people For example, it is estimated that 16.8 million metric tons of wheat will be lost in Europe in 2050 as a result of ground-level ozone .
Ozone Trends
In 2020, ozone exposures varied from a low of about 11 .4 ppb to a high of 67 6 ppb around the world, with a global average of 49 8 ppb (Figure 7) Countries with the highest average ozone exposures in 2020 were in the Middle East (Qatar, Bahrain, Kuwait, Saudi Arabia, and Iraq), South Asia (Nepal, India, Bangladesh, and Pakistan), and East Asia (Republic of Korea) Small tropical island states were among the countries with the lowest ozone exposures
Tracking progress: In 2020, 93% of the world’s population lived in areas with peak-season ozone levels higher than the WHO AQG for peakseason ozone (60 µg/m3 or 31 ppb) In addition, the proportion of the
12 STATE OF GLOBAL AIR 2024
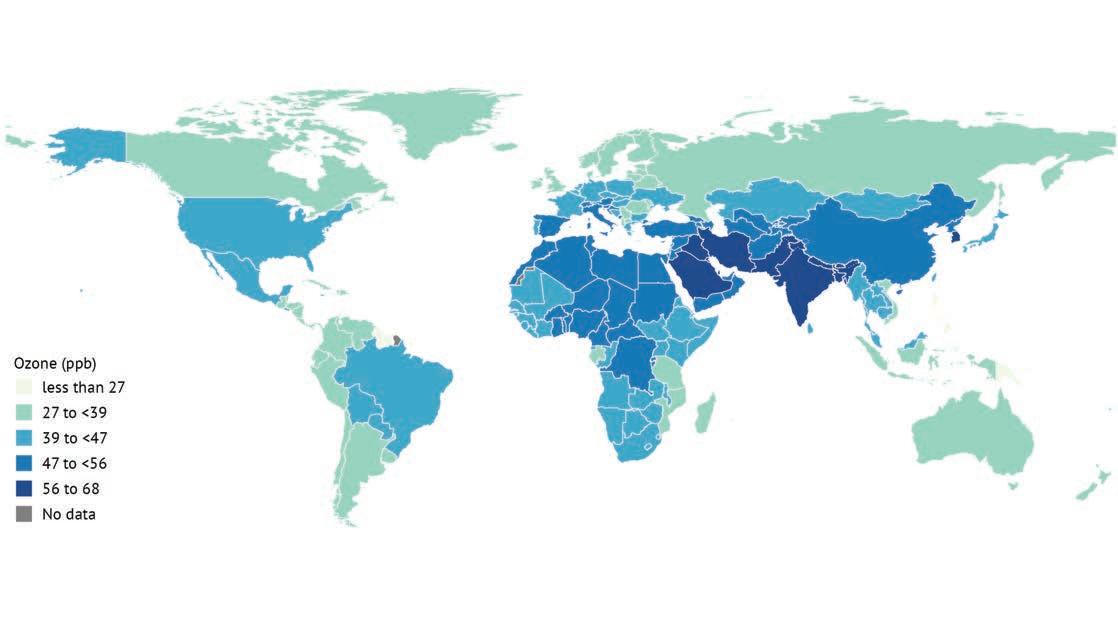
FIGURE 7. Global map of national population-weighted average seasonal 8-hour daily maximum ozone concentrations in 2020 Visit stateofglobalair.org to explore the data for your country or region population experiencing high ozone exposures is increasing in many regions of the world . For example, countries including India, Nigeria, Pakistan, and Brazil have experienced increases of more than 10% in ambient ozone exposures in the last decade (Figure 8) These trends reflect a combination of factors, including increased emissions of ozone precursors (such as nitrogen oxides, methane, and nonmethane VOCs) with industrialization and economic development, coupled with warmer temperatures Also, exposures can be higher than national averages, especially in urban areas, particularly during warmer months
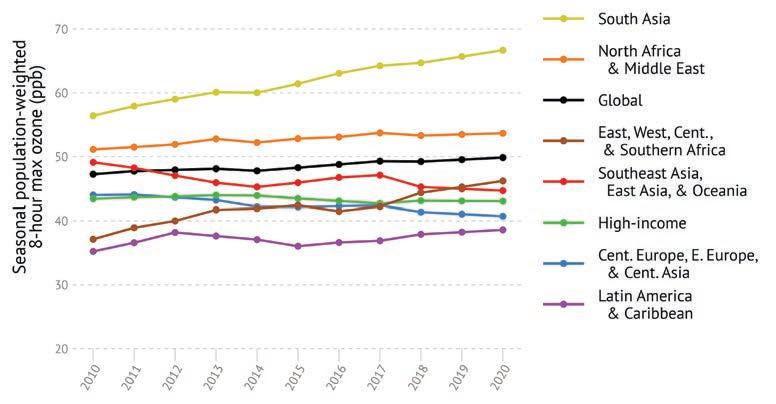
8. Trends in population-weighted average seasonal 8-hour maximum ozone concentration globally and in the GBD Super Regions, 2010–2020
STATE OF GLOBAL AIR 2024 13
FIGURE
AIR POLLUTION’S BURDEN OF DISEASE
Air pollution was the second leading risk factor for early death worldwide in 2021, surpassed only by high blood pressure.
Exposure to air pollution is associated with impacts on every major organ system in humans To inform actions that can save lives, it is critical to understand the risks faced by particular groups, the impacts of different pollutants, and the changes over time Over many decades, scientific studies have documented a wide range of health effects from air pollution While high-pollution days can have short-term effects, like aggravating asthma symptoms, and lead to temporary spikes in hospitalizations for heart or lung problems, the most severe impacts are caused by long-term exposures Breathing polluted air for months or years can lead to illness and early death from heart and lung diseases and diabetes as well as increase the likelihood of adverse birth outcomes, including preterm births, stillbirths, and miscarriages . New studies continue to broaden our understanding of air pollution’s effects throughout the lifespan, but the bottom line is clear: air pollution exacts a devastating toll on health around the globe
The GBD project relies on epidemiological studies and other evidence to estimate the burden of disease from air pollution in terms of deaths and the years of healthy life lost in every country of the globe (see Appendix) Ongoing studies continue to explore air pollution’s role
in the development of other diseases including tuberculosis, chronic kidney disease, and neurodegenerative diseases (e g , Alzheimer’s disease), not currently included in GBD estimates . The GBD study will continue to evaluate the changing evidence, and these diseases may be considered for inclusion in the GBD study in the future
THE GLOBAL BURDEN OF AIR POLLUTION
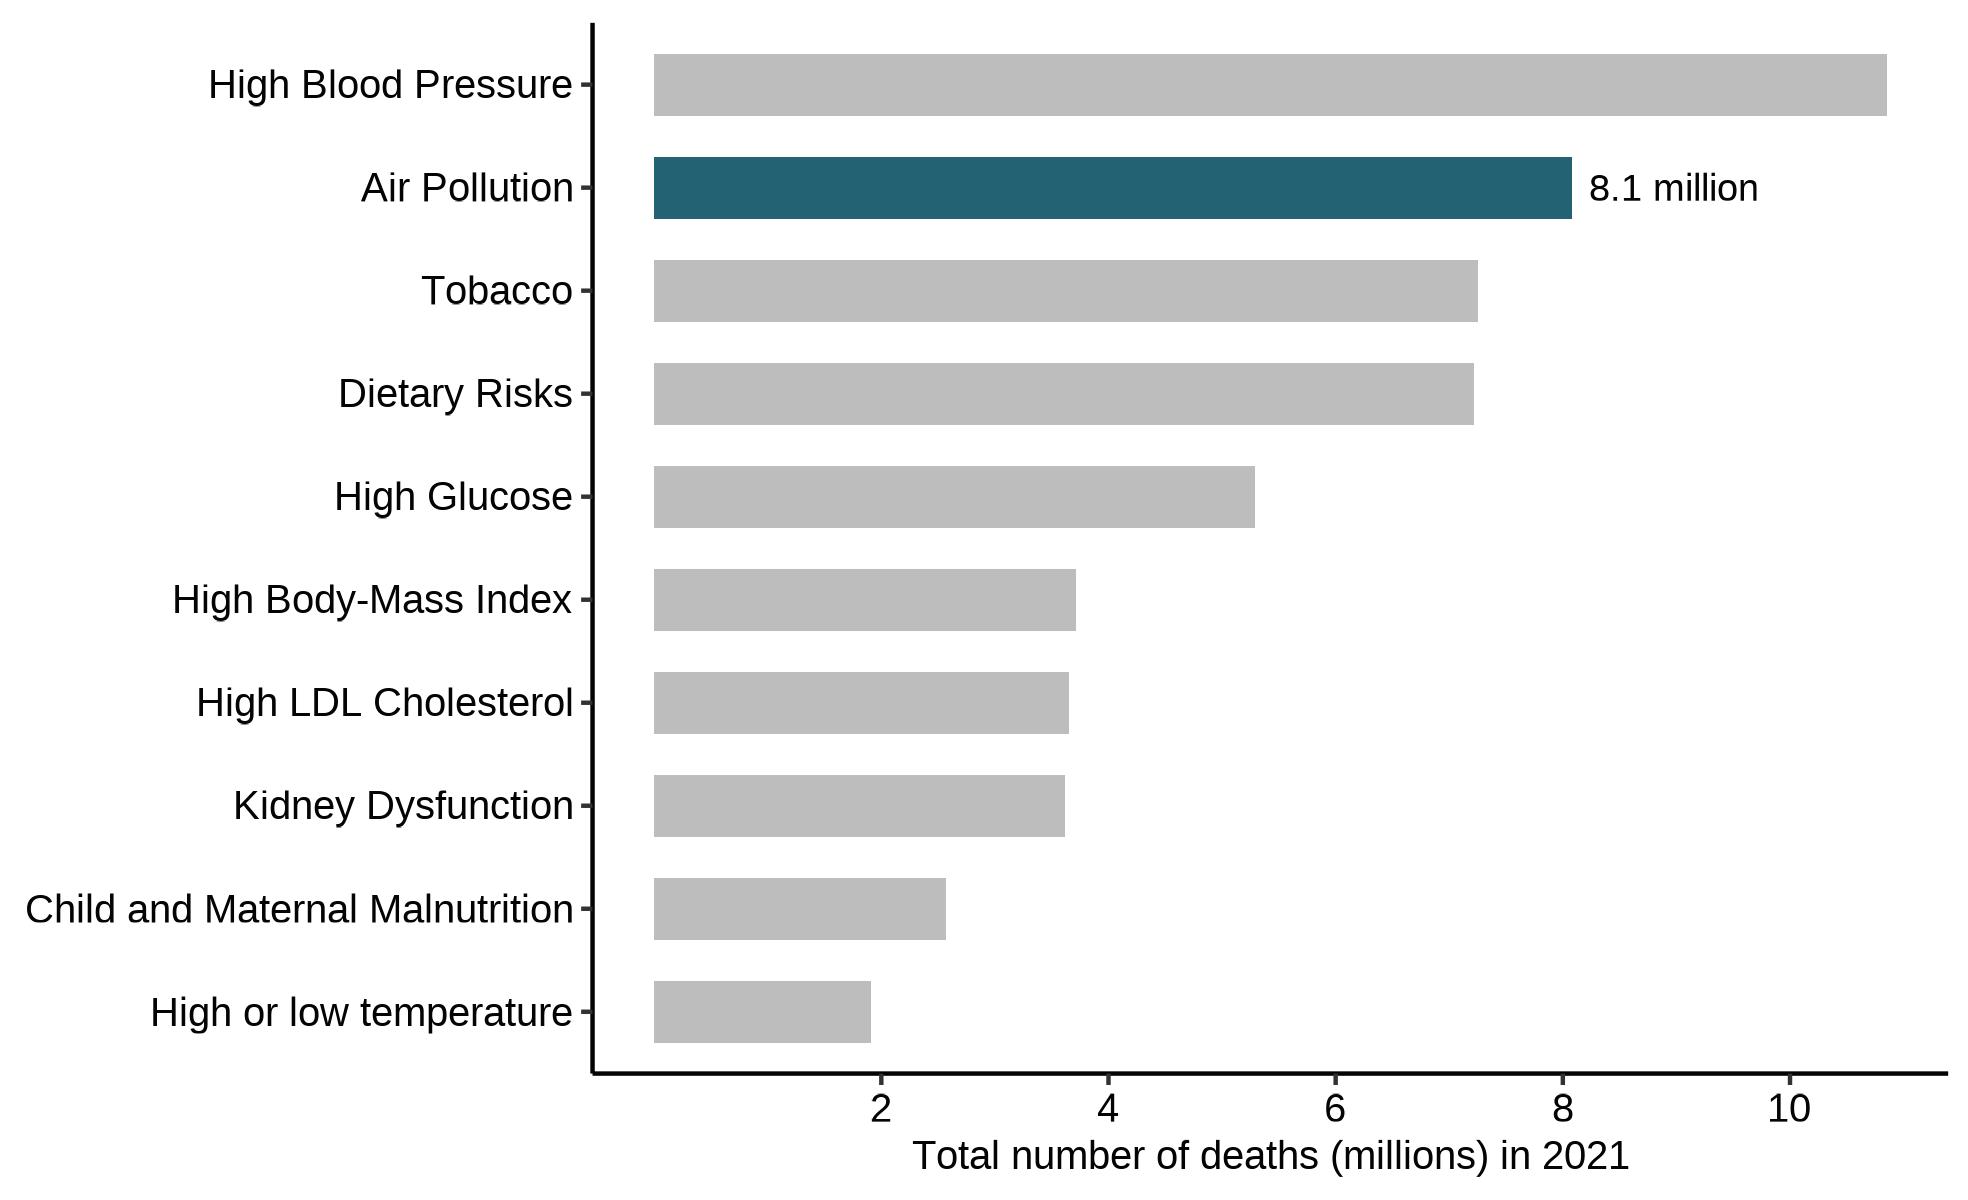
Taken together, air pollution from PM2 5 and ozone was estimated to contribute to 8 1 million deaths [95% UI: 6 7–9 5] — about 12% of the total global deaths — in 2021 (Figure 9) . In fact, PM2 5 (both ambient and household together) is the largest contributor to the air pollution disease burden worldwide, accounting for 7 8 million deaths, or more than 90% of the total air pollution disease burden Overall, 2021 saw more deaths linked to air pollution than were estimated for any previous year, indicating the disease burden of air pollution has continued to rise Nearly 490,000 (95% UI: 107,000–837,000) deaths were attributable to ozone Countries in South Asia and East, West, Central, and Southern Africa experience the largest burden of disease linked to air pollution . With populations over 1 billion each, India (2 1 million deaths) and China (2 .3 million deaths) together account for 54% of the total global disease burden Other countries with high impacts include Pakistan (256,000 deaths), Myanmar (101,600 deaths), and Bangladesh (236,300 deaths) in South Asia; Indonesia (221,600 deaths), Vietnam (99,700 deaths), and the Philippines (98,209 deaths) in Southeast Asia; and Nigeria (206,700 deaths) and Egypt (116,500 deaths) in Africa Age-standardized deaths are also high in many of the same countries and regions where total numbers of deaths are high In the last two decades, most regions have experienced declines in the air pollution burden when looking at agestandardized death rates (Figure 10) In some cases, the total number of deaths continues to increase The differences in these trends hint at competing factors that influence the burden of disease . Although the declines in age-
Exposure to air pollution is linked to 1 in 8 deaths worldwide.
Explore
rankings fur
FIGURE
9. Global ranking of risk factors by total number of deaths in 2021
the
ther via GBD Compare
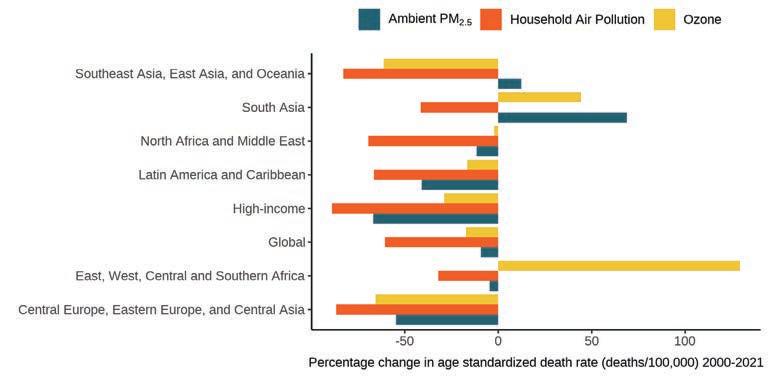
FIGURE 10. Percent change in age-standardized death rates in the GBD Super Regions, 2000–2021. Note that while the percentage change in age-standardized death rate for household air pollution (HAP) was the highest in high-income countries, the overall magnitude of HAP-linked burden of disease is much smaller in those countries.

FIGURE 11. Distribution of global deaths in 2021 attributable to ambient PM2 5, ozone, and household air pollution, by age Much of the disease burden of air pollution falls on older populations because aging is a risk factor for noncommunicable diseases.
standardized rates can reflect improvements in the treatment of and survival from underlying diseases (e .g , COPD, diabetes), the increase in the number of deaths reflects the important role of growth and aging in populations
The Youngest and Oldest Experience the Highest Impacts
With respect to deaths, air pollution takes its greatest toll on people ages 50 and older (Figure 11), who suffer the highest burden from noncommunicable diseases related to air pollution, such as COPD, diabetes, stroke, and heart disease When considering household air pollution, the burden also heavily impacts the youngest children, newborns, and children under five For more, turn to the Air Pollution and Children’s Health section on page 11
DISEASE BURDEN OF PM2.5
PM2 5 air pollution is the largest driver of air pollution’s burden of disease worldwide Long-term exposure to PM2 5 pollution is associated with illness and early death from diseases, including heart disease, lung cancer, COPD, stroke, type 2 diabetes, lower respiratory infections (such as pneumonia), and adverse birth outcomes . It is estimated that ambient PM2 5 and household air pollution (i e , household PM2 5) together contributed to 7.8 million deaths globally in 2021, with ambient PM2 5 accounting for 4 .7 million [95% UI: 3 .5–5 .8] deaths and household air pollution accounting for 3 1 million [95% UI: 1 9–5 2] Of all the deaths attributable to ambient PM2 5 in 2021, heart-disease-related deaths were linked to 19% of the total deaths, ~1 .5 million .
The disease burden linked to ambient PM2 5 and household air pollution varies widely around the globe This variation reflects different patterns of pollution exposure as well as differences in age demographics and underlying health factors Overall, the regions that bear the highest burden from ambient PM2 5 include Southeast Asia, East Asia, and Oceania (91 4 deaths/100,000 people); South Asia (85 1/100,000); and North Africa and the Middle East (103/100,000) (Figure 12) . In the above cases, rates are almost two times higher than global averages for ambient PM2 5 exposure (57 6/100,000) The age-standardized death rate — that is, the number of deaths per 100,00 people — is a useful metric for comparing the burden of disease attributable to a particular risk factor across countries or regions because it factors in population age structure and size
DIG D EEPER
For more on the short- and long-term health effects of air pollution, who is affected, and what the science shows, see our factsheet on Air Pollution and Your Health.
STATE OF GLOBAL AIR 2024 15
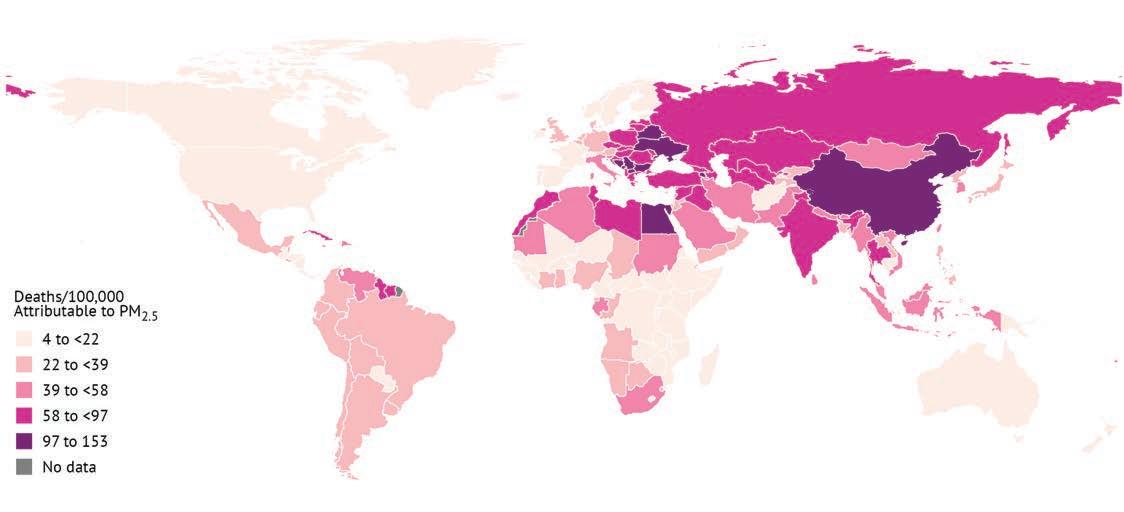
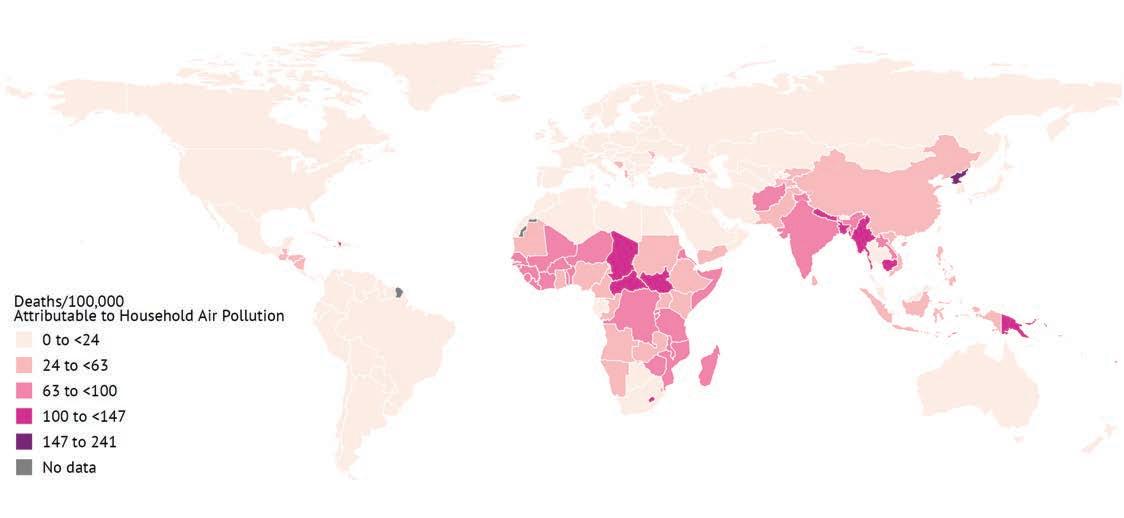
FIGURE 12. Global map of age-standardized rates of death attributable to (a) ambient and (b) household air pollution in 2021 Visit stateofglobalair.org to explore the data for your country or region
In 2021, particulate matter air pollution (i.e., ambient and household PM2.5) was the leading contributor to total DALYs followed by high blood pressure, smoking, low birth weight, and short gestation.
Over the past decade, the global disease burden linked to ambient PM2 5 has increased This reflects a greater impact on aging populations and increased global exposure than decreases in disease rates for those affected by PM2 5 Overall, changes in population size
and age structure have the largest impacts on these trends Even if exposures to air pollution are decreasing, the overall attributable burden of disease can increase if a population is growing faster than exposures are falling Similarly, a population that is aging will likely face a higher burden of disease because older people develop, and are more susceptible to, diseases linked with air pollution
In the case of household air pollution, South Asia and East, West, and Southern Africa experience age-standardized death rates (respectively 109 deaths/100,000 and 130 deaths/100,000) almost double the global average (39 4 deaths /100,000) (Figure 13) For household air pollution exposures, another disease contributing to the health impacts is cataracts In 2021, cataracts from exposure to
16 STATE OF GLOBAL AIR 2024
(b) Household PM2 5
(a) Ambient PM2 5
household PM2 5 resulted in 1 9 million years lived with disability (YLD), affecting both productivity and quality of life Cataracts are among the major causes of vision loss, and several studies in LMICs have linked exposure to household air pollution with cataracts
Since 2000, there has
been a 61% reduction in the age-standardized death rate from household air pollution.
The reduction in death rate from household air pollution has happened in part due to efforts to expand access to clean energy for cooking, including advancements in providing residents with grid electricity, cleaner-burning cookstoves, and cleaner fuels (such as liquified petroleum gas) under the UN Sustainable Development Goal (SDG) target 7.1 .2 (ensure access to clean energy in homes) The reduction in deaths can also be credited to improvements in nutrition
and access to healthcare, including vaccination and treatment
Despite notable progress, access to clean energy remains limited in South Asia and parts of Africa, where hundreds of millions of people still rely on solid fuels for cooking and heating The still large burden of disease also underscores the continuing importance of household air pollution not only among environmental risk factors, but also compared with diet, lifestyle, and other modifiable factors that influence health
DISEASE BURDEN OF NITROGEN DIOXIDE
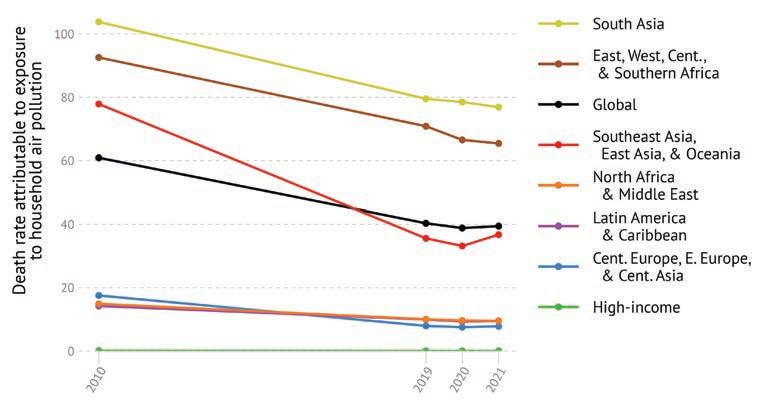
FIGURE 13. Trends in age-standardized deaths/100,000 rate attributable to household air pollution in the GBD Super Regions 46% of the deaths linked to household air pollution were in South Asia, 26% were in Southeast and East Asia and Oceania, and 24% were in East, West, Central, and Southern Africa .
There is a large and growing body of scientific evidence linking NO2 pollution with a variety of health effects Shor t-term exposure to NO2 can irritate the airways and aggravate existing respiratory diseases For people with asthma, NO2 exposure is associated with more frequent and severe asthma symptoms and a greater risk of hospitalization Studies also have suggested that exposure to NO2 pollution can impair lung development, intensify allergies, and make people more susceptible to respiratory infections, and several large studies indicate that children exposed to NO2 pollution are at a greater risk of developing asthma In the GBD, NO2 is linked to the development of childhood asthma In 2021, exposure to NO2 was linked to 177,000 DALYs, or 177,000 healthy years of life lost for children and adolescents For more, turn to the Air Pollution and Children’s Health section on page 21
COVID-19
and Air Pollution: Four Years Later, What Do We Know?
Decades of research have linked air pollution exposure with an increased risk of respiratory infections As the COVID-19 pandemic progressed, early studies on air pollution and COVID-19 (a respiratory virus) suggested potential associations; however, the nature of the global pandemic introduced many biases and issues with the initial wave of published research . Now, four years later, a growing body of research has shown that exposure to air pollution can contribute to the risk of infection, to having more severe outcomes, and also to increased risk of death due to COVID-19 Newly published studies also have suggested that exposure to NO2 or PM2 5 is associated with an increased risk of COVID-19 incidence among people with lower socioeconomic status compared to others Researchers around the world continue to study the lasting impacts of COVID-19 One area of interest continues to be in the susceptibility factors to COVID-19, specifically in population-level exposure to air pollution .
How Does Air Pollution Worsen COVID-19 Outcomes?
Exposure to air pollution decreased the immune's system's ability to fight off infection leading to the easier penetration of respiratory viruses in humans .
Air pollution causes inflammation and oxidative stress in lungs By weakening the respiratory system, air pollution could increase the severity of SARSCoV-2 pneumonia
Air pollution's impact on the cardiovascular and metabolic system can worsen the course and outcome of COVID-19 patients
STATE OF GLOBAL AIR 2024 17
While NO2 may not be the main or only driver of these health effects, it is considered to be a good proxy for exposure to traffic-related air pollution in urban settings A recent comprehensive review from the Health Effects Institute expressed a high level of confidence that strong connections exist between long-term exposure to trafficrelated air pollution and early death due to cardiovascular diseases A strong link was also found between traffic-related air pollution and deaths from lung cancer, asthma onset in children and adults, and acute, lower respiratory tract infections (LRIs) in children
DISEASE BURDEN OF OZONE
Short-term exposure to ozone is linked to asthma exacerbation and other respiratory problems Long-term exposure to ground-level ozone is linked with the development of COPD in adults, a progressive and debilitating disease that makes breathing harder; COPD is a major global cause of death and disability In 2021, long-term exposure to ozone contributed to an estimated 490,000 deaths (95% UI: 107,200–837,000) from COPD worldwide, accounting for 13% (95% UI: 2 9%–22%) of all COPD deaths globally . This loss of life equates to 8 .7 million 13% of all COPD deaths globally This loss of life equates to 8 7 million DALYs from COPD across the world
In 2021, nearly 50% of all ozone-related COPD deaths were in India (237,000 deaths) followed by China (125,600 deaths) and Bangladesh (15,000 deaths) Notably, the United States — partly due to its sizable population, widespread ozone pollution, and relatively high rates of COPD — saw 14,000 deaths in 2021, more than any other high-income country Since 2010, the overall number of ozone-linked COPD deaths
has increased by nearly 20%, and a similar pattern is seen for DALYs; as populations get older, the overall number of COPD deaths rises
Global patterns of ozone-attributable deaths generally mirror the global patterns of population-weighted seasonal ozone concentrations around the world (Figure 14) The disease burden attributable to ozone varies widely as a result of regional differences in ozone exposures, as well as underlying health and population characteristics There are also important regional differences South Asia and East, West, Central, and Southern Africa have seen an increase in the disease burden of ozone exposure in the last decade, while the burden has remained steady or decreased slightly in other regions (Figure 15)
Access to Clean Energy for All Can Create Cleaner Air for All
A lack of access to clean energy for cooking and heating can hinder economic growth and development, underscoring the
need to scale up energy production as well as energy access in countries across Africa and Asia In fact, countries in Africa have some of the lowest energy access rates in the world, with fewer than one in 20 people who live in the Democratic Republic of the Congo, Ethiopia, Madagascar, Mozambique, Niger, Uganda, and
Tanzania having access to clean fuels for cooking The solution to addressing household air pollution is simple and its impact is clear: improving access to clean cooking improves health Fur thermore, reducing the use of solid fuels for cooking can help reduce short-lived climate pollutants
Announced on the sidelines of the 28th Conference of the Parties (COP28) in 2023, the Africa Clean Cooking Consortium — a partnership between the African Development Bank, International Energy Agency, and Clean Cooking Alliance — is one among many examples of efforts underway to achieve the goal of universal access to clean cooking . Organizations including the WHO also have created tools to support countries in planning and implementing clean energy solutions One such example is the Clean Household Energy Solutions Toolkit (CHEST), which provides tools that countries and programs can use to develop policy action plans for expanding clean household energy access and use .

18 STATE OF GLOBAL AIR 2024
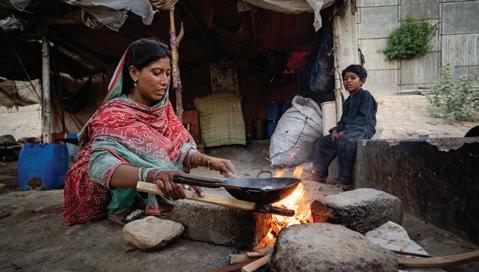
©
UNICEF/Junaid
Woman in Karachi, Pakistan cooking food on open fire
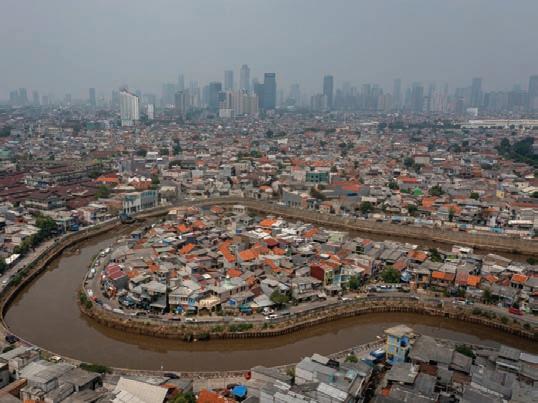
Styawan / Climate Visuals
Jakarta, Indonesia
Aji
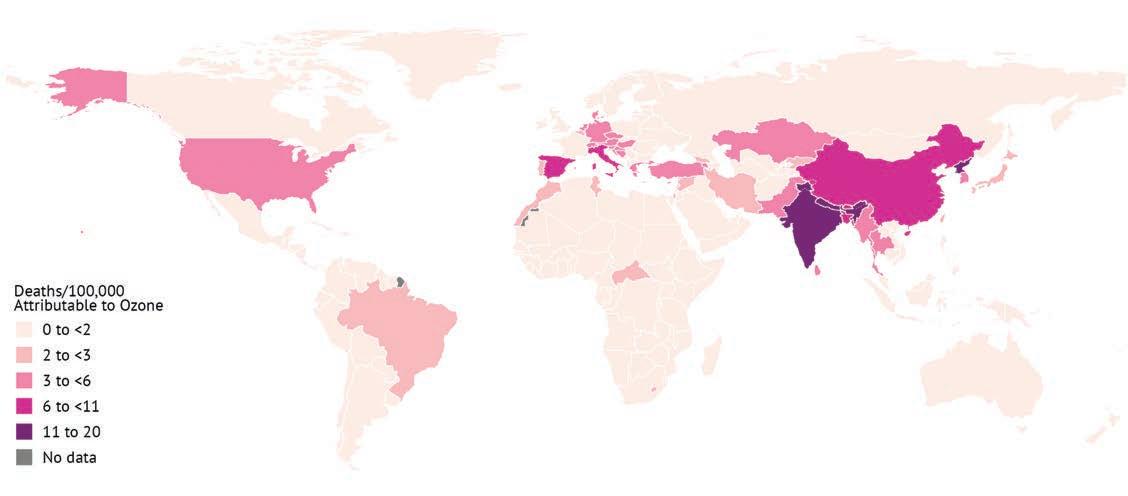
FIGURE 14. Global map of age-standardized rates of death attributable to ozone in 2021. Nearly 50% of the total ozone-related deaths occurred in India. Visit stateofglobalair.org to explore the data for your country or region
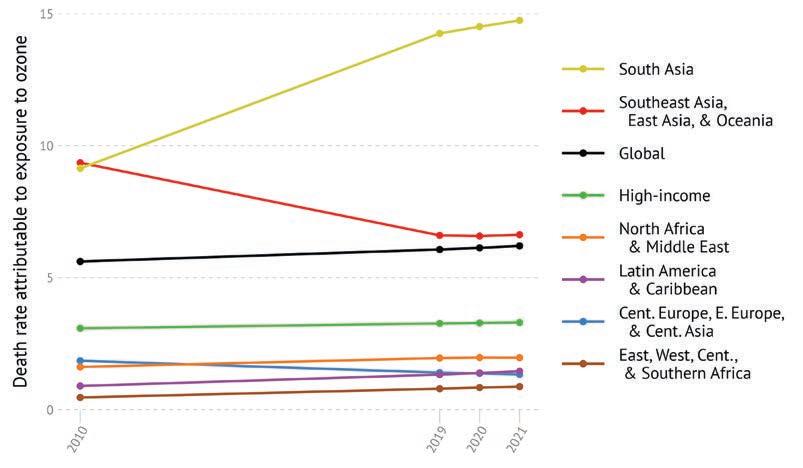
FIGURE 15. Trends in death rate (deaths/100,000) attributable to ozone in the GBD Super Regions in 2021 Visit stateofglobalair.org to explore the data for your country or region .
STATE OF GLOBAL AIR 2024 19
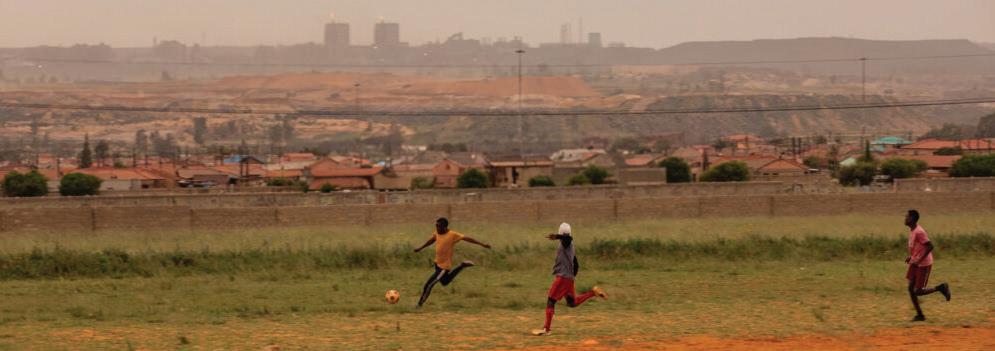
Children playing in smog, South Africa
Gulshan Khan / Climate Visuals
AIR POLLUTION AND CHILDREN’S
Children are the future; yet early exposure to air pollution poses a major threat to the well-being of children around the world Air pollution was the second leading risk factor for death among children under five in 2021, after malnutrition (Figure 16) The message from this is clear: Addressing air pollution is an essential step if we are to achieve the United Nations Sustainable Development Goal of substantially reducing under-5 mortality
More than 700,000 deaths in children under 5 years of age were from diseases linked to air pollution in 2021. Of this, over 500,000 deaths were linked to exposure to household air pollution.
There is a long way to go In 2021, a total of 709,000 (95% UI: 539,400–899,300) deaths in children under five were linked to air pollution; this represents 15% of all global deaths in children under five Of these, most (507,500 [95% UI: 365,700–694,400]) were linked to household air pollution from cooking with solid fuels, and 201,000 were linked to ambient PM2 5 (95% UI: 112,700–309,300) Among children 5–14 years of age, air pollution was linked to 16,600 deaths (95% UI: 2,400–27,600)
Why
Are
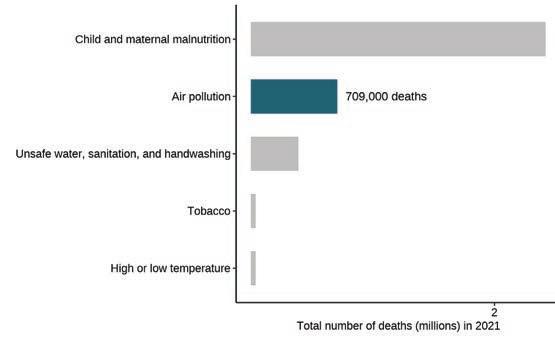
FIGURE 16. Global ranking of risk factors by total number of deaths among children under 5 in 2021
Explore the rankings fur ther via GBD Compare
IMPACTS ON NEONATAL HEALTH
Being exposed to air pollution in the womb increases the likelihood that a baby will be born too small (low birth weight) or too early (preterm birth) These conditions, in turn, make babies more susceptible to lower respiratory and other serious infections,
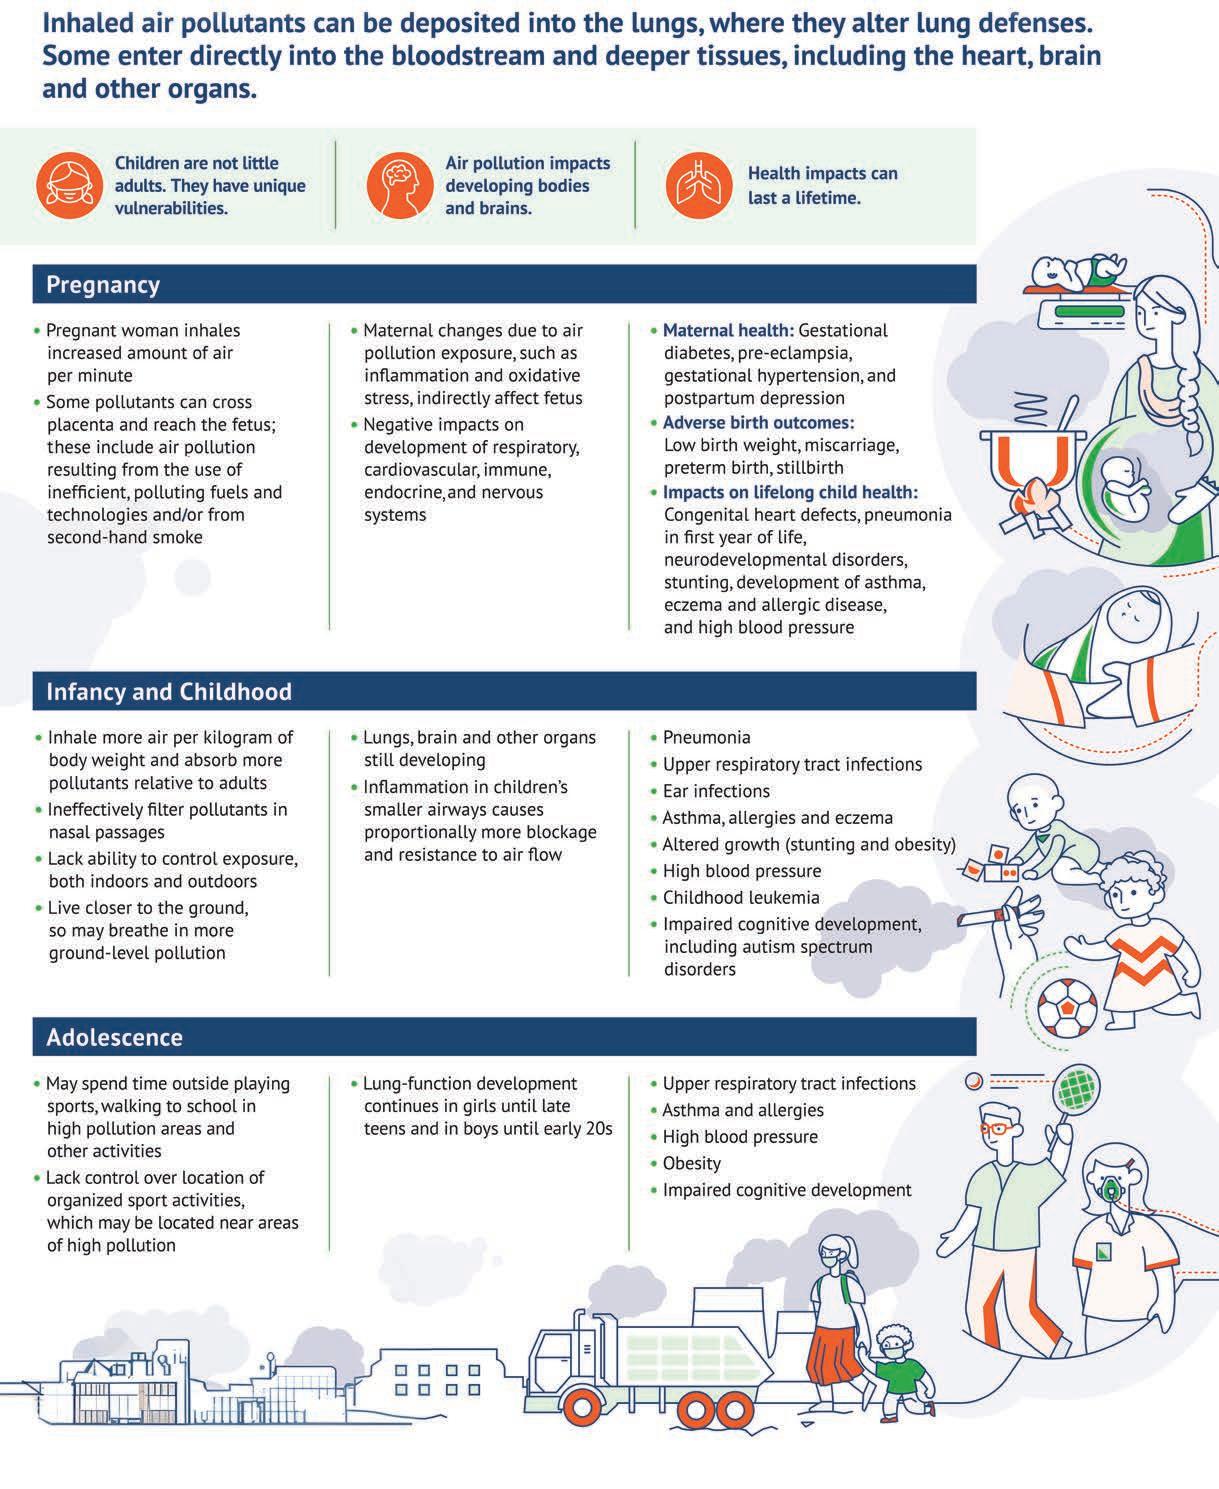
Children Uniquely Susceptible to the Effects of Air Pollution?
Children’s susceptibility to air pollution begins before birth Some pollutants can cross the placenta, resulting in fetus’s exposure to air pollution After birth, children face special risks from air pollution for two main reasons: first, they often take in more polluted air than adults, and second, the polluted air affects their health in different ways because their bodies are still developing Children breathe at a faster rate, often by mouth, which means they inhale more air than adults per kilogram of body weight Another reason is that they often spend more time outdoors and breathe air that is closer to the ground, which puts them in closer proximity to sources of pollution like dust and vehicle exhaust In many countries, infants and toddlers also have high exposure to household air pollution, often because caregivers must simultaneously care for children and cook family meals
and their immune systems are still developing; this means that their bodies are not equipped with the same defense mechanisms as adults Breathing even the same amount of pollution can result in worse impacts in children because children have smaller airway passages; thus, inflammation due to air pollutants creates proportionally more airway blockage than in adults In addition, pollution can interfere with a child’s growth and development, leading to lifelong impacts For example, exposures from the prenatal period through the toddler years can make a child more likely to develop cancer and other infectious and noncommunicable diseases later in life Children’s lungs also develop through adolescence, meaning that any impacts on lung growth because of air pollution can have lifelong consequences
Pollution also affects children’s bodies differently than it affects adults Children’s lungs, brains, and other organs are immature,
Due to a combination of exposure patterns and health vulnerabilities, many of air pollution’s harmful effects are amplified in children who live in communities that are socially or economically disadvantaged .
STATE OF GLOBAL AIR 2024 21
HEALTH
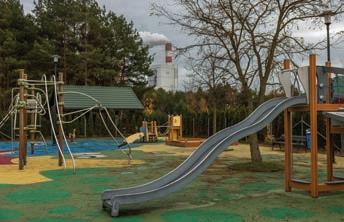
Anna Liminowicz / Climate Visuals
STATE OF GLOBAL AIR 2024 21
Playground near a power plant in Poland
diarrheal diseases, brain damage and inflammation, blood disorders, and jaundice If the babies survive infancy, they remain at a higher risk for LRIs, other infectious diseases, and major chronic diseases throughout life Exposure to air pollution during pregnancy has also been linked to miscarriage, stillbirths, and congenital disorders and anomalies The biological mechanisms linking air pollution exposure with these adverse birth outcomes are not fully understood, though the relationship is thought to involve pathways similar to those of tobacco smoking One plausible mechanism is that some pollutants, like carbon monoxide, may move across the membranes of the lungs and be carried to other parts of the body, affecting development of the placenta and the fetus Another is that pollutants may initiate systemic inflammation or oxidative stress that affects the health of both the pregnant woman and her baby
Preterm birth is the leading cause of death among children under five Countries with with low SDI experience the highest rates of low birth weight and preterm birth Air pollution likely plays a role in this, along with other factors such as malnutrition, low immunization coverage, other health problems, and other environmental exposures
The GBD study estimates the impact of exposure to ambient PM2 5 and household air pollution on infants’ health and survival in their first month of life (ages 0 to 27 days)
In 2021, 572,000 neonatal deaths (95% UI: 480,000–681,000) were linked to air pollution, representing 26% of the total newborn deaths 72% of this burden was due to exposure to household air pollution from cooking with solid fuels The highest impacts were seen in countries in Asia and Africa, where millions of households continue to rely on polluting energy sources for cooking (Figure 18) Both in South Asia and East, West, Central, and Southern Africa, 30% of all deaths in the first month after birth are linked to exposure to air pollution Since 2000, there have been improvements: death rates in newborns linked to household air pollution decreased by 46%, while death
rates linked to ambient PM2 5 decreased by 14% In 2021, 34% of the preterm births were linked to exposure to air pollution, resulting in more than 20 million years of healthy life lost with the largest impacts in South Asia (35% of preterm births linked to air pollution) and East, West, Central and Southern Africa (39 4%)
IMPACTS IN CHILDREN UNDER FIVE
Breathing polluted air early in life can have both immediate and longterm implications for a child’s health Air pollution affects children’s health through its role in pneumonia and other respiratory infections and allergic diseases In fact, LRIs are the leading cause of death for children under five . Exposure to air pollution can make a person more susceptible to infections in the lungs by causing inflammation and weakening the body’s defenses against viruses and bacteria
Household air pollution is an impor tant risk factor for pneumonia
Such infections during childhood can also result in long-term health effects, including impaired lung growth and a higher risk for chronic diseases later in life
Similar to impacts in newborns, deaths from LRIs attributed to air pollution are the highest in countries in Africa and Asia (Figure 19) . At the country level, the highest death rates from LRIs were seen in Chad (159 deaths/100,000 people), South Sudan (129 deaths/100,000 people), Central African Republic (128 deaths/100,000 people), Nigeria (109 deaths/100,000 people), Niger (108 deaths/100,000 people), Burkina Faso (108 deaths/100,000 people), and Papua New Guinea (107 deaths/100,000 people) In several countries in Africa (e g , Niger, Rwanda, Malawi, Senegal, Ethiopia, Uganda, and Mozambique) and in Asia (e g , Afghanistan, Bangladesh, and India), more than 40% of all deaths from LRIs in children under five are attributed to air pollution
The silver lining of these staggering numbers is that the global burden of disease for children under five attributable to air pollution has dropped steadily in the last few decades; since 2000, the death rate linked to air pollution in children under five has decreased by 53%
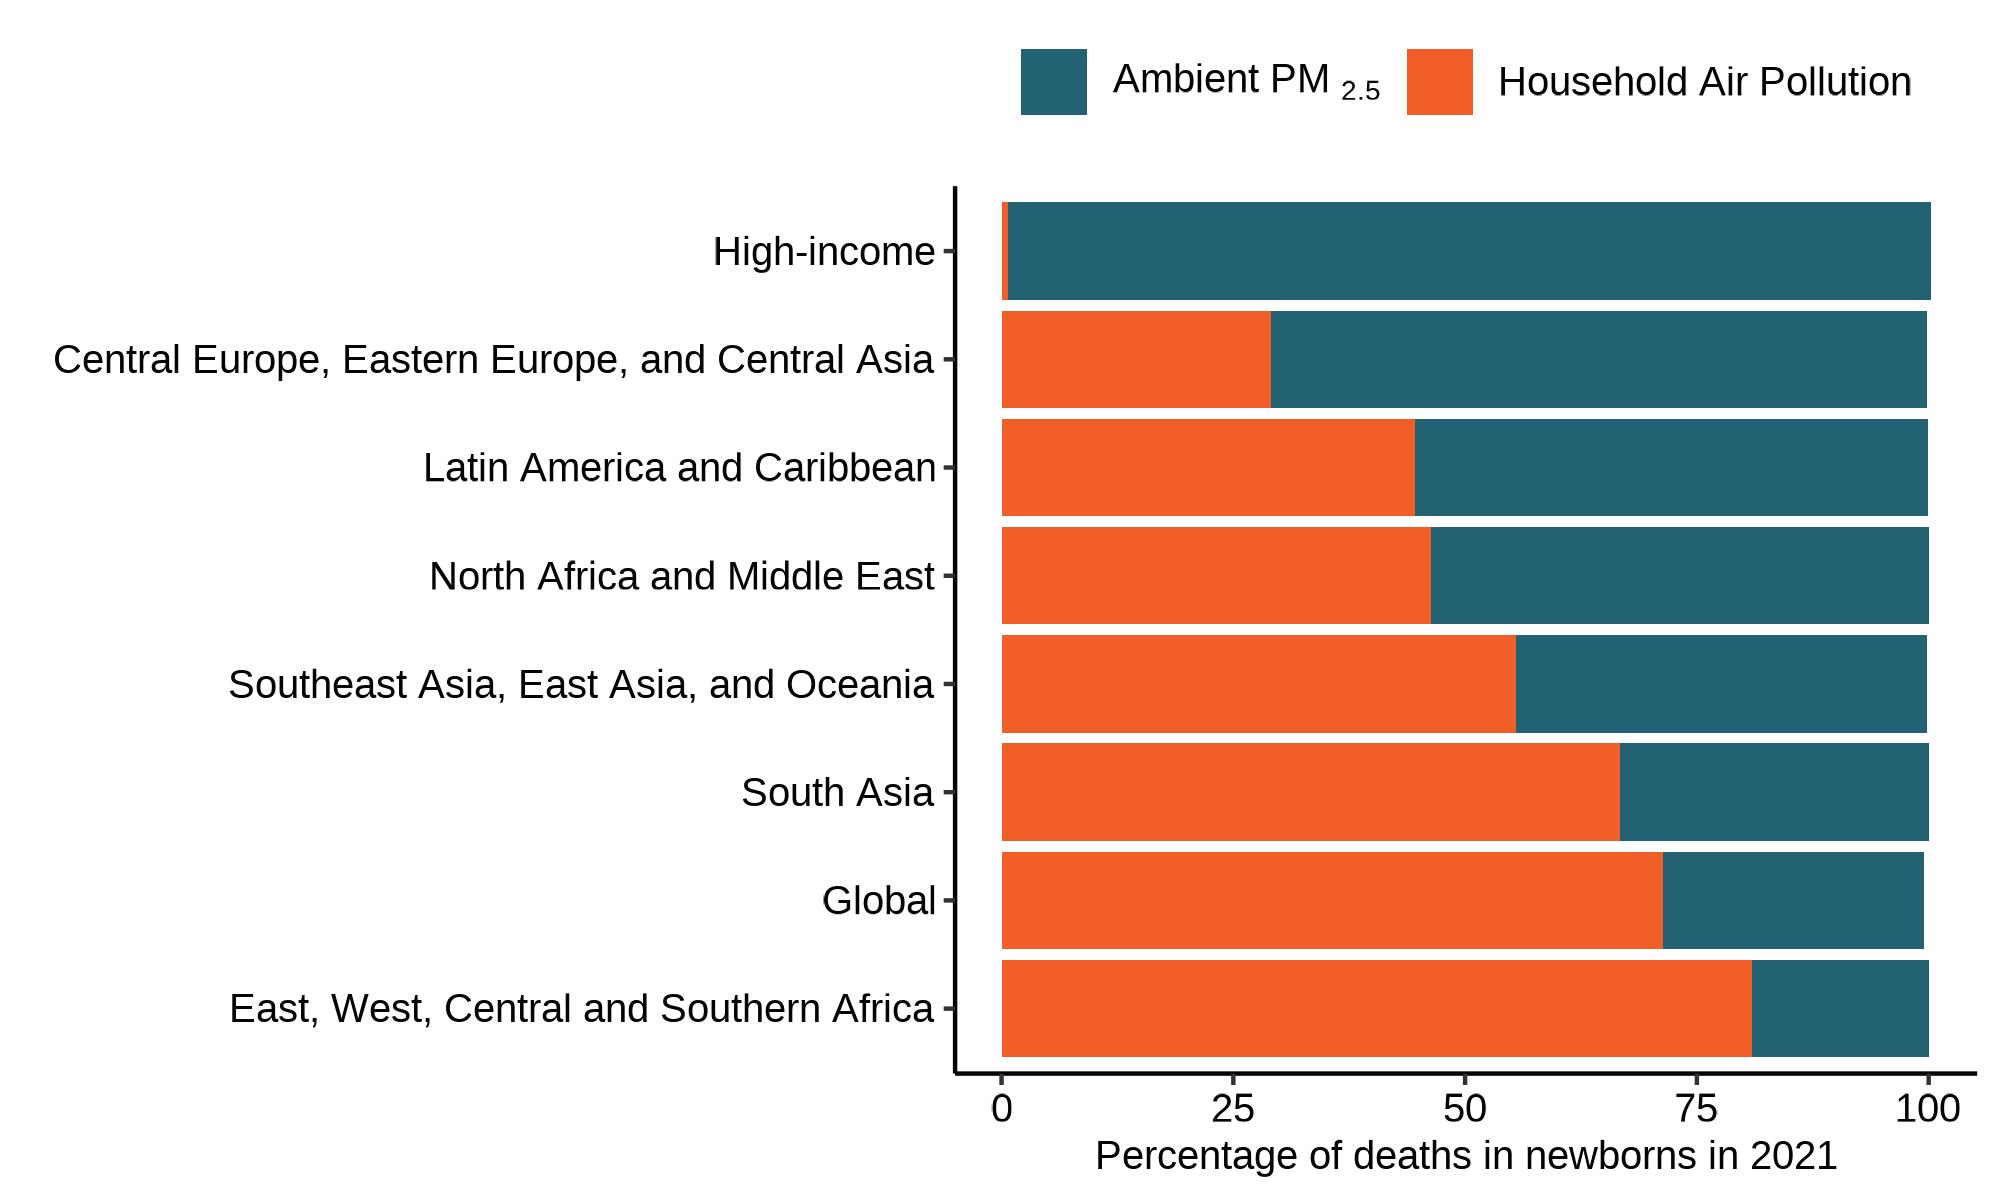
18. Relative (percentage) contribution of ambient and household air pollution to deaths in newborns in 2021 The number of newborn deaths linked to PM2 5 exposure in high-income countries is much lower than deaths in low- and middle-income countries
Effor ts to improve access to cleaner energy sources and reduce the reliance on burning solid fuels for cooking and heating — both in homes generally and in childcare and school settings specifically — have reduced children’s exposure to household air pollution and likely contributed to falling rates of childhood mortality in some places
To put this in context, since 2000, some of the largest reductions in disease burden were seen in the disease burden linked to unsafe water, sanitation, and handwashing (72% reduction in death rates since 2000), with significant implications for children’s health
22 STATE OF GLOBAL AIR 2024
FIGURE
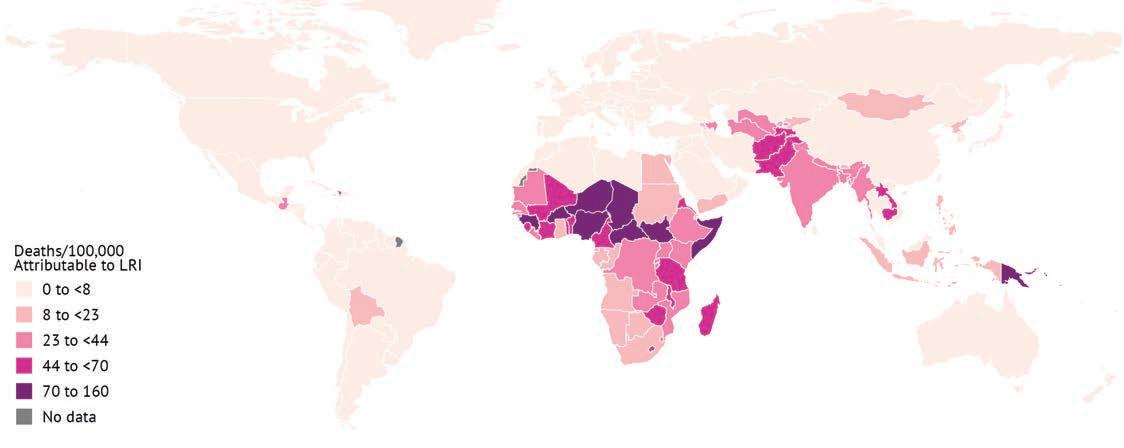
FIGURE 19. Global map of lower respiratory infection (LRI) death rates linked to air pollution for children under five in 2021
Visit stateofglobalair.org to explore the data for your country or region
In some countries in Africa and Asia, nearly 1 in every 3 lower respiratory infection deaths in children under 5 is linked to air pollution.
Despite this progress, however, pollution–related deaths among children under five have remained high in some regions, particularly in South Asia and East, West, Central, and Southern Africa (Figure 17) In 2021, India (169,400 deaths), Nigeria (114,100 deaths), Pakistan (68,100 deaths), Ethiopia (31,100 deaths), and Bangladesh (19,100 deaths) saw the largest numbers of air pollution–related deaths among these children
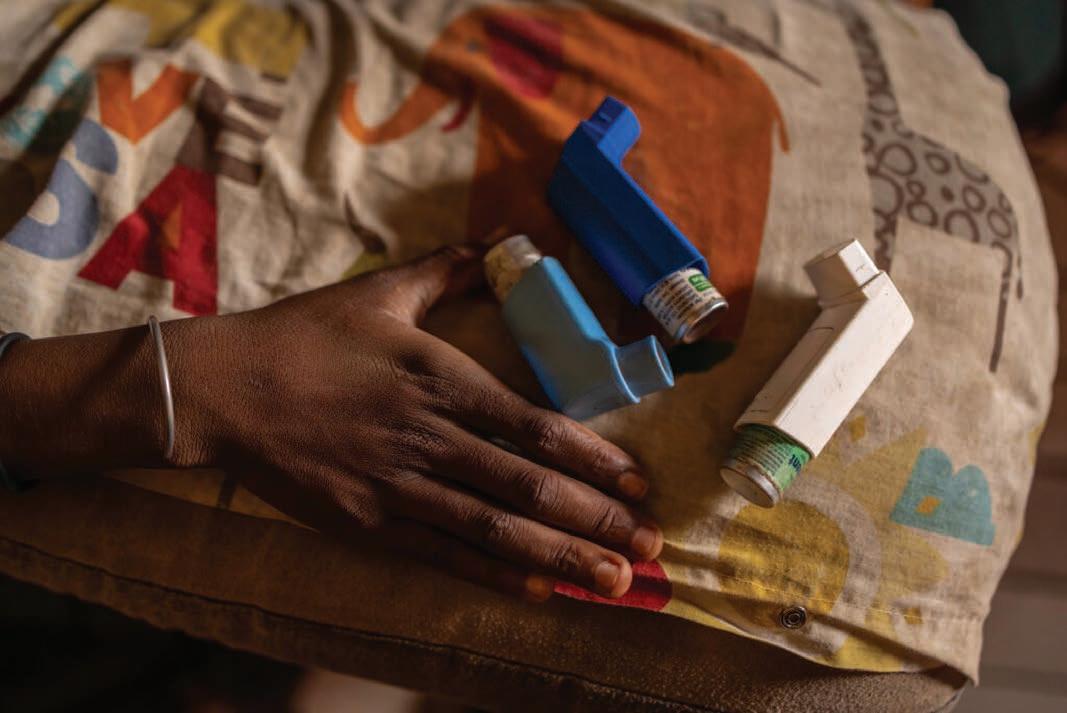
AIR POLLUTION AND CHILDHOOD ASTHMA
Some of the most well-studied impacts of pollution exposure in young children relate to asthma, the most common chronic respiratory disease in children People with asthma suffer symptoms such as wheezing, trouble breathing, chest tightness, and cough, sometimes in acute episodes or as “asthma attacks,” which can be life-threatening Air pollution’s impacts in terms of quality of life, medication costs, loss of school days, and frequent hospital visits impose substantial social and economic burdens on children, their families, and health systems In this context, it is important to note that asthma prevalence is not studied in nearly half of the countries, and in many LMICs, asthma diagnosis and treatment are not yet common In children who have an asthma diagnosis, there is strong evidence that breathing polluted air can worsen the symptoms and trigger asthma attacks In addition, a growing body of research suggests that being exposed to air pollution — particularly traffic-related air pollution — can increase a child’s chance of developing asthma in the first place
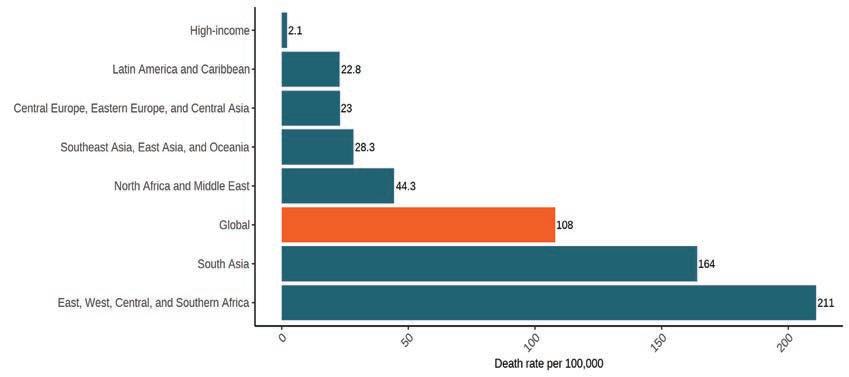
FIGURE 17. Death rate (number of deaths per 100,000) in children under 5 linked to air pollution across GBD Super Regions in 2021
Visit stateofglobalair.org to explore the data for your country or region
NO2 is the air pollutant most consistently related to asthma incidence in children, who often suffer years of poor health as a result All data reported here consider years lived in disability, that is, less than perfect health, in in 2021 For context, one YLD represents the equivalent of one full year of healthy life lost due to poor health In the case of asthma, global data suggest that the prevalence as well as severity
STATE OF GLOBAL AIR 2024 23
Air pollution–linked asthma has the highest health impacts on children between 5–14 years of age, especially in high-income countries.
of disease is often the highest among adolescents . In 2021, asthma linked to traffic-related air pollution exposure resulted in 42,300 years lived in disability (YLD) in children under five years, 105,300 YLDs in children between 5–14 years, and 29,100 YLDs in adolescents between 15–19 years Overall, 3 .9% of the asthma YLDs were attributed to exposure to NO2 globally in children between 5–14 years . The data are in line with estimates from the Global Asthma Report 2022, which reported highest rates of disease prevalence in adolescents, followed by children and adults YLD rates are the highest in high-income countries (21 5 deaths/ 100,000), followed by countries in Latin America and Caribbean (15 3 deaths/100,000) and North Africa and Middle East (10 6 deaths/ 100,000) (Figure 21) Broadly, the trends seen for asthma burden mirror the trends for NO2 exposures (see page 12) . In
GOOD NEWS!

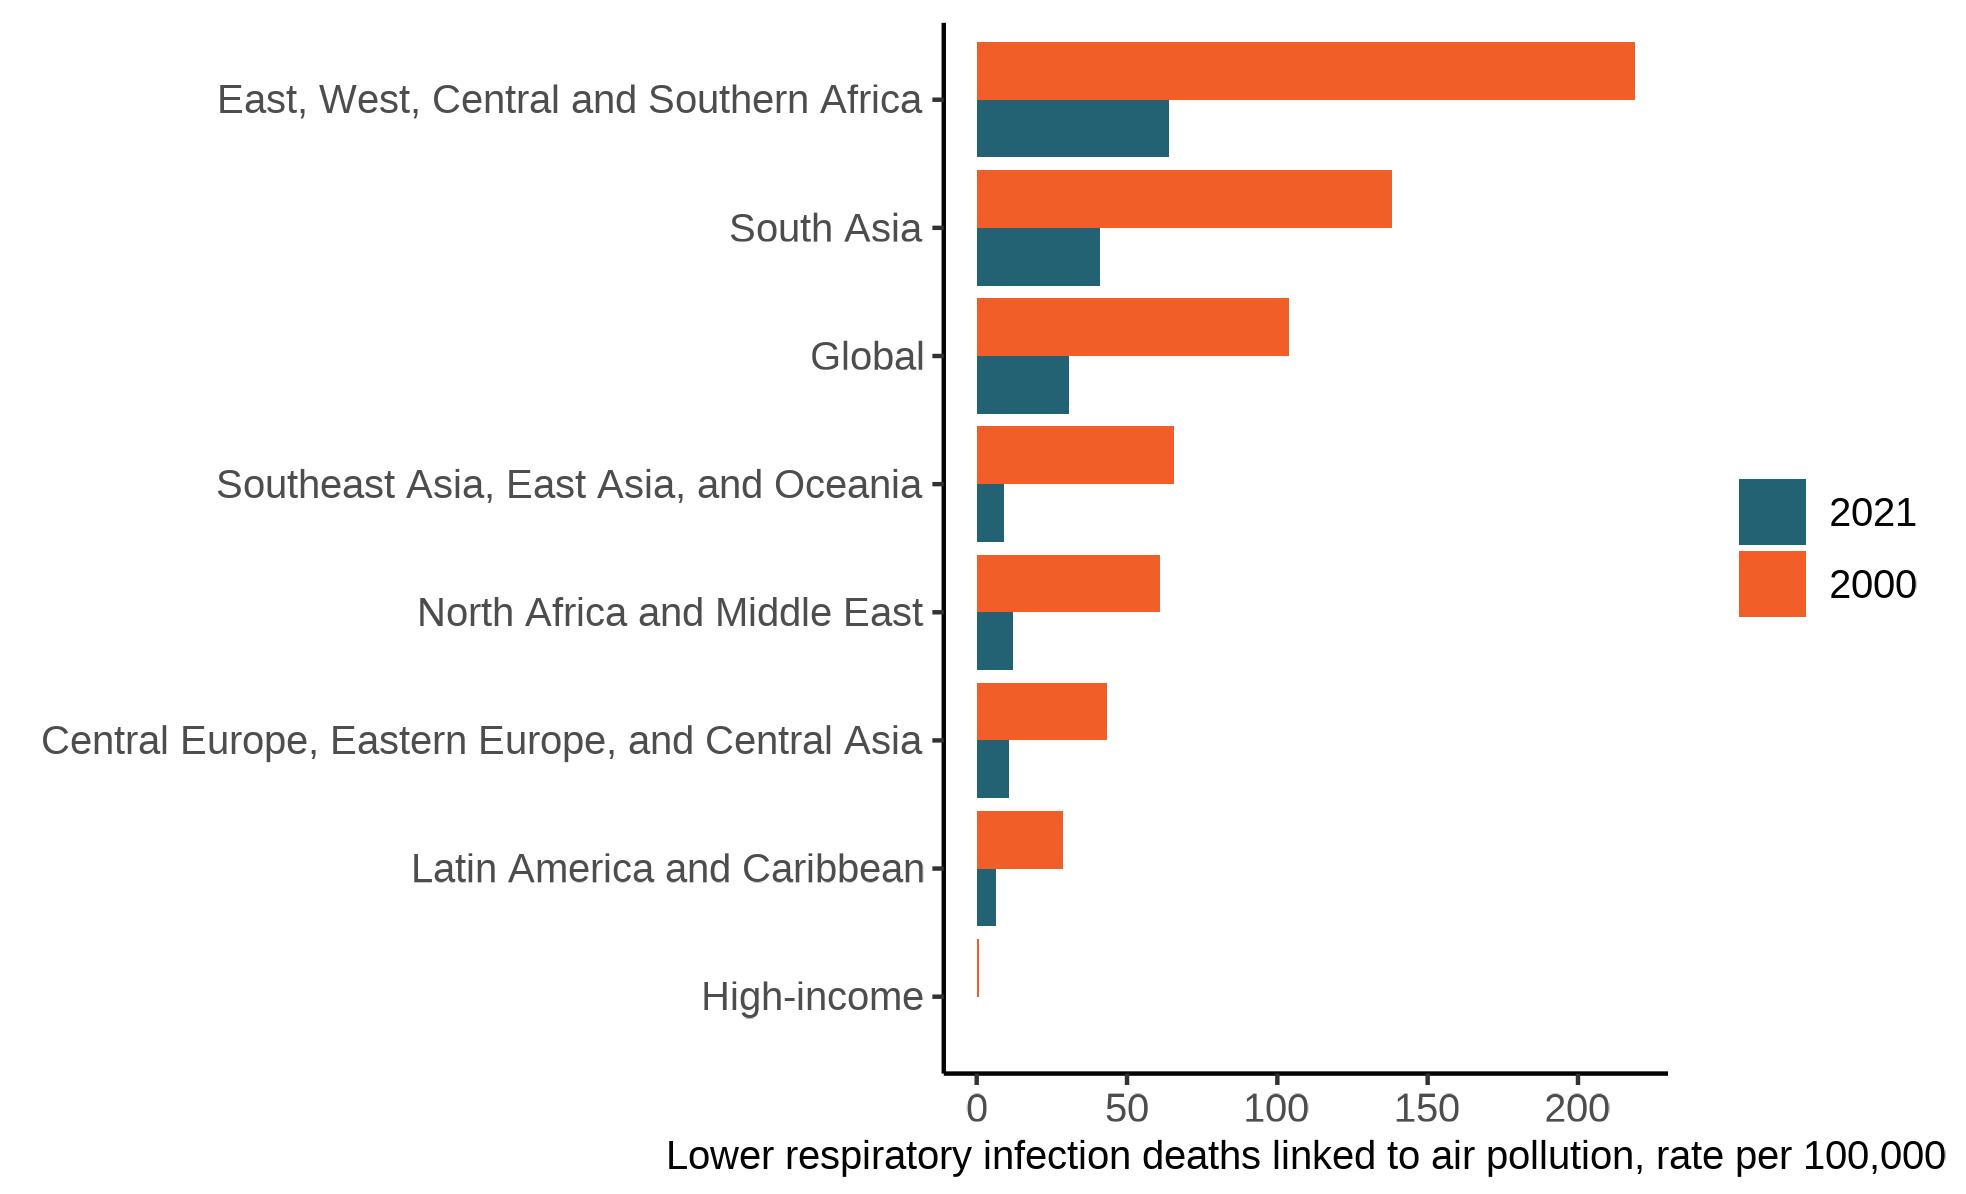
Across the world, the disease burden of LRIs and LRI deaths attributed to air pollution has declined considerably since 2000 (Figure 20). Improved healthcare delivery systems, water, sanitation, and hygiene (WASH) services, nutrition, education, and child protection have contributed to the decrease in disease burden and deaths attributable to air pollution in children.
Lebanon, nearly a quarter (24%) of all asthma-related YLDs in children between 5–14 years are attributed to NO2 exposure; other countries where air pollution contributes to more than 10% of the asthma YLDs include Qatar (14 .8%), Bahrain (14 7%), Singapore (13 6%), Kuwait (12 4%), Republic of Korea (11 7%), and United Arab Emirates (10 4%) Note that asthma is more likely to be recognized and diagnosed in high-income countries . Since 2000, asthma’s burden has declined in most regions, including in HICs, Latin America, and the Caribbean In South Asia and East, West, Central, and Southern Africa, there has been an increase in asthma YLDs linked to air pollution . In each of the regions with decreases in NO2attributable asthma burden, a key contributor has been a decrease in NO2 exposures over time In both Africa and Asia — regions experiencing rapid population growth and urbanization — the overall burden is much lower compared to other parts of the world; the increase in asthma YLDs indicates a need for urgent action .

On February 15, 2013, nine-year-old Ella Kissi-Debrah died of a fatal asthma attack in London, UK She is the first person in the world to have air pollution listed as part of the cause of death on her death certificate Learn more about Ella’s story
24 STATE OF GLOBAL AIR 2024
FIGURE 20. Death rates linked to lower respiratory tract infections attributable to air pollution exposure in 2000 and 2021 in children under five years in the GBD Super Regions Rates among children 5–14 and adolescents 15–19 are much lower in comparison
Ella Roberta Estate
Health Benefits of Access to and Use of Clean Energy to Children in Asia and Africa
In many low- and middle-income countries, a significant proportion of the disease burden among children is linked to household air pollution, reflecting a lack of access to clean energy A transition to clean energy sources could address climate challenges and improve air quality and health However, experiences from countries such as China show that major improvements in access to and use of clean energy will only be possible through sustained government action Actions to improve access to and use of clean fuels can help achieve these UN Sustainable Development Goals: goal 3, “Ensure healthy lives and promote well-being for all at all ages”; goal 7, “Ensure access to affordable, reliable, sustainable, and modern energy for all”; and goal 13, “Take urgent action to combat climate change and its impacts . ”
There are some examples where information on the health effects of exposure to household air pollution is being actively communicated to the public, including the significant impacts of exposure during pregnancy on newborns In Kenya, for instance, the Facilitators’ Guide on Household Air Pollution for Community Health Volunteers, launched in 2021, provides detailed information on household air pollution, its effects on health, and strategies to reduce exposures
In other instances, efforts are being made to reduce exposure to air pollution
In Nepal, UNICEF partnered with local governments in six remote municipalities to distribute cleaner eco-cookstoves among more than 9,800 households to improve maternal and child health, and to reduce deforestation . More

In Mongolia, UNICEF worked with government partners to install and run a network of low-cost sensors in schools . Availability of air quality data eventually led to the development and installation of new air ventilation systems that are now being piloted in six kindergartens and three healthcare facilities More © UNICEF Mongolia
STATE OF GLOBAL AIR 2024 25
FIGURE 21. Global rates of asthma YLD linked to NO2 exposure for children between 5 and 14 years of age in 2021
Recent research suggests exposure to air pollution starting at the prenatal stage can impair brain development and increase a child’s risk of autism spectrum disorder, as well as long-term intellectual disabilities, including problems with cognition and attention
There is also some evidence that air pollution may increase the risk of childhood cancers
Exposure to Secondhand Smoke
Another exposure that has been found to be harmful to children is secondhand smoke, defined as the involuntary exposure of nonsmokers to tobacco smoke from the smoking of others . There is no safe level of exposure to secondhand smoke, and children are particularly at risk
Studies have shown that exposure to secondhand smoke can lead to several damaging health effects in children, such as respiratory infections, including pneumonia, ear infections, and exacerbation of asthma Repeated exposures to secondhand smoke have also been linked to increased risk of hospitalization among children Also, exposure to secondhand smoke during childhood can result in a higher risk for cardiovascular diseases later in life In 2021, secondhand smoke was ranked as the eighth largest risk factor for deaths in children children under five and resulted in 39,000 deaths . Detailed data on the impacts of secondhand smoke are available via GBD Compare.
Watch this short video to learn more about the impacts of air pollution on neonatal

DIG D EEPER
Meet Amari, Henri, and other children around the world who are affected by air pollution. Watch our video Cleaner Air, Healthier Children
Explore children’s environmental health profiles at the UNICEF Children’s Environmental Health Collaborative website.
Learn more about children’s environmental health through this course developed by UNICEF and WHO.
26 STATE OF GLOBAL AIR 2024
Gulshan Khan / Climate Visuals
Resident of the Vosman area of Witbank, Emalahleni, South Africa
THE RISING THREAT OF NONCOMMUNICABLE DISEASES
Noncommunicable diseases (NCDs) — those that that do not pass from person to person and that are often chronic, lasting for years — include some of the major causes of death and disability, such as cardiovascular (heart) diseases, cancer, diabetes, and chronic respiratory (lung) diseases Over the last few decades, illnesses and deaths from NCDs have been on the rise In 2021, ischemic heart disease, stroke, and COPD were among the five leading causes of death around the world Air pollution is a major cause of the high burden of these chronic NCDs together with diet, lack of physical activity, and use of tobacco and alcohol Fur thermore, those living with chronic diseases can be more susceptible to adverse effects of air pollution In 2018, the UN High-Level Meeting on Noncommunicable Diseases added air pollution as one of the five most important risk factors for the most prominent NCDs . Subsequently, the inclusion of air pollution as a risk factor in the NCD framework was also adopted by the World Health Assembly in 2019
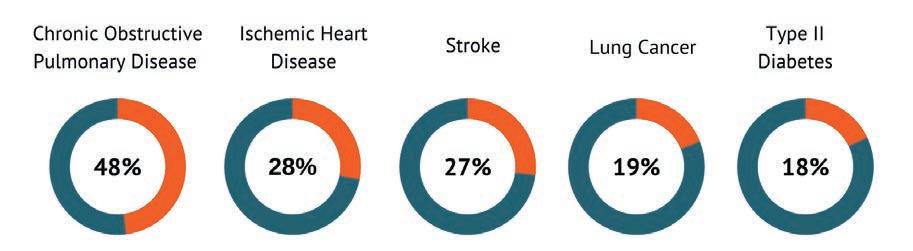
NCDs, such as heart disease, lung cancer, and chronic lung diseases (COPD), account for nearly 90% of the total disease burden of air pollution and predominantly affect people in older age groups The remaining 10% is related to factors that mostly affect young children, including respiratory infections and adverse birth outcomes (see Children Under 5 health section) As shown in Figure 22, air pollution accounts for 48% of global deaths from COPD, 28% of deaths from IHD, 27% of deaths from stroke, 19% of deaths from lung cancer, and 18% of deaths from type 2 diabetes
The air pollution–attributable burden from these diseases is not borne equally across the world For example, while the contribution of air pollution to IHD is 28% on average globally; the contribution ranges from less than 10% in HICs such as Finland, Norway, Australia, and Canada to more than 40% in countries in East, West, Central, and Southern Africa and South Asia (such as Nigeria, Kenya, Rwanda, and Bangladesh) Note that the disease burden of air pollution depends on multiple factors, including the level and types of exposures in a given place along with the age distribution and underlying health of the people who live there
Noncommunicable diseases account for nearly 90% of the total disease burden of air pollution.
In addition to the impacts on individuals and families when a person dies early, at the population level the growing number of people living with these chronic diseases can lead to loss of productivity, high healthcare costs, and overburdened healthcare systems According to an estimate from the World Bank, health impacts of air pollution cost US $4 4 trillion annually, ~5 1% of the global GDP in 2019
Did you know that outdoor air pollution is considered carcinogenic (capable of causing cancer)? Exposure to air pollution was estimated to account for nearly 1 in 5 deaths from lung cancer in 2021
Climate change can exacerbate the health burden of NCDs For example, the number of deaths related to heart and lung diseases has been found to increase during heatwaves, which are becoming more common as the planet warms Although this trend is alarming, the flip side is that by reducing air pollution we can achieve health gains, simultaneously helping to slow climate change, prevent pollutionrelated illnesses, and curb the interactions that exacerbate the impacts of both
Lifestyle factors such as diet, alcohol, smoking, and physical activity are key risk factors for many NCDs; individuals and families can adopt habits to reduce the risk of disease However, individuals and especially children often have little control over how much pollution they breathe The growing evidence of air pollution’s role in NCDs has brought attention to the need for more public health action at the societal level For example, the European Union has included reducing environmental pollution as an important part of its Beating Cancer Plan. Recognizing the importance of air pollution in NCDs, eight mayors from the Partnership for Healthy Cities are focusing their efforts on improving air quality monitoring and use data to inform public health action
STATE OF GLOBAL AIR 2024 27
FIGURE 22. Percentage of global deaths from specific causes attributable to total air pollution in 2021 Visit stateofglobalair.org to explore the data for your country or region

DIG D EEPER
Curious about the impact of air pollution on the NCD disease burden in your country? Explore data for your country at stateofglobalair.org.
Listen to Dr. Michelle Turner and Dr. Arvind Kumar talk about air pollution and lung health, including the association between air pollution and lung cancer.

28 STATE OF GLOBAL AIR 2024
Kampala, Uganda
Pallavi Pant
CONCLUSIONS
Air pollution poses an enormous — and growing — public health challenge It is now the second leading risk factor for early death worldwide, surpassed only by high blood pressure . Air pollution also outranks tobacco as a leading cause of death and disability
Numbers give us a sense of the scale of the problem: 99% of the world’s population is exposed to harmful levels of PM2 5; air pollution contributed to 8 1 million deaths in 2021 alone, more than 90% of which are linked to noncommunicable diseases; more than 700,000 deaths in children under five were from causes related to household and outdoor air pollution in a single year Yet even these staggering statistics fail to fully capture the true human toll of each life that is lost too early, the human suffering that accumulates over the course of a chronic illness, or the burdens borne by families and communities, especially in LMICs Despite significant progress, household use of solid fuels for cooking remains an important source of exposure to air pollution, especially in countries in Asia and Africa . There is also cause for optimism: documented examples from locations such as China where air quality management approaches have reduced pollution show that when air quality improves, so does population health
Much of the air pollution that afflicts us today comes from sources that we understand well From long experience, we know what drives these sources of pollution, and in most cases, we understand what it would take to curb them But there is still much to learn and critically, much to do . Increasingly, rising temperatures are worsening air pollution and its health effects, underscoring the urgent need for integrated action to simultaneously improve air quality and reduce greenhouse gas emissions Just in the last year, wildfires, extreme heatwaves, and more frequent and severe dust storms have proven to be devastating to air quality in regions around the globe .
The data presented here show that in many countries, levels of ozone — a pollutant and a greenhouse gas — are rapidly increasing In one promising step, in March 2024, the UN Environment Assembly passed a resolution on air pollution, calling for greater cooperation and development of air quality management programs However, much work remains to be done to further reduce air pollution and its toll on global population health Even with improvements in air quality, the burden of disease attributable to air pollution continues to rise as populations grow, age, and become more susceptible to the noncommunicable diseases most closely related to air pollution
Facing these trends effectively requires not only making substantial gains in air quality but also reducing disparities in health in the least developed countries that often carry the largest burdens . We hope that the global estimates presented here can support local and regional data and evidence-based decisions and actions
Every life counts The human toll of air pollution affects all of us, wherever we live, whatever our age Pollution undercuts health, stability, and productivity from individuals and families up to entire societies, nations, and regions By describing the magnitude of the air pollution problem and its true toll — and providing examples of actions being taken to improve air quality around the globe — we intend this report to inspire and inform efforts to reclaim and rebuild the healthy environment .
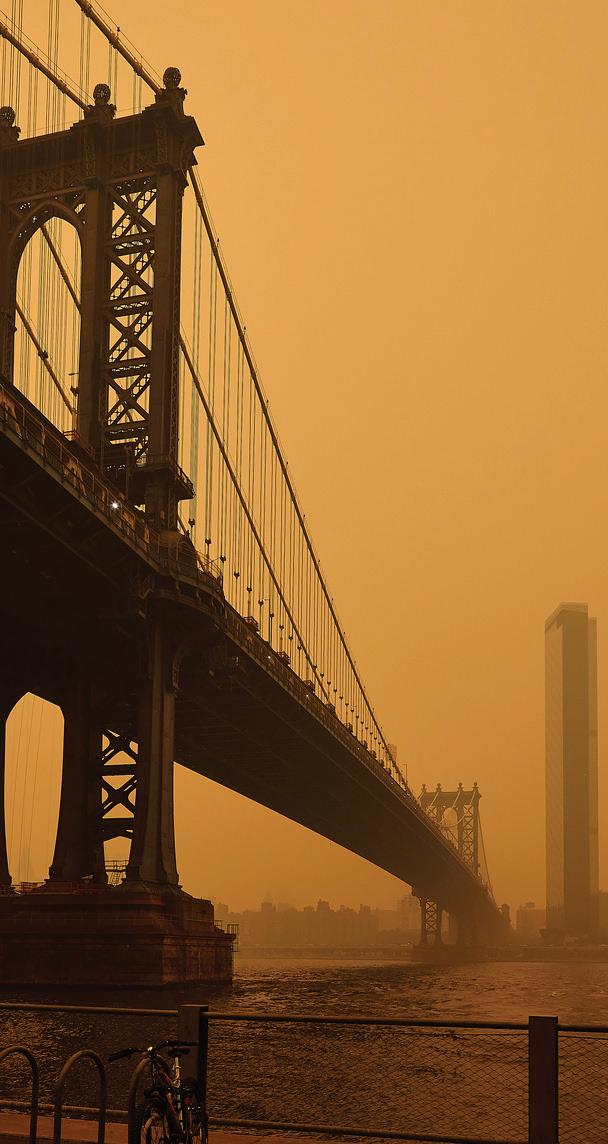
STATE OF GLOBAL AIR 2024 29
Naoko Takagi/ iStock
Wildfire smoke in New York City, USA, in 2023
KEY RESOURCES
GLOBAL BURDEN OF DISEASE 2021 METHODS
These references provide background details on the latest GBD methods used to estimate PM2.5, ozone, and household air pollution exposures and to estimate the premature deaths and DALYs reported in the State of Global Air this year.
Explore and download additional information and data on mortality and disease burden for air pollution, as well as other risk factors, at the IHME GBD Compare.
GBD 2021 Diseases and Injuries Collaborators 2024 Global incidence, prevalence, years lived with disability (YLDs), disability-adjusted life years (DALYs), and healthy life expectancy (HALE) for 371 diseases and injuries in 204 countries and territories and 811 subnational locations, 1990–2021: A systematic analysis for the Global Burden of Disease Study 2021 . Lancet 403:2133–2161; DOI : 10.1016/S01406736(24)00757-8 . Epub 2024 Apr 17
GBD 2021 Causes of Death Collaborators 2024 Global burden of 288 causes of death and life expectancy decomposition in 204 countries and territories and 811 subnational locations, 1990–2021: A systematic analysis for the Global Burden of Disease Study 2021 . Lancet 403:2100–2132; DOI : 10.1016/ S0140-6736(24)00367-2 Epub 2024 Apr 3 Erratum in: Lancet 2024 May 18;403(10440):1988
GBD 2021 Risk Factors Collaborators 2024 Global burden and strength of evidence for 88 risk factors in 204 countries and 811 subnational locations, 1990–2021: A systematic analysis for the Global Burden of Disease Study 2021 . Lancet 403:2162–2203; DOI : 10.1016/S0140-6736(24)00933-4.
Summary: Air pollution—Level 2 risk .
HEALTH EFFECTS OF AIR POLLUTION
For scientific evidence and perspectives on the health effects associated with exposures to PM2.5, ozone, and related air pollution, see the following publications:
Anenberg SC, Mohegh A, Goldberg DL, Kerr GH, Brauer M, Burkart K, et al 2022 Long-term trends in urban NO2 concentrations and associated paediatric asthma incidence: Estimates from global datasets . Lancet Planet Health 6:e49–e58; DOI : 10.1016/S25425196(21)00255-2
Boogaard H, Walker K, Cohen A 2019 Air pollution: The emergence of a major global health risk factor Int Health 11:417–421 Available: https://doi.org/10.1093/inthealth/ihz078
Brauer M, Davaakhuu N, Escamilla Nuñez MC, Hadley M, Kass D, Miller M, et al 2021 Clean air, smart cities, healthy hearts: Action on air pollution for cardiovascular health Glob Hear t 16:61; DOI: 10.5334/gh.1073; PMID: 34692385; PMCID: PMC8428302
Brumberg HL, Karr CJ; Council On Environmental Health . 2021 . Ambient air pollution: Health hazards to children . Pediatrics147:e2021051484; DOI : 10.1542/peds.2021-051484
Clean Cooking Alliance 2021 Hear ths and Health: Evidence of the Global Impact of Household Air Pollution on Health Available: https://storymaps.arcgis.com/stories/e455c0a25dcf4b92a859f 5d38a26ce27 [accessed 2 April 2024]
HEI Household Air Pollution Working Group 2018 Household Air Pollution and Noncommunicable Diseases Communication 18 Boston, MA: Health Effects Institute
IARC (International Agency for Research on Cancer) 2013 Air Pollution and Cancer IARC Scientific Publication No 161 Lyon, France: World Health Organization . Available: www.iarc.fr/en/ publications/books/sp161/AirPollutionandCancer161.pdf [accessed 13 August 2020]
Lai PS, Lam NL, Gallery B, Lee AG, Adair-Rohani H, Alexander D, et al 2024 Household air pollution interventions to improve health in low- and middle-income countries: An official American Thoracic Society Research Statement Am J Respir Crit Care Med 209:909N927; DOI: 10.1164/rccm.202402-0398ST.
Rajagopalan S, Landrigan PJ 2021 Pollution and the heart N Engl J Med 385:1881–1892; DOI: 10.1056/NEIMra.2030281
World Health Organization (WHO) 2021 WHO Global Air Quality Guidelines: Particulate Matter (PM2 5 and PM10), Ozone, Nitrogen Dioxide, Sulfur Dioxide and Carbon Monoxide Geneva: WHO License CC BY-NC-SA 3 0 IGO
AIR QUALITY DATA
World Health Organization (WHO) 2022 WHO Air Quality Database 2023 . Available: https://www.who.int/data/gho/data/themes/airpollution/who-air-quality-database [accessed 1 Feb 2024]
World Health Organization (WHO) 2023 Overview of Methods to Assess Population Exposure to Ambient Air Pollution Geneva: WHO License: CC BY-NC-SA 3 0 IGO
The exposure estimates included in the Global Burden of Disease and State of Global Air incorporate city-level measurement data reported by countries to the World Health Organization and OpenAQ, among many other sources Explore, visualize, and download city-level data from the WHO Ambient Air Quality database and OpenAQ.
SOURCES OF AIR POLLUTION
McDuffie E, Martin R, Yin H, Brauer M 2021 Global Burden of Disease from Major Air Pollution Sources (GBD MAPS): A Global Approach . Research Report 210 Boston, MA: Health Effects Institute .
MITIGATION OF AIR POLLUTION
United States Agency for International Development (USAID) 2019 LMIC Urban Air Pollution Solutions Available: https:// urban-links.org/resource/low-and-middle-income-countries-urbanair-pollution-solutions/ [accessed 2 May 2024]
Explore information on monitoring and management of air pollution on the C40 Knowledge Hub
VIDEOS
State of Global Air Initiative 2024 Cleaner Air, Healthier Children Boston, MA: Health Effects Institute Available: https://www.stateofglobalair.org/ resources/video/cleaner-air-healthier-children.
State of Global Air Initiative 2020 A Fragile Stage: Air Pollution’s Impact on Newborns Boston, MA: Health Effects Institute Available: https://www. stateofglobalair.org/resources/video/fragile-stage-air-pollutions-impactnewborns
State of Global Air Initiative 2020 Air Pollution and Climate Change Boston, MA: Health Effects Institute Available: https://www. stateofglobalair.org/resources/video/air-pollution-and-climate-change
UNICEF What Does Air Pollution PM2 5 Do Inside Children’s Body and Brain? Available: https://www.youtube.com/watch?v=G1mUopisDX4
LIVE STREAM
Science on the 7th: Our monthly live stream, Science on the 7th, is an interactive live stream series where we hear from experts around the world on topics related to air pollution and health Join us on the 7th of every month: https://www.youtube.com/@HEISoGA/streams .
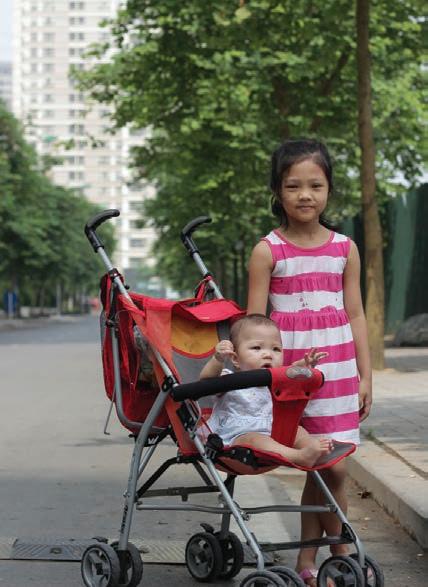
The Legacy of Dan Greenbaum (1952–2024)

Dan joined HEI in early 1994 as its president . Under his nearly 30-year leadership and vision, Dan guided the organization toward unprecedented success and growth, strengthening its unique public and private partnership with industry and government
Dan worked tirelessly to ensure that HEI funded the rigorous, trusted science needed to inform policy decisions that improved air quality while supporting advancements in technologies for cleaner burning vehicles with fewer emissions
Among his many other contributions, it was under Dan’s leadership that HEI launched and expanded the State of Global Air, a global initiative to track and communicate the health impacts of air pollution in countries around the world
Dan’s work and impact at HEI will forever remain visible and tangible He was a great mentor, colleague, and friend to everyone in the HEI community, and his work will continue to inspire us for years to come
STATE OF GLOBAL AIR 2024 31
Chi Nguyen Thi Van/iStock
A girl with her baby sister in Vietnam
CONTRIBUTORS AND FUNDING
CONTRIBUTORS

Health Effects Institute (HEI)
HEI is an independent air quality and health research institute . It is the primary developer of the State of Global Air reports and resources, the host and manager for this website, the coordinator of input from all other members of the team, and the facilitator of contact with media partners Key HEI contributors include Pallavi Pant, head of global health; Ada Wright, research assistant; Victor Nthusi, consulting research fellow; Abinaya Sekar, consulting research fellow; Amy Andreini, science communications specialist; Hope Green, editorial project manager; Kristin Eckles, senior editorial manager; Alexis Vaskas, digital communications manager; Tom Champoux, director of science communications; Aaron Cohen, consulting scientist at HEI and affiliate professor of Global Health at IHME; Bob O’Keefe, vice president; and Elena Craft, president
Institute for Health Metrics and Evaluation (IHME)
IHME is an independent population health research center at the University of Washington School of Medicine, Seattle It provides the underlying air pollution and health data and other critical support for this project Key IHME contributors include Michael Brauer, faculty; Katrin Burkart, faculty; Elizabeth Marsh, research scientist; Nadim Hashmeh, research scientist; Sarah Wozniak, (former) post-bachelor fellow; and Charlie Ashbaugh, research manager
FUNDING
This initiative is supported by the Clean Air Fund

UNICEF
UNICEF works in over 190 countries and territories to protect the rights of every child UNICEF works in some of the world’s toughest places, to reach the world’s most disadvantaged children Key UNICEF contributors include Abheet Solomon, senior adviser; Desiree Montecillo-Narvaez, health specialist; Maria Brown, consultant; Swathi Manchikanti, consultant; Katelyn Greer, consultant; and Tess Ingram, consultant
HEI and IHME are par tners in the Children’s Environmental Health Collaborative, co-founded by UNICEF, UN Environment Programme, and the World Bank
Reviewers
We would like to thank Abdus Salam (University of Dhaka), Caradee Wright (South African Medical Research Council), Glynda Bathan-Baterina (Clean Air Asia), Jill Baumgartner (McGill University), Jon Samet (Colorado School of Public Health), Kalpana Balakrishnan (Sri Ramachandra Institute of Higher Education and Research), Marit V Pettersen (Ministry of Foreign Affairs, Norway), Michal Krzyzanowski, Juana Maria DelgadoSaborit (University Jaume I), and Nina Renshaw and Yasmine Yau (Clean Air Fund) for their valuable comments and feedback
Other Contributors
ZevRoss Spatial Analytics provided data visualization support and developed the interactive features of the site; Metropolis Creative designed the website; Charles River Web maintains the website; Creative Science Writing provided writing support; Mary Brennan edited the report; Ray Rivera Design provided design support; David Wade composed the report; StoryMine produced the video; and Innodata provided the translations
32 STATE OF GLOBAL AIR 2024
APPENDIX I: METHODS TO DETERMINE AIR POLLUTION EXPOSURES AND RELATED HEALTH IMPACTS
ESTIMATION OF AMBIENT PM2.5
Many of the world’s countries now measure PM2 5 concentrations through networks of reference-grade monitoring stations concentrated around urban areas These stations offer a rich source of data that has served as the foundation for most studies of the health effects of air pollution and changes in air quality over time In addition to these sources of data, GBD estimates incorporate data from the World Health Organization (WHO) ambient air quality database, which serves as a repository for monitoring data for many individual cities around the world . In 2021, the GBD project added particulate matter measurements (PM10 and PM2 5) from additional ground monitors, including data from the European Environment Agency, OpenAQ, and others
Although these data sources are valuable, on-the-ground air quality monitoring stations are few and far between in many regions of the world, particularly in low- and middle-income countries . To fill the gaps and to provide a consistent view of air pollution levels around the world, GBD scientists use sophisticated techniques to combine available ground measurements of particulate matter with observations from satellites and predictions from global chemical transport models They update their estimates each year using improved methods and new ground-level and satellite measurements Extensive comparisons of these predictive methods (satellite and modeling approaches) with ground-level measurements demonstrate that they are reasonably accurate, and thus reliable indicators of PM2 5 where ground monitors do not exist or are not made publicly available
Using this combined approach, GBD scientists systematically estimate annual average concentrations of PM2 5, along with the 95% uncertainty interval (UI) for each estimate, across the entire globe divided into blocks, or grid cells, each covering 0 1° × 0 1° of longitude and latitude (approximately 11 × 11 kilometers at the equator) using the Data Integration Model for Air Quality (DIMAQ2) To estimate the annual average PM2 5 exposures, or concentrations, that a population in a specific country is more likely to come into contact with, GBD scientists link the concentrations in each block with the number of people living within each block to produce a populationweighted annual average concentration . Population-weighted annual average concentrations are better estimates of population exposures than simple averages across monitors, for example, because they give greater weight to the pollutant concentrations experienced where most people live Gridded data are available on request
ESTIMATION OF HOUSEHOLD AIR POLLUTION
In the GBD project, exposure to PM2 5 related to household air pollution is estimated using a multistep process, beginning with information on the proportion of populations that use solid fuels (coal/charcoal, wood, dung, and agricultural residues) for cooking The proportion of households using solid fuels for cooking is estimated based on data from numerous international and national surveys (e g , Demographic and Health Surveys, World Health Surveys), census and country-specific surveys (e g , Kenya Welfare Monitoring Survey), and individual studies, updated each year from 1980 to 2020 This information is used together with demographic data on household composition to estimate the percentage of men, women, and children of different ages who are potentially exposed to pollution as a result of cooking with solid fuels in each country These percentages are then translated into PM2 5 levels to which individuals are exposed based on data from the WHO Global Household Measurements Database and other key studies, including, for the first time, PURE-AIR (for a total of 76 studies in 47 unique locations) This translation process relies on a mathematical model that takes into account the type of fuel (solid or nonsolid), type of air pollution measurement (i e , kitchen versus personal), duration of the measurement, whose exposure was measured (men, women, or children), and the sociodemographic index for the location and year . For GBD 2021, the fuel-specific proportion estimates were generated for the first time, unlike previous years when equal PM2 5 exposure was estimated for each fuel category
To make sure that the estimated exposure to PM2 5 for each location and year represents household exposures only, GBD scientists subtract the ambient PM2 5 exposure for each location at the time of measurement . In this way, the analysis provides independent estimates of exposures to household pollution and ambient PM2 5
ESTIMATION OF OZONE
Like PM2 5, ozone concentrations are measured in more developed countries using extensive monitoring networks, but many parts of the world do not have such networks or have not made their data openly available to scientists To characterize ozone concentrations and trends in a consistent way around the world — particularly for regions where monitoring data are sparse — scientists combine data from monitoring networks with outputs from atmospheric transport models Using both approaches enables scientists to correct for differences between observed and modeled values and to estimate uncertainty in the model predictions
STATE OF GLOBAL AIR 2024 33
Ozone monitoring data were obtained from the Tropospheric Ozone Assessment Report (TOAR), and updates were made to include available datasets until 2017, resulting in more than 8,800 observation locations Data from China National Environmental Monitoring Center network for the years 2013 to 2017 were also included A combination of eight global atmospheric models was used in the analysis to systematically estimate seasonal 8-hour maximum concentrations of ozone across the entire globe divided into blocks, or grid cells, each covering 0 1° × 0 1° of longitude and latitude (approximately 11 × 11 kilometers at the equator) . The annual trends were then extrapolated to the years 2018–2020 To estimate the exposures, or concentrations, that a population in a specific country is more likely to come into contact with, GBD scientists link the average seasonal 8-hour maximum concentrations in each block with the number of people living within each block to produce a population-weighted average seasonal 8-hour maximum ozone concentration Gridded data are available upon request
ESTIMATION OF NITROGEN DIOXIDE
Estimates of NO2 exposure were derived using a combination of various datasets — ground-based measurements, satellite measurements and satellite-based surface concentration estimates, land use regression modeling based surface concentration estimates, population estimates, and urbanicity Surface annual average NO2 concentrations were estimated at 1 × 1 kilometer resolution To avoid overestimation of NO2 in rural areas, a combination of satellite-based (OMI satellite instrument) and chemical transport model data were used
HOW BURDEN OF DISEASE IS ESTIMATED
The GBD project’s estimation of the burden of disease begins with a systematic evaluation of the scientific evidence and whether it is
strong enough to attribute a given health outcome or cause of death to a particular pollutant Every risk–outcome pair included in the GBD has undergone this rigorous evaluation For those outcomes linked through this process to individual pollutants, the GBD project then calculates air pollution’s burden of disease in each country using:
• Mathematical functions, derived from epidemiological studies, that relate different levels of exposure to the increased risk of death or disability from each cause, by age and sex, where applicable;
• Estimates of population exposure to PM2 5, ozone, and household air pollution;
• Country-specific data on underlying rates of disease and death for each pollution-linked disease; and
• Population size and demographic data (age and sex) for each country
Outcomes associated with ambient PM2 5 and household air pollution include lower respiratory infections (LRI), chronic obstructive pulmonary disorder (COPD), lung cancer, stroke, ischemic heart disease (IHD), and type 2 diabetes; for HAP, cataract is also included COPD is the only health outcome included for ozone
Cause-specific risk curves were used to estimate the disease burden of air pollution Data from 193 epidemiological studies were considered to generate the risk curves The burden for chronic obstructive pulmonary disorder (COPD), lung cancer, stroke, ischemic heart disease (IHD), and type 2 diabetes is estimated for ages 25+, while the burden for lower respiratory infections is estimated for all ages For GBD 2021, secondhand smoke cohort and case-control studies were removed from the risk curves, thus starting with GBD 2021, only PM2 5 and HAP relative risk data are used to develop the risk curves Of note, for GBD 2021, age-specific risk curves were not used for estimating the burden for cardiovascular outcomes
For the first time, GBD also calculated an evidence score to evaluate the strength of evidence for the risk–outcome pairs, with a 1-star
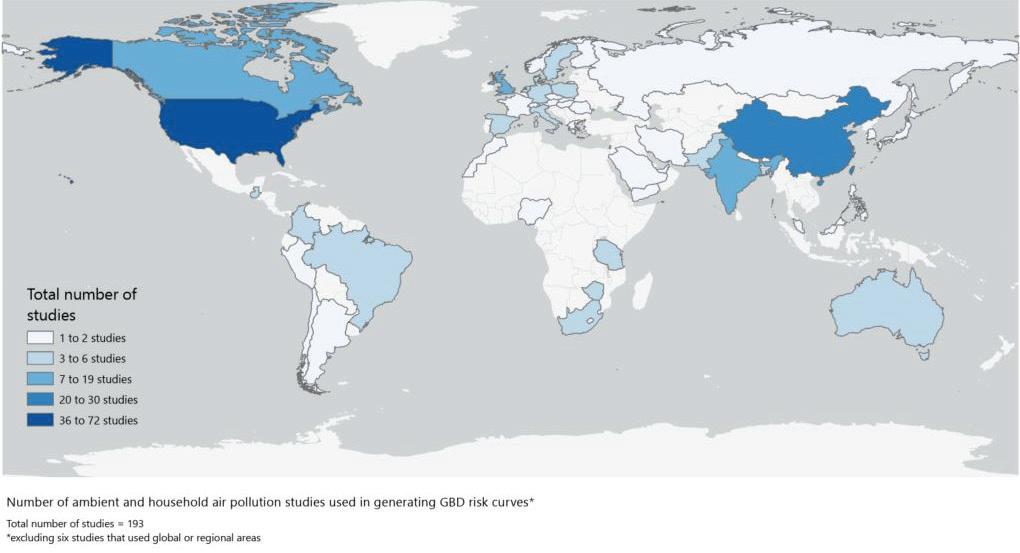
34 STATE OF GLOBAL AIR 2024
FIGURE ii. Studies used to generate risk curves for ambient PM2 5 and household air pollution for GBD 2021
rating indicating that there is not enough evidence to determine the association between the risk and outcome and a 5-star rating indicating strong evidence to link the risk and outcome pair For air pollution, the scores ranged from 2–4, with COPD receiving a 4-star rating; stroke, ischemic heart disease, lung cancer, and diabetes receiving a 3-star rating; and LRI receiving a 2-star rating (Explore detailed data via the GBD Burden of Proof visualization )
The results of these calculations are expressed for the population in every country in a number of ways In the State of Global Air, we focus on three:
• Total number of deaths
• Disability-adjusted life-years (DALYs)
• Age-standardized rates
Estimates of uncertainty are provided for every value in the form of 95% uncertainty intervals (UIs), representing the range between the 2 5th and 97 5th percentiles of the distribution of possible values

STATE OF GLOBAL AIR 2024 35
Renate Wefers/iStock
Summary: Ambient PM2.5 | Household Air Pollution | Ozone | Nitrogen dioxide
Accra, Ghana
