THE STATE OF AIR QUALITY AND HEALTH IMPACTS IN AFRICA


A REPORT FROM THE STATE OF GLOBAL AIR INITIATIVE 2022 Citation: Health Effects Institute. 2022. The State of Air Quality and Health Impacts in Africa. A Report from the State of Global Air Initiative. Boston, MA:Health Effects Institute. ISSN 2578-6881 © 2022 Health Effects Institute The State of Global Air is a collaboration between the Health Effects Institute and the Institute for Health Metrics and Evaluation’s Global Burden of Disease project.
WHAT IS THE STATE OF GLOBAL AIR?
IS THE STATE OF GLOBAL AIR?


The State of Global Air is a research and outreach initiative to provide reliable, meaningful information about air quality around the world. A collaboration of the Health Effects Institute and the Institute for Health Metrics and Evaluation’s Global Burden of Disease project, the program gives citizens, journalists, policymakers, and scientists access to high-quality, objective information about air pollution exposure and its health impacts. All data and reports are free and available to the public.
of Global Air report and interactive web into one place a comprehensive analysis levels and trends in air quality and health country in the world. They are produced by the Health Effects Institute and the for Health Metrics and Evaluation’s Global Burden of Disease (GBD) project source of objective, high-quality, and comparable air quality data and information.
ABOUT THIS REPORT

FOR?
report and website are designed to give journalists, policy makers, and scientists reliable, meaningful information about pollution exposure and its health effects. These are free and available to the public.
This report presents an overview of the state of air quality and its impacts on health in Africa. It draws together data from the Global Burden of Disease project and from a recent global assessment of air pollution sources to discuss air pollution trends, sources, and associated disease burdens across this important region, with a particular focus on Egypt, Ghana, Democratic Republic of the Congo, Kenya, and South Africa.
HOW CAN I EXPLORE THE DATA?


CAN I EXPLORE THE DATA?
This report has a companion interactive website with tools to explore, compare, and download data and graphics. Anyone can use the website to access data for all African countries and track long-term trends for air pollutants and associated health impacts. Find it at www.stateofglobalair.org
report has a companion interactive website to explore, compare, and download data graphics reflecting the latest air pollution associated burden of disease. Anyone the website to access data for over 200 countries, territories, and regions, as well
Data and figures from this publication may be used for noncommercial pur poses. Contents of this report may not be used for any commercial purposes without prior permission from the Health Effects Institute. Please write to us at contactsoga@healtheffects.org for more information.
CONTENTS Introduction . . . . . . . . . . . . . . . . . . . . . . . IT
CONTENTS INTRODUCTION 3 AMBIENT FINE PARTICLE AIR POLLUTION ...... 6 HOUSEHOLD AIR POLLUTION ............... 12 OZONE 17 CONCLUSIONS 19 ABBREVIATIONS ........................... 21 KEY RESOURCES ........................... 22 CONTRIBUTORS AND FUNDING 23
@HEISoGA
In Africa, air pollution is the second leading risk factor for deaths.
Air pollution imposes a heavy burden on health worldwide. Pollution from fine particulate matter, household burning of solid fuels, and ozone is responsible for millions of early deaths each year and an estimated 1 in 9 deaths worldwide. An extensive body of scientific evidence, gathered over several decades, links long-term exposures to air pollution with an increased risk of illness and death from chronic diseases such as ischemic heart disease, lung cancer, chronic obstructive pulmonary disease (COPD), stroke, and type 2 diabetes. Air pollution exposure in the womb is associated with being born too small or too early, and breathing polluted air during the first years of life can contribute to deadly lower respiratory infections in young children. There is also emerging evidence that air pollution may play a role in impaired cognitive development in children and brain disorders including dementia. Taken together, the body of evidence on the health impacts of air pollution points to pollution as a key—and potentially modifiable—risk factor for some of the world’s leading causes of illness, disability, and death.
Africa experiences some of the worst air pollution and some of the most severe health consequences relative to the rest of the world. In 2019, air pollution was the second leading risk factor for death across Africa after malnutrition. In contrast, unsafe water, sanitation and hygiene was the fourth largest risk factor for deaths. This large, populous, and dynamic continent is home to 5 of the world’s 10 most heavily polluted countries in terms of ambient fine particulate matter. In Sub-Saharan Africa, an estimated 75% of the population relies on burning solid fuels such as coal, wood, charcoal, and dung for cooking, thus exposing over 800 million people to high concentrations of harmful pollutants at home every day. Air pollution exposures from household use of solid fuels and fossil fuel sources combine with demographic and other shifts affecting the underlying health of the population. This causes uneven impacts across countries in a region where rates of chronic (i.e., long-term), noncommunicable conditions (e.g., heart disease and diabetes) are rapidly rising in relation to the burdens imposed by communicable diseases such as diarrheal disease, lower respiratory tract infections, and malaria. Air pollution’s impact on life expectancy is greatest in less-developed areas, where many people suffer a double burden from high ambient fine particulate matter and exposure to household air pollution (HAP). Many countries in Africa also experience high losses in life expectancy, driven primarily by exposure to household air pollution. For example, both in Niger and Somalia, exposure to air pollution has been estimated to contribute to more than 3 years of loss in life expectancy. MORE

In addition to the devastating human toll of the health impacts and loss of life from breathing polluted air, the economic toll of this pollution is substantial, with the annual cost of health damages due to disease related to air pollution amounting to an average of 6.5% of GDP across Africa. In Egypt, Ghana, Democratic Republic of the Congo, Kenya, and South Africa the combined annual cost of health damages from PM2.5 exposure is more than 5.4 billion U.S. dollars. MORE.
Economic development, energy access, and public policies will influence the future trajectory of air pollution and its impacts across Africa. Africa is rapidly urbanizing, on track to have 13 megacities (cities with more than 10 million residents) by 2100. Many countries across the continent are also rapidly industrializing. Economic development and growth hold the potential to raise the quality of life for many millions of people. But if household, industry, and transportation sources of air pollution are allowed to grow unchecked without proper environmental regulation, this development also has the potential to further exacerbate air pollution. It is known that inequities in socioeconomic development contribute to disparities in exposure and health. Access to clean forms of energy will be crucial in determining Africa’s air quality future as well as improved public health. As such, collaborative research and engaging various interested parties will be crucial to informing investments, structural changes, and policies that can create cleaner air and a healthier future for Africa’s vibrant population.
INTRODUCTION
In 2019, air pollution contributed to 1.1 million deaths in Africa. Of these, more than 63% were linked to exposure to household air pollution.
Accra, Ghana
Etornam
Ahiator on Unsplash
AIR POLLUTION AND HUMAN HEALTH
Air pollution is the fourth leading cause of death globally, accounting for nearly 7 million deaths annually. The large body of existing research has shown conclusively that both short- term (i.e., a few days to weeks) and long-term (i.e., months to years) exposures to air pollution can contribute to serious effects on health ranging from temporary to chronic, mild to debilitating, and even fatal conditions.
• Short-term exposures to air pollution can harm health. For example, high-pollution days can trigger asthma symptoms and cause a local spike in hospitalizations or even deaths related to respiratory (lung) and cardiovascular (heart) diseases.

• Long-term exposure to PM2.5 is associated with a variety of health effects, including ischemic heart disease, lung cancer, COPD, lower respiratory infections (such as pneumonia), stroke, type 2 diabetes, and adverse birth outcomes (such as low birth weight or preterm birth). Household air pollution is also associated with the development of cataracts. Longterm exposure to ground-level ozone is associated with the development of COPD. Although not included in the data
presented here, a growing number of studies suggest that air pollution can contribute to several other diseases including brain health outcomes (e.g., neurological effects in childhood and adolescence, and neurodegenerative disease in adulthood).
Given these effects, exposure to air pollution can also reduce life expectancy (i.e., the number of years that a person might expect to live).
Need for Comprehensive Air Pollution and Health Studies in Africa
Studies on air pollution and health in Africa have largely focused on respiratory health outcomes, with some studies on cardiovascular or maternal and child health. Furthermore, while there have been several cross-sectional studies or those looking at the associations between short-term exposures to air pollution and health, there are no studies on the effects of long-term exposure to air pollution. Finally, a majority of studies have been conducted in a handful of countries including South Africa, Nigeria, Kenya, Ghana, Malawi and the Democratic Republic of the Congo.
4 THE STATE OF AIR QUALITY AND HEALTH IMPACTS IN AFRICA
Addis Ababa, Ethiopia
What’s in This Report?
This report summarizes data on air pollution exposures and associated health impacts in Africa using data from the Global Burden of Disease (GBD) project. Because there is significant variability in both levels of air pollution and associated health impacts across the continent, we also provide data for five individual countries: Egypt, Ghana, Kenya, Democratic Republic of the Congo, and South Africa. Of these, Egypt and the Democratic Republic of the Congo rank among the 20 most-populated countries worldwide.
Air pollution is a complex mixture of particles and gases emerging from a wide variety of human-made and natural sources. This report considers three main air pollutants:
• Ambient (outdoor) fine particle air pollution, referred to as PM2.5 (airborne particles measuring 2.5 µm or less in aerodynamic diameter). Anthropogenic (human) sources of PM2.5 include household burning, fossil fuel emissions from energy production and use, industrial activities, vehicles, and other sources. Exposure to PM2.5 can result in cardiovascular (heart), respiratory (lung), and other types of diseases. MORE
• Household air pollution, a mixture of fine particulate matter and gases that results from burning fuels inside the home with limited ventilation. Household air pollution puts humans in close proximity to pollutants in indoor environments and also contributes to outdoor air pollution, with many of the same health effects as exposure to outdoor PM2.5.
• Ozone, a gas formed by complex chemical reactions between nitrogen oxides and volatile organic compounds in the presence of sunlight. The precursors to ozone are produced by combustion vehicles, industrial processes, home heating systems, and other human activities, as well as some natural processes. Ozone is a greenhouse gas, and ozone pollution is linked to climate change and associated with the development of COPD. MORE .
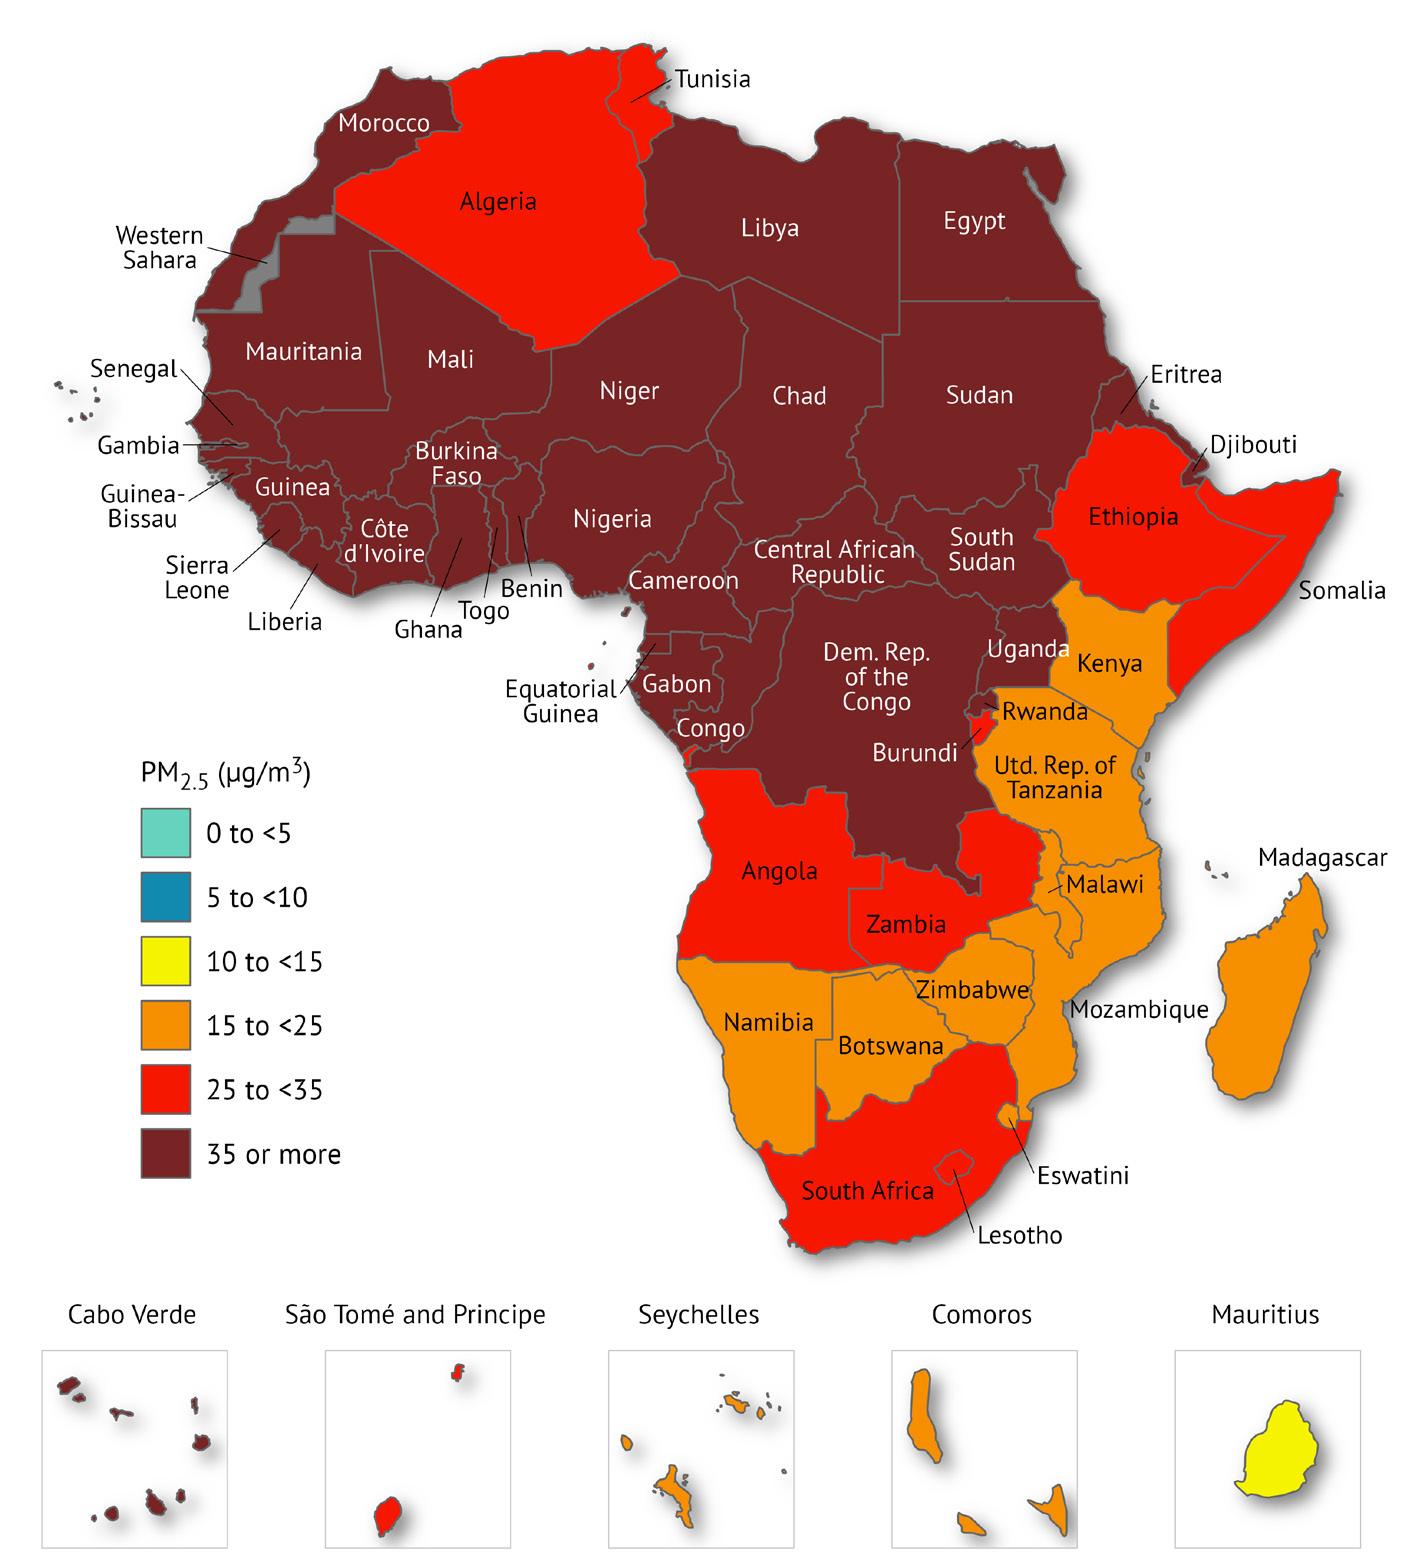
FIGURE i The countries and regions analyzed. This report presents data on air quality and associated health impacts across Africa, and focuses on five individual countries: Egypt, Ghana, Kenya, Democratic Republic of the Congo, and South Africa.

What This Report Adds
Systematic and consistent efforts to track progress toward reducing air pollution, as well as the impacts these reductions have on human health, remain essential. This report provides an overview of the state of air quality and its impacts on the health of populations in countries across Africa.
The report is designed to present the latest data on air pollution exposures and associated health impacts, including the disease burden across age groups. We draw on data from the GBD Study 2019, a unique resource where high-quality and internally consistent state-of-the-art methods have been applied to estimate the status and yearly trends in exposures and burden of disease from 87 risk factors, or groups of factors, in 204 countries and territories around the world.
The report also draws on a first of its kind, recent global assessment (McDuffie et al. 2021) to discuss the major air pollution sources across the continent and the related source-specific disease burden. For this report, 2019 was selected as the baseline for an ”average” year instead of 2020 because the lockdowns related to COVID-19 caused abnormal changes in air pollution in countries across the globe in 2020.
The focus of this report is on long-term exposures to each of these air pollutants and on associated health effects. Long-term exposures are those that occur over multiple years and that have been shown by studies to be the strongest determinants of the heavy burden from chronic diseases, which are diseases that persist for a long time and can take several years to develop.
A larger trove of data—with detailed statistics for every country and more than 7,000 cities around the world, tools for generating custom data tables and graphs, and fact sheets for countries in the region—is available at www.stateofglobalair.org
5THE STATE OF AIR QUALITY AND HEALTH IMPACTS IN AFRICA
AMBIENT FINE PARTICLE AIR POLLUTION
Ambient fine particle air pollution, also known as PM2.5 (airborne particles measuring 2.5 µm or less in aerodynamic diameter), is the most consistent and robust predictor of deaths from cardiovascular (heart), respiratory (lung), and other diseases in studies of long-term exposure to air pollution. In Africa, PM2.5 comes from many of the same sources found elsewhere in the world, including household burning of solid fuels; fossil fuel (i.e., coal, oil, and gas) use in energy production, industries, and vehicles; semi-industrial sources (e.g., artisanal mining); agricultural, savannah, and forest fires; and open waste burning. In addition, countries in the northern and western parts of the continent experience PM2.5 pollution from local dust sources and windblown dust from the Sahara Desert.
PATTERNS IN PM2.5 EXPOSURE
Most people across Africa live in areas with PM2.5 levels that exceed the World Health Organization (WHO) Air Quality Guideline of 5 µg/m3, often by a large margin. Of the world’s top 10 countries with the highest PM2.5 exposures in 2019, five are in Africa: Niger (80.1 µg/m3), Nigeria (70.4 µg/m3), Egypt (67.9 µg/m3), Mauritania (66.8 µg/m3), and Cameroon (64.5 µg/m3). Among African nations, these five countries plus Mali, Senegal, Chad, Gambia, and Côte d’Ivoire experience the worst PM2.5 pollution (Figure 1, Table 1). Country-level comparisons reveal major disparities in PM2.5 exposures across the continent, with a range in average exposures from 17.1 µg/m3 in Comoros to 80.1 µg/m3 in Niger.
By region, Western Africa experiences the highest PM2.5 pollution with an average concentration of 64.1 µg/m3, while Southern Africa has the lowest at 26.5 µg/m3. Notably, in some countries in Southern Africa, including Namibia, Zimbabwe, and the United Republic of Tanzania, most people live in areas that meet the WHO’s least stringent interim target of 35 µg/m3 On the other hand, in Western Africa, more than 90% of the population lives in areas where the PM2.5 levels do not meet even this least stringent interim target.
Fine particle pollution is often concentrated around urban areas. All of the 10 most populous cities in Africa experience PM2.5 levels exceeding the WHO Air Quality Guideline of 5 µg/m3 and four exceed even the least stringent interim target of 35 µg/m3 (Figure 2).
FIGURE 1 Population-weighted annual average PM2.5 exposures in countries across Africa.
Countries in Africa experience some of the highest PM2.5 exposures in the world.
TRENDS IN PM2.5 EXPOSURE
Overall, PM2.5 exposures across Africa essentially remained stagnant from 2010 to 2019. At the country level, progress has been uneven— while air quality improved significantly in some places, it has grown worse in others.
Western Africa experienced the most significant decline in air quality, with a 9% increase in PM2.5 exposures between 2010 and 2019. This trend was particularly striking in Nigeria, which saw a 12% increase in average PM2.5 levels. The remaining regions saw modest improvements overall. Northern Africa saw the greatest improvement, with a 7% decrease in PM2.5 exposures. Of the five focus countries, Kenya experienced the greatest improvement, with a 19% drop in average PM2.5 levels (Figure 3).
TABLE 1 Population-weighted annual average PM2.5 exposures in 2019 and percentage of population living in areas that exceed the least stringent interim target set by WHO in top 10 countries with the highest PM2.5
Country Population-Weighted PM2.5 (µg/m3) (Uncertainty Intervals)
Niger 80.1 (42.2–145)
Nigeria 70.4 (45.4–105)
Egypt 67.9 (47.8–67.9)
Mauritania 66.8 (37.6–108)
Cameroon 64.5 (43.8–92.6)
Mali 60.6 (33.7–103)
Senegal 60.2 (37.6–92.7)

Chad 59.3 (34.6–94.8)
The Gambia 58.1 (35–92.6)
Côte d’Ivoire 55.6 (32.7–90.3)
Although a lack of monitoring stations makes estimates uncertain, limited monitoring and modeled estimates indicate that most people in Africa breathe unhealthy levels of PM2.5 pollution.
Sources of PM2.5 in Africa
PM2.5 is generated from both natural and anthropogenic sources. Common natural sources include windblown dust, sea spray, and wildfires, while anthropogenic (or human-made) sources include fossil fuel and biofuel combustion, transportation, industrial and semi-industrial (e.g., artisanal mining) processes, agriculture, and waste burning. To identify priority actions and most cost-effective
National Ambient Air Quality Standards
solutions, it is critical to understand the major sources, especially anthropogenic sources, of air pollution.
The sources responsible for PM2.5 pollution vary within and between countries and regions across Africa. Dust from the Sahara Desert contributes to the high particulate matter concentrations in North Africa and the Middle East, as well as to the high concentrations in some countries in western Sub-Saharan Africa (see textbox on Desert Dust and Health). Household solid fuel use is also an important contributor to ambient PM2.5 levels in many countries.
One approach for understanding contributions is to consider fuel types including coal, solid biofuels (e.g., coal, charcoal, wood), and liquid and natural gas. Across Africa, the relative contribution of the different fuel types varies significantly (Figure 4). Although the contribution of solid biofuels is small in North Africa, contribution
FIGURE 2 PM2.5 levels in Africa’s top 10 most populous cities in 2019.

7THE STATE OF AIR QUALITY AND HEALTH IMPACTS IN AFRICA
FIGURE 3 Change in population-weighted annual average PM2.5 exposure for the five countries of interest, 2010–2019
of solid biofuels to ambient PM2.5 ranges between 9%–22% across Sub-Saharan Africa, with the highest contributions in Eastern SubSaharan Africa. Southern Africa stands out for the large relative contribution of fossil fuel use—as much as 40% of the total ambient PM2.5 is linked to use of coal as well as liquid oil and natural gas. In North Africa, as much as 24% of the total ambient PM2.5 is linked with fossil fuel use. The higher contribution from oil and gas in Northern Africa is not surprising since North Africa is a major oil and gas producing region.

When considering sectors that contribute to PM2.5 levels, there are significant differences across countries in Africa. For example, in addition to residential fuel use and fossil fuel use from energy production, transportation, and industry, sources such as windblown dust and fires can make a significant contribution to ambient PM2.5 Across countries in Africa, waste burning is another source category that contributes to PM2.5 levels. Notably, compared to other regions, the contribution of energy production to PM2.5 is limited in many parts of Africa. For example, in the Democratic Republic of the Congo and Kenya, energy production only contributes about 2% of
the total PM2.5 levels whereas in South Africa, energy production contributes to 23% of the ambient PM2.5 levels (Figure 5).
Data presented here represent the contribution of various sources to PM2.5 at the national level, but the relevance of the sources can vary at different spatial scales. For example, although transportation does not show up as the largest source at the national level, it most often contributes significantly to pollutant levels at the city or urban scale. At the city level, major sources of PM2.5 are vehicles (including two-wheelers), diesel generator sets (used for electricity or backup), and waste burning.
DISEASE BURDEN OF PM2.5 IN AFRICA

Across Africa, the disease burden of air pollution is among the highest in the world. Particularly in Sub-Saharan Africa, the rate of deaths linked to air pollution (155 deaths/100,000 people) is much higher than the global average (85.6/100,000). Additionally, as of 2019, particulate matter pollution (including ambient PM2.5 and household air pollution) was the leading risk factor for deaths across
FIGURE
source: McDuffie et al.
8 THE STATE OF AIR QUALITY AND HEALTH IMPACTS IN AFRICA
4 Contribution of key fuel types to PM2.5 exposures in 2019. (Data
2021).
Need for Air Quality Data
Formal air quality standards are an essential component of policy actions to reduce air pollution and improve health. However, most countries in Africa lack national air quality standards, including some of the continent’s most populous countries such as Democratic Republic of the Congo, Egypt, and Ethiopia. In fact, only 17 of Africa’s countries have adopted legislative instruments containing air quality standards: Algeria, Benin, Burkina Faso, Côte d’Ivoire, Egypt, Eswatini, Gambia, Ghana, Kenya, Mauritius, Morocco, Mozambique, Nigeria, Rwanda, Senegal, South Africa, and United Republic of Tanzania.

Despite the lack of formal benchmarks and air quality monitoring infrastructure in many places, important efforts are underway to clean up the air across Africa. A scarcity of air quality monitoring stations creates
high uncertainty for exposure estimates across much of Africa. Previous research has also found that gaps in monitoring quality disproportionately impact low-income countries. For example, while there is one monitor per 0.37 million people in high-income countries, there is only one monitor per 65 million people for low-income countries.
In Sub-Saharan Africa, there is one monitor per 28 million people, further highlighting the need for capacity building and stakeholder engagement at the local, national, and regional levels. MORE
Several governments are already investing in resources to expand air quality monitoring and beginning to implement air quality management plans (Figure ii). Furthermore, independently funded initiatives, including Africa qualité de l’air (AfriqAir), AirQo, and Clean Air Monitoring and Solutions Network (CAMS-Net), are also attempting to fill the data gap through the use of reference-grade as well as low-cost air quality sensors. In addition, there are also project driven monitoring stations in some African countries (e.g., PM2.5 monitors in Ethiopia, Kenya, Rwanda, and Uganda as part of the Eastern Africa GEOHealth Hub).
Egypt
To improve the air quality in its capital city and empower people to bet ter cope with the area’s existing high pollution levels, Egypt launched the Greater Cairo Air Pollution Management and Climate Change Project in 2020. The multifaceted effort aims to modernize the country’s Air Qual ity Management System, improve solid waste management to reduce pol lution from waste burning, and pilot efforts to expand the use of electric buses and vehicles in the city. The project also emphasizes citizen engage ment strategies to inform program designs and encourage behavioral change. MORE
Ethiopia
Ethiopia’s first Air Quality Management Plan focuses on its capital, Addis Ababa. To provide improved measurements and set the stage for future air quality interventions, the United Nations Environment Programme installed five ground-based air quality sensors around the capital region in 2019. This complements reference PM2.5 ground-level measurements from monitors operated by the East Africa GEOHealth Hub, U.S. Embassy in Addis Ababa, and the Addis Ababa City Environmental Protection Authority
South Africa
In 2021, South Africa formalized its commitment to a just transition through a low carbon economy and a climate-resilient society in the form of a Just Transition Framework. A recent court judgment in the country also recognized air pollution as a violation of constitutional rights, potentially paving the way for future actions to improve air quality. MORE
South Africa also has an overarching document that underpins air quality management in the country. It provides clear direction in terms of regula tory requirements, and previous iterations saw the introduction of South Africa’s nationally declared air quality priority areas. MORE .
Regional Cooperation
Regional cooperation can facilitate information-sharing and help drive local action. The Economic Community of West African States (ECOWAS), a commu nity of 15 West African countries, has signed on as a member of the Climate and Clean Air Coalition, a global network supporting action aimed at reducing climate pollutants. In 2018, the coalition released a regional strategy to increase the adoption of liquefied petroleum gas (LPG) in West Africa as a clean er-burning fuel compared with commonly used solid fuels such as coal, wood, and dung. In 2020, ECOWAS member countries adopted regulations aimed at introducing cleaner fuels in the region by 2025. MORE
Mayors from more than 10 cities from Africa have signed the C40 Clean Air Accelerator, making a commitment to provide healthy air for everyone and imple ment substantive clean air policies by 2025.
9THE STATE OF AIR QUALITY AND HEALTH IMPACTS IN AFRICA
Many African countries have seen almost no progress toward cleaner air.
FIGURE ii Examples of clean air actions in countries across Africa.
FIGURE 5 Contribution of key sources to PM2.5 exposures in 2019.
the region. In 2019, of the countries within Africa, the disease burden related to PM2.5 was highest in Northern Africa (55.8/100,000 with an uncertainty interval (UI) of 46.7–65.1/100,000) while the burden of disease was lowest in Central and Eastern Africa (Table 2).
Although age-standardized rates of death are important for comparing the disease burden among countries, total numbers of deaths are useful for identifying where the most people are affected. Across the continent, Egypt saw the highest number of deaths due to ambient PM2.5 (90,600 deaths in 2019) while the lowest number of deaths (less than 100 deaths in 2019) were in São Tomé and Príncipe (Central Africa) and Comoros (Eastern Africa) (Table 3).
The disease burden of air pollution is affected by many factors. Trends in exposures to various forms of pollution have a large
Percentage contribution to ambient PM2.5 influence, but so do factors such as age and health status, which can affect susceptibility to and the likelihood of dying from air pollution–related diseases. Understanding these trends is crucial to informing steps to improve air quality and public health.

PM2.5 contributes to a range of diseases that can lead to illness and early death. Table 4 summarizes the percentages of deaths within each health outcome that is linked to air pollution for the five focus countries. Across all diseases, air pollution contributes to a substantial proportion of deaths, suggesting air quality interventions could play an important role in alleviating the public health impacts of these conditions.
TABLE 2 Death rates linked to PM2.5 across African regions in 2019
Region/Focus Country PM2.5 Death Rate* (UI)**
Northern Africa 55.8 (46.7–65.1)
Egypt 91.4 (67.5–118)
Southern Africa 38.6 (29.8–47.3)
South Africa 44.6 (35.4–53.8)
Western Africa 27.4 (16.7–40.7)
Ghana 39.8 (25.5–56.2)
Central Africa 15.6 (7.9–27)
Democratic Republic of the Congo 12.6 (5.3–23.8)
Eastern Africa 9.8 (5.3–15.8)
Kenya 10.9 (6.5–17)
*Death rate refers to the number of deaths per 100,000 people per year. **UI - Uncertainty interval refers to the 95% uncertainty interval.
TABLE 3 Top 10 countries with the highest number of deaths linked to PM2.5 across Africa in 2019
Country
Total Number of PM2.5-Linked Deaths
Egypt 90,600 (66,800–116,900)
Nigeria 68,500 (41,500–101,700)
Morocco 27,000 (20,300–34,000)
South Africa 25,800 (19,700–30,000)
Algeria 21,600 (15,300–29,000)
Sudan 16,600 (10,200–24,400)
Ghana 12,500 (8,000–17,800)
Democratic Republic of the Congo 11,000 (4,700–20,900)
Cameroon 10,200 (6,100–14,800)
Ethiopia 9,000 (4,200–16,200)
10 THE STATE OF AIR QUALITY AND HEALTH IMPACTS IN AFRICA
Egypt 24 (18–30)
Ghana 24 (18–31)
Democratic Republic of the Congo
(18–37)
South Africa 20 (14–26)
Kenya 30 (17–30)
Desert Dust and Health
(51–76)
(18–32)
(35–58)
(32–39)
(34–42)
Desert dust, also referred to as sand and dust storms (SDS), is a major source of air pollution in Africa. Sand and dust storms are a mixture of particulate matter from desert or arid areas across the world. Dust episodes are often seasonal and dependent on wind patterns, which can affect the size, distance, and height at which the particles travel. Desert dust can also be transported across countries and continents. Over time, SDS have become a growing concern in the context of air pollution, in part due to their impact on PM2.5 and levels of airborne particles measuring 10 µm or less in aerodynamic diameter (PM10). As the climate changes, drought conditions and desertification may impact the extent and severity of SDS across Africa and the world. Although research on the health impact of sand and dust pollution is limited, current evidence indicates that exposure to it can be a significant risk factor for allergic lung diseases such as asthma in children and adults. Epidemiologic studies have also found evidence for effects on the cardiovascular system, although the evidence remains inconclusive and further research is necessary.
The Sahara Desert is one of the main global sources of dust. In Africa, the disease burden of SDS falls largely in the Sahara and Sahel regions of North Africa, as well as in Western Africa.
Respiratory


31 (26–34) 29 (22-36) 29 (19–40) 15 (10–20)
(28–34) 31 (24-39) 36 (25–47) 17 (11–22)
(32–39) 36 (26-44) 50 (38–60) 20 (13–26)
(16–23) 19 (16–23) 18 (13–24) 17 (11–25) 12 (9–15)
(29–36) 30 (26–33) 29 (22–37) 39 (28–50) 22 (20–24)
The harmattan, a dry, northeasterly trade wind, transports large quantities of Saharan dust over the Sahelian region during the dry season, (i.e., November–March). In one recent analysis on sources of PM2.5, of the 25 cities examined in Africa, 13 cities had windblown dust as the top contributor to PM2.5, with an average contribution of 35%.

In September 2021, the WHO published the guidelines for best practices, which focus on the consequences of desert dust and potential strategies for mitigation. It is important to note that although the presence of SDS is largely uncontrollable at the city level, there are short- and long-term policy options to lower local disease burdens including public health alerts, targeted health studies, and establishing/strengthening air quality management programs. However, this requires coordinated actions and communication across African countries. Countries are already implementing a wide range of programs to lower the effects of sand and dust storms. These include early detection systems in Egypt and restoring degraded soils in Kenya. However, in West Africa where yearly trade winds cause the harmattan season (dry and dusty from the Sahara), more work is needed to ensure the health of the population is protected. The World Meteorological Organization has a dedicated forecasting and advisory system (the Sand and Dust Storm Warning Advisory and Assessment System) that is used by countries for forecasting SDS and early warning systems for communities. MORE .
Contribution of W indblown D ust to Total PM2.5
City
Bamako, Mali 87% Gombe, Nigeria 83% Khartoum, Sudan 80% Marrakesh, Morocco 80% Accra, Ghana 65% Oyo, Nigeria 61%

11THE STATE OF AIR QUALITY AND HEALTH IMPACTS IN AFRICA
Concentration
TABLE 4 Percentage of cause-specific deaths linked to air pollution for the five focus countries in 2019 Percentage of Cause-Specific Deaths Country
Diabetes
COPD Stroke Ischemic Heart Disease Lung Cancer Lower
Infections Neonatal
43 (34–53) 35 (30–39)
48 (39–58) 35
31
26
64
38
35
25
19
46
33
Khartoum, Sudan
HOUSEHOLD AIR POLLUTION
The burden of disease for house hold air pollution in Africa is among the highest in the world.
Household air pollution results from the burning of various fuels for cooking or heating using open fires or cookstoves with limited ventilation. Burning fuels such as coal, wood, dung, agricultural residues, and kerosene in such conditions produces an array of harmful pollutants, including PM2.5, black carbon, and carbon monoxide. The concentrations of pollutants in homes where solid fuels are burned often far exceed ambient air pollution levels as well as guideline levels for protecting health.
Household air pollution is not strictly contained within dwellings and is also a major contributor to ambient PM2.5. Whereas the previous section of this report includes data on the contribution of household air pollution to ambient PM2.5, this section focuses only on the exposures to household air pollution that are experienced inside the home.
PATTERNS IN HOUSEHOLD AIR POLLUTION EXPOSURE
Globally, countries in Africa tend to have some of the highest proportion of households using solid fuels for cooking, but a closer look reveals significant contrasts across the continent.
As of 2019, the proportion of households using solid fuels for cooking is highest in Eastern Africa (95%, UI: 94%–95%), Western Africa (83%, UI: 81%–86%), and Central Africa (77%, UI: 74%–79%) (Figure 6). The lowest proportions are seen in Southern Africa (32%, UI: 29%–35%)
and Northern Africa (13%, UI: 12%–14%). Across the continent, the 10 countries with the highest proportion of households cooking with solid fuels are the Central African Republic, South Sudan, Rwanda, Burundi, Niger, Mali, Madagascar, Tanzania, Uganda, and GuineaBissau. In each of these countries, more than 97% of the population uses solid fuels for cooking.
The vast majority of people in many African nations rely on solid fuels for cooking.

Mirroring these regional trends, the five focus countries show the highest exposures to household air pollution in the Democratic Republic of the Congo (93%), Kenya (87%, UI: 86%–87%), and Ghana (70%, UI: 63%–77%), with lower levels in South Africa (13%, UI: 9.6%–16%) and Egypt (less than 1%).
TRENDS IN HOUSEHOLD AIR POLLUTION EXPOSURE
Across Africa, the overall percentage of the population relying on solid fuels for cooking declined slightly between 2010 and 2019. This trend reflects rapid progress in some nations while the number of people exposed to household air pollution has continued to increase in other places.
For example, in Equatorial Guinea, the percentage of the population relying on solid fuels decreased from 50% to 25% between 2010 and 2019. In the same time period, Cabo Verde saw a decrease from 30% to 19%, and Botswana saw a drop from 48% to 39% .
On the other hand, several countries with fast-growing populations experienced net increases in the numbers of people exposed to household air pollution, even as the percentage of their populations using solid fuels for cooking has decreased. Nigeria, for example, reduced the percentage of its population using solid fuels from 82% to 77%, but population growth meant that about 29 million more people were cooking with solid fuels there in 2019 compared to 2010. Ethiopia and the Democratic Republic of the Congo, where more than 90% of the population continues to rely on solid fuels for cooking, also saw net increases in the number of people exposed to household air pollution during this period (Figure 7).
In 2019, a total of more than 800 million people were exposed to household air pollution from the use of solid fuels for cooking.
Woman cooking with solid fuels in Zimbabwe
Photo by Kirk Smith
DISEASE BURDEN FROM HOUSEHOLD AIR POLLUTION IN AFRICA

With the exception of North Africa, countries across the continent witness some of the highest death rates linked to household air pollution and account for about 30% of the disease burden of household air pollution globally. The disease burden from household air pollution is much higher in Africa than in other parts of the world, and many regions of the continent see death rates associated with household air pollution that are markedly higher than the global average of 30 deaths per 100,000 people.
The regional patterns of deaths linked to household air pollution reflect both population sizes and the proportion of each population using solid fuels. Western, Eastern, and Central Africa experience the highest health burden, with household air pollution–linked death rates of 68.8 deaths per 100,000 people (UI: 49.6–89.6/100,000), 67.4 deaths per 100,000 people (UI: 52.4–82.7/100,000), and 57.4 deaths per 100,000 people (UI: 41.3–76.4/100,000), respectively. In some countries within these regions (such as Chad, Mali, and Burkina Faso), rates are as high as 200 deaths per 100,000 people. Some of the continent’s most populous countries also see a large disease burden linked with household air pollution, including Nigeria (128,000 deaths), Ethiopia (67,800 deaths), and Democratic Republic of the Congo (58,000 deaths) (Table 5).
The good news is that the overall disease burden of household air pollution declined between 2010 and 2019 in several regions as the dependence on solid fuels for cooking has dropped. However, at the country level, the trends have been mixed. Among the five focus countries, Kenya still experienced the highest rate of household air pollution–linked deaths at 44.0 deaths per 100,000 people (UI: 32.1–56.7/100,000) in 2019 while Egypt experienced a precipitous drop in deaths from household air

13THE STATE OF AIR QUALITY AND HEALTH IMPACTS IN AFRICA
The International Agency for Research on Cancer has classified indoor burning of coal as a known human carcinogen and indoor burning of biomass as a probable human carcinogen.
FIGURE 7 Trends in percentage of population exposed to household air pollution for the five countries of interest, 2010–2019 FIGURE 6 The percentage of the population using solid fuels for cooking in countries across Africa in 2019.
Sub-Saharan Africa accounts for 30% of the global disease burden from house hold air pollution.
People living in homes using solid fuels can be exposed to PM2.5 levels that are several times higher than even the least stringent WHO Interim Air Quality Target of 35 µg/m3.
Energy, Development, and Air Pollution
Countries across the African continent are uniquely positioned to be at the forefront of household air pollution mitigation due to the potential for substantial health and equity gains. A lack of access to clean energy for cooking and heating can hinder economic growth and development, underscoring the need to scale up energy production as well as energy access in many countries across Africa.
Key Barriers to Clean Energy
Clean fuel is more expensive than biomass, which is often gathered free of monetary cost by households.
Africa contains some of the most remote regions in the world. More than 58% of the total population of Sub-Saharan Africa lives in a rural area.
Where electricity is available, rising demand, and in some cases, illegal connections, have increased the risk of rolling blackouts and rationing.
In 2019, Africa had one of the lowest energy access rates in the world with fewer than one in 20 people who live in the Democratic Republic of the Congo, Ethiopia, Madagascar, Mozambique, Niger, Uganda, and Tanzania having access to clean fuels for cooking. However, access to clean energy is
The reliance on solid fuels is gradually decreasing as more countries transition to cleaner energy sources for cooking and heating.
TABLE 5 Top 10 countries with the highest number of deaths linked to household air pollution across Africa in 2019
Country Total Number of PM2.5-Linked Deaths
Nigeria 128,200 (88,700–171,600)
Ethiopia 67,800 (52,700–82,400)
Democratic Republic of the Congo 58,000 (41,200–77500)
United Republic of Tanzania 39,200 (29,200–49,900)
Somalia 27, 600 (19,600–39,00)
Niger 26, 500 (18,300–35,600)
Mozambique 25,000 (18,800–32,000)
Burkina Faso 24,300 (17,500–32,100)
Uganda 23,000 (16,900–29,300)


Mali 22,600 (15,900–29,700)
Madagascar 21,500 (15,800–27,900)
not equitably distributed, leading to larger disease burdens in certain areas. The increasing demand for energy solutions has resulted in some progress in reducing household air pollutions through cleaner stove initiatives, LPG programs, and energy expansion policies that have increased the size and capability of urban electrical grids.
Ghana: 5 policies for household clean energy including biogas, LPG, and cookstoves initiatives.

South Africa: 6 policies for household clean energy including energy grid expansion and investment in energy distribution.

Kenya: 23 policies for household clean energy including cookstove projects, solar energy, and electric expansion.

The solution to addressing household air pollution may seem simple and its impact clearly evident: improve access to clean cooking and thus improve health. Furthermore, reducing use of solid fuels for cooking can also help reduce short-lived climate pollutants (SLCPs). The United Nations Sustainable Development Goals outlines the importance of “ensuring access to affordable, reliable, sustainable and modern energy for all.” Specifically in the continent, Agenda 2063 lays out a strategic framework that aims to deliver on its goal for inclusive and sustainable development for all residents. In working toward these goals, it is important to consider how energy transitions can be designed to be efficient, economically feasible, sustainable, and environmentally friendly—a complex challenge that requires a nuanced conversation at the nexus of energy, climate, air quality, and health.
pollution and the lowest disease burden at less than 1 death per 100,000 people (UI: 0.03–0.17/100,000) in 2019 (Figure 8).
In addition to its contribution to deaths, household air pollution also contributes to other forms of illness and disability with major impacts on quality of life. For example, long-term exposure to household air pollution is associated with the development of cataracts, an eye disorder that is the leading cause of blindness worldwide. In Western, Eastern, and Central Africa, around half of the annual loss of disability-adjusted life years (DALYs) from cataracts are linked to household air pollution.
A Burden on the Young
Newborns and young children in Africa are disproportionately affected by air pollution, especially household air pollution, in part due to the role pregnant women play in childcare as well as cooking and preparing food. Although the exact biological mechanisms are unknown, the high level of pollutant exposure during cooking increases risk of low birth weight and preterm
14 THE STATE OF AIR QUALITY AND HEALTH IMPACTS IN AFRICA
FIGURE
birth. Air pollution’s impact on fetuses and infants also has longterm consequences for overall health, including issues with lung development and increased susceptibility to communicable diseases, such as lower respiratory infections for young children. MORE
were linked to household air pollution in 2019. By contrast, less than 1% of deaths in children under five in Egypt were linked to household air pollution, while 9.4% (UI: 6.19%–13.1%) of deaths in this age group were linked to exposure to ambient PM2.5 This reflects the high rate of exposure to ambient fine particle pollution but the low rate of exposure to household air pollution in Egypt as compared with Kenya. Ghana and South Africa also see high numbers of deaths among children under five because of air pollution.

Across Africa, 14% of deaths in children under 5 and 17% of deaths in children under 1 are linked to exposure to air pollution. In many African countries, household air pollution is responsible for a significant proportion of the health impacts; it ranks as the fifth leading risk factor for deaths in Sub-Saharan Africa while ambient PM2.5 does not rank among the top 10 risk factors. By contrast, in the case of South Asia, ambient PM2.5 was the fourth leading risk factor while household air pollution was the fifth. For example, in Kenya, 11.8% (UI: 9.65%–14.0%) of deaths in children under five
Huge burden from lower respiratory infections. Examining the number of air pollution–linked deaths by age reveals the devastating disease burden among these youngest age groups and underscores the especially heavy toll of household air pollution (Figure 9). In all five focus countries, at least 90% of lower respiratory infection deaths occur in children under five years, and of the lower respiratory infections in this age group, between 18% (South Africa) and 50% (Democratic Republic of the Congo) are linked to air pollution. Household air pollution is a major driver of these trends.

15THE STATE OF AIR QUALITY AND HEALTH IMPACTS IN AFRICA
8 Trends in death rates linked to household air pollution across Africa between 2010 and 2019.
Air pollution is the third largest risk factor for deaths in children under the age of 5, after malnutrition and water, sanitation and hygiene (WaSH) in Sub-Saharan Africa.
FIGURE 9 Distribution of air pollution–linked deaths in 2019 by age (years, except neonatal [0 to 27 days]). Note that the number of deaths is on a different scale for each country.


Kenya Egypt
South Africa
Ghana
16 THE STATE OF AIR QUALITY AND HEALTH IMPACTS IN AFRICA
DRC Ambient PM2.5 Ambient PM2.5 Ambient PM2.5 Ambient PM2.5 Ambient PM2.5
Ozone pollution is accelerated by and contributes to climate change.
Ground-level ozone is a highly reactive pollutant that has adverse effects on human health, as well as on crops and other vegetation. It is not released directly into the air but is formed in a complex chemical interaction between nitrogen oxides and volatile organic compounds in the presence of sunlight. Nitrogen oxides and volatile organic compounds are produced by a variety of human activities, including the burning of fossil fuels in motor vehicles, power plants, industrial boilers, and home heating systems, as well as through oil and gas extraction and other industrial activities.
Certain types of volatile organic compounds can also be emitted from natural sources, such as trees. Long-term exposure to ozone has been linked to a variety of health concerns, including the development of COPD.
Studies suggest that global ozone levels today are 30% to 70% higher than they were 100 years ago. This increase reflects rising emissions of the chemicals that form ozone, as well as increases in global and local temperatures, which can accelerate ozone formation. Ozone is also a greenhouse gas, contributing to the warming on which it thrives.
And, alongside these concerns, ozone threatens the production of major crops. Higher levels of ozone can reduce crop yields and increase the risk of food insecurity and malnutrition. For example, higher ozone levels have been estimated to decrease wheat yield by up to 13% in Sub-Saharan Africa. MORE
In urban areas, ozone levels can vary widely within and around cities depending on local and regional sources. In addition, ozone is an important regional pollutant, traveling long distances to suburban and rural areas and across national boundaries, leading to high ozone levels far from the emission sources that contribute to its formation.
PATTERNS AND TRENDS IN OZONE EXPOSURE
Ozone exposures across the continent vary from a low of about 32 ppb in Comoros to a high of 54 ppb in Algeria. Overall, ozone exposures rose across Africa between 2010 and 2019 (Figure 10; Table 6). Although Northern Africa has the highest ozone concentrations (53.5 ppb, UI: 53.3–53.8 ppb), this region has experienced the slowest increase in ozone pollution among the African regions. By contrast, ozone exposures have risen steadily since 2010 in the other regions, with the greatest increase taking place in Eastern Africa (increase of 8.5 ppb or 26%), followed by Western Africa (9 ppb or 22%).
Southern and Central Africa also experienced sizable increases of 4.6 ppb (13%) and 5.5 ppb (14%), respectively. Ethiopia saw the largest increase of any individual country, going from 34.9 ppb (95% UI: 34.5–35.3) in 2010 to 44.3 ppb (95% UI: 43.8–44.6) in 2019, a 27% increase. The trend is broadly consistent with global data— ozone levels have increased in 12 of the world’s 20 most populous countries since 2010. Countries including Nigeria, Ethiopia, and the Democratic Republic of the Congo have seen steep increases in ozone levels in the past decade. On the other hand, Egypt saw a modest decline of 3% between 2010 and 2019 (Figure 11).
Ozone exposure is slowly but steadily increasing across Africa.
TABLE 6 Population-weighted average seasonal 8-hour maximum ozone exposure (ppb) for 2019
Region/Focus Country Ozone Exposure
Northern Africa 53.5 (53.3–53.8)
Egypt 52.3 (51.2–53.5)
Southern Africa 40.5 (40–41.1)
South Africa 39.9 (39.2–40.7)
Western Africa 49.5 (49.2–49.7)
Ghana 49.3 (47.8–50.8)
Central Africa 46.3 (45.7–46.9)
Democratic Republic of the Congo 47.4 (46.8-48.1)
Eastern Africa 41.1 (40.9–41.3)
Kenya 39.1 (38.4–39.9)
OZONE
DISEASE BURDEN OF OZONE IN AFRICA

Short-term exposure to ozone is linked to asthma exacerbation and other respiratory problems. Long-term exposure is associated with COPD, a respiratory condition characterized by chronic obstruction of lung airflow that interferes with normal breathing and takes years to develop with impacts only observed in adults. Overall, the disease burden from ozone in Africa is lower than the health burdens imposed by PM2.5 and household air pollution. Death rates
FIGURE 10 Population-weighted average seasonal 8-hour maximum ozone concen tration in countries across Africa in 2019.
FIGURE 11 Trends in popula tion-weighted average seasonal 8-hour maximum ozone concentration in the five focus countries between 2010 and 2019.
Overall, Africa sees a lower disease burden from ozone exposure than the global average.
from ozone-associated COPD are also lower in Africa, on average, compared with the global average of 4.7 deaths per 100,000 people. In line with the regional trends in ozone exposure, Northern Africa sees the highest ozone-attributable death rate at 1.69 deaths per 100,000 people (UI: 0.77–2.68/100,000).

18 THE STATE OF AIR QUALITY AND HEALTH IMPACTS IN AFRICA
Air pollution imposes a heavy and growing burden on health for much of Africa’s population. Millions of people on the diverse continent of Africa suffer severe illnesses and early death each year because of long-term exposure to air pollution. The impacts on babies and young children are of particular concern, with air pollution accounting for a large portion of deadly respiratory infections and other conditions that prevent so many from reaching their fifth birthday.
The fact that much of this burden is potentially avoidable is tragic and yet gives hope that action for clean air can save lives and improve health across the continent. The tragedy is in the devastating magnitude of the loss of life and the persistently high air pollution levels across much of the continent. As countries continue to experience high levels of air pollution and growing and aging populations, this burden will increase. Although improvements in treatment for those already suffering from heart disease and other noncommunicable diseases will play a key role, aggressive strategies are needed to prevent new cases of noncommunicable diseases by tackling their major risk factors (e.g., high blood pressure, smoking, and air pollution) because healthcare access continues to be limited or unaffordable in many cases. The hope lies in the possibility that change may be on the horizon.
Although air pollution exposures remain high across the continent, some countries are beginning to undertake policy measures to improve air quality. Efforts to reduce exposure to household air pollution, which in Africa accounts for more than three times the number of deaths as exposure to ambient PM2.5, have substantially increased the adoption of cleaner cooking technologies in some countries.

Implementing targeted emission reduction strategies for the largest contributors to air pollution across the continent (household fuel combustion, transportation, and open burning), along with enhanced air quality monitoring, would greatly improve air quality and provide health, economic, and societal benefits.
By publishing these trends, we seek to focus public attention on the progress, but also on the major problems that have yet to be addressed. Achieving cleaner air in Africa will require local, national, and regional efforts and collaborations involving multiple sectors, including health, energy, transport, industry, agriculture, and urban planning. Our goal is to inform actions to reduce pollution in ways that have the greatest potential to benefit health. While the health impacts of air pollution in Africa are large, there is also cause for optimism: documented examples from locations where air quality management approaches have reduced pollution show that when air quality improves, so does population health.
It is important to recognize that variations in the disease burden linked to air pollution reflect not only differences in air pollution exposures but other social, economic, and demographic factors that affect the underlying health and vulnerability of populations. Expanding public awareness of air quality and the burden of disease caused by air pollution is an essential step in reducing air pollution and improving public health. Although regional trends are informative and international collaborations are extremely valuable, each country will need to explore and understand its own data to design effective strategies to reduce air pollution and its health burdens. Through the State of Global Air platform, we aim to continue providing data at all geographical scales to help inform these critical actions toward cleaner air.
CONCLUSIONS
Although there is still much work to do, the declining proportion of people exposed to household air pollution is a success worth celebrating and a beacon of hope for future efforts.
Cairo, Egypt
How We Estimate Air Pollution Exposures
The GBD project combines multiple sources of data to estimate air pollution exposures around the world. Although ground-based air quality monitors provide high-quality, finegrained data, monitoring remains limited in many regions, particularly in low- and middle-income countries. To fill the data gaps and to provide a consistent view of air pollution levels, researchers combine data from ground measurements with data from satellites; global chemical transport models that use data on emissions, chemical reactions, and meteorological conditions to estimate the movement and concentration of pollutants; and surveys or government records relevant to major air pollution indicators, such as the proportion of people living in households where cooking is done with solid fuels.
Different air pollutants are expressed in different ways:
• PM2.5 concentrations are measured in micrograms of particulate matter per cubic meter of air, or µg/m3
• Household air pollution, a mixture of fine particles and gases, is measured in terms of the proportion of people living in households where cooking is done with solid fuels. For purposes of estimating health impacts, these proportions are ultimately translated into exposures to PM2.5 in the home. To make sure that the estimated exposure to PM2.5 represents household exposures only, GBD scientists subtract the ambient PM2.5 exposure from the household exposure for each location at the time of measurement.
• Ozone exposures are calculated in terms of the populationweighted average seasonal 8-hour daily maximum concentration in parts per billion (ppb).
To estimate air pollution exposures for people living in a given country or region, researchers calculate a populationweighted annual average concentration by combining the number of people living within that area and the pollutant concentrations to which they are exposed. Populationweighted annual average concentrations are better estimates of population exposures, because they give proportionately greater weight to the air pollution experienced where most people live.
More information about how we estimate air pollution exposure is available at https://www.stateofglobalair.org/data/ estimate-exposure
How We Estimate Burden of Disease
The GBD project’s estimation of the burden of disease begins with a systematic evaluation of the scientific evidence and whether it is strong enough to attribute a given health outcome or cause of death to a particular pollutant. Every risk–outcome pair included in the GBD has undergone this rigorous evaluation. For those outcomes linked through this process to individual pollutants, the GBD project then calculates air pollution’s burden of disease in each country using the following:
• Mathematical functions, derived from epidemiological studies, which relate different levels of exposure to the increased risk of death or disability from each cause, by age and sex, where applicable.
• Estimates of population exposure to PM2.5, household air pollution, and ozone.
• Country-specific data on underlying rates of disease and death for each pollution-linked disease.
• Population size and demographic data (age and sex) for each country.
The results of these calculations are expressed in four main ways:
1. Total number of deaths: The number of deaths in a given year attributable to air pollution that likely occurred earlier than would be expected in the absence of air pollution.
2. Disability-adjusted life-years (DALYs): The sum of the years of life lost from those early deaths plus the years lived with a disability, such as paralysis from a stroke related to air pollution exposure.
3. Age-standardized rates: The total number of deaths or DALYs per 100,000 people, calculated based on a standard distribution of population across age categories. Agestandardized rates allow direct comparison of the disease burden among countries with very different population sizes and distribution of ages in the population (e.g., older, or younger). Higher air pollution–attributable age-standardized rates of disease reflect a combination of higher air pollution levels and/or sicker populations.
4. Loss of life expectancy at birth: The difference in years between a person’s expected lifespan and the length of life that would be expected if air pollution were not present.
Estimates of scientific uncertainty are provided for every value in the form of 95% uncertainty intervals (UIs), representing the range between the 2.5th and 97.5th percentiles of the distribution of possible values.
More information about how we estimate the burden of disease from air pollution is available at stateofglobalair.org/ data/estimate-burden
20 THE STATE OF AIR QUALITY AND HEALTH IMPACTS IN AFRICA

ABBREVIATIONS COPD chronic obstructive pulmonary disease DALYs disability-adjusted life years ECOWAS Economic Community of West African States GBD Global Burden of Disease LPG liquefied petroleum gas PM10 particulate matter ≤10 µm in aerodynamic diameter PM2.5 particulate matter ≤2.5 µm in aerodynamic diameter SDS sand and dust storms UI uncertainty interval WHO World Health Organization
Accra, Ghana
Photo by Etornam Ahiator on Unsplash
GLOBAL BURDEN OF DISEASE 2019 METHODS
These resources provide background details on the latest GBD methods used to estimate PM2.5, ozone, and household air pollution exposures and the deaths reported here.
Cohen AJ, Brauer M, Burnett R, Anderson HR, Frostad J, Estep K, et al. 2017. Estimates and 25-year trends of the global burden of disease attributable to ambient air pollution: An analysis of data from the Global Burden of Diseases Study 2015. Lancet 389:1907–1918; doi:10.1016/S0140-6736(17)30505-6
GBD 2019 Risk Factors Collaborators. 2020. Global burden of 87 risk factors in 204 countries and territories, 1990–2019: A systematic analysis for the Global Burden of Disease Study 2019. Lancet 396:1223–1249; https://doi.org/10.1016/S01406736(20)30752-2
Explore and download additional information and data on mortality and disease burden for air pollution, as well as other risk factors, at the IHME GBD Compare site https://vizhub.healthdata.org/gbd-compare/
HEALTH EFFECTS OF AIR POLLUTION
Boogaard H, Walker K, Cohen A. 2019. Air pollution: The emergence of a major global health risk factor. Int Health 11:417–421; doi:10.1093/inthealth/ihz078
Health Effects Institute. 2020. State of Global Air 2020. Special Report. Boston, MA:Health Effects Institute.
World Health Organization. 2021. WHO Global Air Quality Guidelines: Particulate Matter (PM2.5 and PM10), Ozone, Nitrogen Dioxide, Sulfur Dioxide and Carbon Monoxide. World Health Organization. Available: https://apps.who.int/iris/ handle/10665/345329 License: CC BY-NC-SA 3.0 IGO.
ECONOMIC IMPACTS OF AIR POLLUTION AND DISEASE
World Bank. 2022. The Global Health Cost of PM2.5 Air Pollution: A Case for Action Beyond 2021. International Development in Focus. Washington, DC:World Bank. Available: https://openknowledge. worldbank.org/handle/10986/36501 License: CC BY 3.0 IGO.
REPORTS/DATA FOCUSED ON AFRICA
Glenn BE, Espira LM, Larson MC, Larsen PS. 2022. Ambient air pollution and non-communicable respiratory illness in subSaharan Africa: A systematic review of the literature. Environ Health 21:40; doi:10.1186/s12940-022-00852-0.
Fisher S, Bellinger DC, Cropper ML, Kumar P, Binagwaho A, Koudenoukpo JB, et al. 2021. Air pollution and development in Africa: Impacts on health, the economy, and human capital. The Lancet Planetary Health 5:e681–e688; doi.10.1016/S2542-5196(21)00201-1
Katoto PD, Byamungu L, Brand AS, Mokaya J, Strijdom H, Goswami N, et al. 2019. Ambient air pollution and health in Sub-Saharan Africa: Current evidence, perspectives and a call to action. Environ Res 173:174–188; doi.10.1016/j.envres.2019.03.029.
Mebratu D, Mbandi A. 2022. Open Burning of Waste in Africa: Challenges and Opportunities. Engineering X (founded by the Royal Academy of Engineering and Lloyd’s Register Foundation) and the United Nations High Level Champions (UNHLC). London:Royal Academy of Engineering. Roy R. 2016. The Cost of Air Pollution in Africa. OECD Development Centre Working Papers, No. 333. Available: https://www.oecd-ilibrary. org/development/the-cost-of-air-pollution-in-africa_5jlqzq77x6f8-en [accessed 30 September 2022].
UNEP. 2021. Actions on Air Quality in Africa. Available: https:// wedocs.unep.org/bitstream/handle/20.500.11822/36696/AAQA_ES.pdf [accessed 30 September 2022].
URBAN AIR QUALITY
Martin RV, Brauer M, van Donkelaar A, Shaddick G, Narain U, Dey S. 2019. No one knows which city has the highest concentration of fine particulate matter. Atmos Environ 3:100040; https://doi. org/10.1016/j.aeaoa.2019.100040
OpenAQ. 2020. Open Air Quality Data: The Global State of Play. Available: https://openaq.org/assets/files/2020_OpenData_ StateofPlay.pdf [accessed 20 November 2021].
HOUSEHOLD AIR POLLUTION
Clean Cooking Alliance. 2021. Hearths and Health: Evidence of the Global Impact of Household Air Pollution on Health.Available: https:// storymaps.arcgis.com/stories/e455c0a25dcf4b92a859f5d38a26ce27
HEI Household Air Pollution Working Group. 2018. Household Air Pollution and Noncommunicable Diseases. Communication 18. Boston, MA:Health Effects Institute.
SOURCES OF AIR POLLUTION
McDuffie E, Martin R, Yin H, Brauer M. 2021. Global Burden of Disease from Major Air Pollution Sources (GBD MAPS): A Global Approach. Research Report 210. Available: https://www.healtheffects.org/ publication/global-burden-disease-major-air-pollution-sources-gbdmaps-global-approach
KEY RESOURCES
CONTRIBUTORS AND FUNDING
CONTRIBUTORS
Health Effects Institute

HEI is an independent global health and air pollution research institute. It is the primary developer of this report and the coordinator of input from all other members of the team, and the facilitator of contact with media partners. Key HEI contributors include Pallavi Pant, head of global health; Victor Nthusi, consulting research fellow; Joanna Keel, research assistant; Ada Wright, research assistant; Amy Andreini, communications assistant; Alexis Vaskas, digital communications manager; Hope Green, editorial project manager; Kristin Eckles, senior editorial manager; Tom Champoux, director of science communications; Aaron Cohen, consulting principal scientist, Robert O’Keefe, vice president; and Dan Greenbaum, president.

Reviewers
We would like to thank Dr. Caradee Wright, South Africa Medical Research Council (South Africa); Dr. Patrick Katoto, University of Cape Town (South Africa); Dr. Kiros Berhane and Dr. Dan Westervelt, Columbia University (USA); and Seneca Naidoo, Simon Sambou, and Tibebu Assefa, C40, for their inputs and feedback.
Other Contributors
ZevRoss Spatial Analysis provided data visualization support; Mary Brennan edited the report; and David Wade composed the report. Creative Science Writing provided writing support for the report and website. Innodata, Inc., provided the translations.
FUNDING
This work was supported by the Clean Air Fund.
Kinshasa DRC
