20 minute read
DOSSIER


Statistical sources of environmental risks
AMY CANO PRENTICE
Advertisement
University College of London
Environmental events carry with them a degree of uncertainty that hampers decision-making. Standard approaches to decision-making involve measurement of the likelihood of different environmental outcomes and how actions generate reactions. An essential adaptation to environmental uncertainty is to include measurements of risk and expectations of instability. To the end of building more robust measurements of environmental risk, this article analyses the main international sources of statistical data regarding environmental risks. This article also considers the strengths, scope and limitations of each source, as well as outline the methodology of noteworthy indicators.
Although national-level institutions have conducted efforts towards a valuation of environmental risks, such as the USAID 1 and Germanwatch 2 , this article will focus on statistics provided by international organisations. The latter not only provide more wideranging scope of measurements and issues of concern, but also aim to synthesise existing literature and are comparable among each other.
WORLD HEALTH ORGANISATION
The World Health Organisation (WHO) frames environmental risks within risks towards global health. WHO’s yearly publications systematically quantify how diseases are impacted by environmental risks and determine the regions and populations that are most vulnerable to environmentally mediated death, disease and injury.
1 For more information on the different measurements for assessing climate risk, please see Section 5 of the document ‘Climate Risk Management for USAID Projects and Activities’, available here: https://pdf.usaid.gov/pdf_docs/PBAAF664.pdf [Last accessed 15
January 2020]. 2 Germanwatch’s Global Climate Risk Index is updated annually to assess climate-related risks by country, globally. See: https://germanwatch.org/en/cri [Last accessed 15 January 2020].
A noteworthy indicator is the population attributable fraction 3 . This is the proportional reduction in death or disease that would occur if exposure to a risk were removed. The population attributable fraction for each disease is calculated with the use of:
1. Comparative risk assessments, involving data on population exposure to the environmental risk in question, exposure-risk estimates, and a counterfactual exposure distribution of reduced environmental risks. 2. Calculations based on epidemiological data, where there is an abundance of data on disease in populations with high environmental risks, and where said disease could be attributed to the environmental risk in question. These calculations are generally based on assumptions, extrapolation and weaker evidence than the former. These are therefore used in the absence of comparative risk assessments. 3. Expert surveys, in the absence of data for the previous two. 4. Some diseases can be entirely attributed to environmental risks due to knowledge of the transmission pathway of the disease, which involve specific environmental conditions.
The data used for this indicator is extracted from global estimates calculated by the WHO, national estimates and meta-analyses on disease reduction from interventions and on environmental determinants of health.
Another indicator is the environmental burden of disease 4 , which quantifies the amount of disease attributable to environmental risks, for the major diseases and injuries classified by WHO. This indicator is useful to identify opportunities for prevention and add impetus to global efforts in order to encourage sound preventive measures. The preferred method to calculate the environmental burden of disease is a comparative risk assessment. The following components are needed:
1. Disease and death statistics for the population in question 2. The counterfactual level of risk factor exposure which usually corresponds to a minimum rather than null risk exposure. 3. The population attributable fraction, mentioned above.
Disease burden (%) 9-14 15-16 17-18 19-22 23-31
4 Prüss-Üstün A, et al. Introduction and methods: assessing the environmental burden of disease at national and local levels. Geneva, World Health Organization, 2003. (WHO Environmental Burden of Disease Series, No. 1).
5
For detailed data sets and visualisations of the Global Burden of Disease see: http://www.healthdata.org/gbd [Last accessed 15 January 2020].
FIGURE 1. Fraction of disease burden attributable to the environment by country, 2012.
The strength of WHO’s indicators lies in the recognition of the interlinked nature between environmental and social risk factors. Social factors mediate exposure to environmental risk factors such as working conditions, housing, water and sanitation. By illustrating and quantifying the impact of social determinants on exposure to environmental risks, these indicators establish the basis for an anthropocentric approach environmental risks that can be mediated by different actors.
Additionally, these indicators tackle one of the main weaknesses of the global environmental regime, which is the lack of harmonised monitoring and reporting of environmental indicators. The WHO facilitates the widespread use of this methodology by circulating explanatory publications on the methodology of these indicators, intended for national and local actors. This encourages the standardised use of these indicators. Proof of success can be seen in that organizations and institutes use these indicators, such as the Institute for Health Metrics and Evaluation (IHME) 5 .
The reach of these indicators is conditioned by their scope. The focus on disease prevention strategies means
Data not available Not applicable
0 850 1700 3400 Kilometres
that there is a larger emphasis on the quantification of disease attributable to environmental risks, than on the quantification of the risks themselves. Another limitation of these indicators is related to the counterfactual component of both indicators. It is generally not possible to estimate a formal confidence interval (given that the uncertainty of the various data sets is not always known) with respects to the measure of exposure and the exposure-risk relationship.
WORLD BANK
The World Bank devotes efforts towards environmental valuation – the process of placing monetary value on environmental impacts – as it is an essential element for incorporating the benefits and costs of environmental effects into the analysis of alternatives.
The International Finance Corporation, within the World Bank Group, defines Environmental and Social Performance Standards 6 to ensure that private sector actors who receive funding take account of environmental and social risks. The first Performance Standard involves the Assessment and Management of Environmental and Social Risks and Impacts, and the sixth Performance Standard, the Biodiversity Conservation and Sustainable Management of Living Natural Resources.
Using the criteria from the aforementioned Performance Standards One and Six, the International Finance Corporation have created a database called The Global Map of Environmental & Social Risk in Agro-commodity Production (GMAP) 7 in partnership with the World Wildlife Fund. This aggregates information on environmental and social risks associated with agro-commodity primary production. The methodology uses a traditional risk matrix to quantify production risk. A risk score for each indicator is derived from a combination of two factors: 1. probability of occurrence, 2. severity of impact. The higher the score, the higher the risk. The analysis can help to identify and prioritize areas for potential risk management in the supply of certain commodities.
To date, this tool has only been applied to China, Colombia and Zambia for Rapeseed, Cocoa and Wheat, respectively. Nonetheless, this methodology remains available to be applied on a wider scale. The strength of this tool is the ease of application to different commodities, making it accessible for concerned producers and investors. Although the methodology may seem simple, the utility of this tool lies in the combination of data from reputable sources into a usable indicator of risk for agribusiness. It’s direct tie to the International Finance Corporation means that predictions of risk are bolstered by funding opportunities.
More broadly, the World Bank hosts a Climate and Disaster Risk Screening Tool 8 . It aims to identify short and long term climate risks that could affect the sustainability of development projects and national development policy. Individual project managers, local and national-level policy developers can undergo risk assessments, which will indicate a traffic-light code for the severity of environmental risk faced by the project. The methodology is based on elements of the risk analysis framework adopted by the Intergovernmental Panel on Climate Change (IPCC) and the framework for vulnerability assessment used by the United States Agency for International Development (USAID) 9 . Rather than calculate risks, it aims to make historic and projected data on climate change available in an accessible manner. The methodology involves an assessment of exposure to environmental hazards, potential impacts of these, and adaptive capacity, to conclude with the overall environmental risk.
What sets this tool apart is that it does not aim to provide a numerical risk analysis. Rather, it is an earlystage screening tool to identify potential sources of risk. Its focus is on identifying rather than quantifying environmental risks. This tool has the potential to be used as a foundation to build a more accurate risk assessment when combined with the World Bank’s Climate Variability Tool 10 and monitoring and forecasts on a plethora of environmental indicators.
EUROSTAT
Whereas indicators of environmental risk mostly focus on basing estimations on past extreme climate events, Eurostat’s addition to the field has a unique approach. The emphasis is on emerging risks, developing tools to anticipate changes we do not yet observe.
The term emerging risk has entered the scientific and policy-making vocabulary amongst European
8 See: https://climatescreeningtools.worldbank.org [Last accessed 15 January 2020]. 9 See: https://pdf.usaid.gov/pdf_docs/PA00KZ84.pdf [Last accessed 15 January 2020]. 10 See: https://iridl.ldeo.columbia.edu/maproom/Global/World_Bank/
Climate_Variability/index.html [Last accessed 15 January 2020].
organisations such as the European Food Safety Authority. Noting the lack of a unified conception in the literature of what constitutes an emerging risk, Eurostat defines it as a stage in the risk cycle prior to full recognition at the scientific and societal level. The path of risk emergence has also been defined, to encourage targeted management of emerging risks.
Eurostat establishes early warning signals 11 , which are used to identify emerging risks. Several types of early warning signals are proposed. Just to name a few:
1. Foresight approaches, which involves collecting and organising a wide range of information to envisage possible future scenarios. This can be quantitative, qualitative or a combination of both. This technique has been employed by the Intergovernmental Panel on Climate Change (IPCC), the Millennium Ecosystem Assessment and the Intergovernmental Science—Policy Platform on
Biodiversity and Ecosystem Services (IPBES). 2. Monitoring technology, that survey the environment for indicators of environmental change. 3. Analysing time-series data and long-term trends for variations in the rate of change, such as a critical slowing down or a critical acceleration. For example, critical slowing down has been successfully applied to predict major changes in aquatic systems and may help to anticipate future tipping points in the climate.
The limitation of these indicators for our current pursuit is that they identify, rather than quantify environmental risk. We should expect a quantification of emerging risks to be born out of early warning signals soon.
EUROPEAN COMMISSION
Focusing on specific environmental risks, the European Commission has quantified risks on particular issues. For example, on the topic of flood risks, the Commission has developed a framework for the statistical risk of river flooding 12 that accounts for the spatially heterogeneous nature of flood events. This indicator involves:
1. Evaluating potential flood hazard. This is done by analysing observed flood events and then generating a set of possible future events across the river network and which can determine flood risk for specific sections of the network. 2. Characterising the potential negative consequences of flooding. Three impact indicators are examined to adapt the indicator to a specific area: the number of sites affected by flooding, potential affected buildings; and potential direct monetary building damage. 3. Combining the above to quantify the expected annual flood impact, in terms of expected annual damage, along with the probability of various levels of loss.
Another indicator of environmental risk established by the European Commission is the oil spill risk 13 . This provides an accurate risk assessment by incorporating local environmental factors and socio-economic conditions. It involves a measure of:
1. Hazard: the probability that an oil spill will occur in a specific location. Data for this is obtained from historic oil spills that revealed the most favourable weather conditions for spills. 2. Vulnerability: the expected damage to the local environment and economic activities. This depends on the physical condition of the shore and water, its biological condition and the duration of interruption to socio-economic activities when affected by an oil spill. 3. Risk assessment: areas at major risk of oil spills, combining the probability of the point becoming contaminated by oil, oil exposure time, and its physical, biological and socio-economic vulnerability.
The strength of these indicators lies in their accessible nature. Providing a plethora of indicators for specific environmental risks, ranging from the index of land susceptibility to wind erosion 14 to an upcoming risk assessment of the threat of invasive species to
12 See: https://ec.europa.eu/environment/integration/research/news alert/pdf/40si_en.pdf [Last accessed 15 January 2020]. 13 See: https://ec.europa.eu/environment/integration/research/newsa lert/pdf/new_online_oil_spill_risk_tool_provides_local_specific_information_coastal_490na2_en.pdf [Last accessed 15 January 2020]. 14 See: https://onlinelibrary.wiley.com/doi/full/10.1002/ldr.2318 [Last accessed 15 January 2020].
biodiversity 15 , there is an indicator for every actor in the field. These indicators have the advantage of being presented in a comprehensible way, as their purpose is outward-facing. To this end, there is an online portal where national authorities or private actors can contact the researchers to implement the indicator in a defined location.
ORGANISATION FOR ECONOMIC CO-OPERATION AND DEVELOPMENT
The OECD provides exhaustive data sets for statistics on environmental risks. Their specific focus is the effect on health and productivity of environmental risks. The indicator mortality, morbidity and welfare cost from exposure to environment-related risks 16 employs the aforementioned methodology for the WHO’s environmental burden of disease to calculate mortality and Disability-Adjusted Life Years (DALYs) 17 from exposure to environmental risks. DALYs can be thought of as one lost year of healthy life. The sum of these DALYs across the population is equivalent to the WHO’s burden of disease.
The OECD’s database provides data for both OECD and non-OECD countries on DALYs, premature deaths attributable to environmental risks, welfare cost of such premature deaths and the value of a statistical life 18 . The measure of the value of a statistical life has been adapted to properly assess the value of environmental risks. It represents the value a given population places ex ante on avoiding death, and is based on the sum of money each individual is prepared to pay for a given reduction in the risk of premature death. However, the method used to establish the value of a statistical life varies widely. For example, studies in the United States employ Revealed Preference, whereas European, Canadian and Australian studies rely more on Stated Preference. For this reason, the OECD have conducted a meta-analysis 19 on the different methodologies, and presents advice on how to best to use this indicator as an assessment of environmental risk.
This database also includes measures of the
environmentally adjusted multifactor productivity
15 See: https://ec.europa.eu/environment/integration/research/newsal ert/pdf/how_big_a_threat_do_invasive_alien_species_pose_to_european_biodiversity_514na5_en.pdf [Last accessed 15 January 2020]. 16 See: https://stats.oecd.org/Index.aspx?DataSetCode=EXP_MORSC [Last accessed 15 January 2020]. 17 See: https://www.who.int/healthinfo/global_burden_disease/metrics_daly/en/ [Last accessed 15 January 2020]. 18 See: https://www.oecd.org/environment/tools-evaluation/valuingmor talityimpacts.htm [Last accessed 15 January 2020]. 19 See: https://one.oecd.org/document/ENV/EPOC/WPNEP(2010)9/
FINAL/en/pdf [Last accessed 15 January 2020].
growth 20 , which measures a country’s ability to generate income from a given set of inputs while accounting for the consumption of natural resources and the production of undesirable environmental by-products. This indicator usefully incorporates consideration of environmental services and damages into traditional measures of productivity.
By virtue of the effort to incorporate and synthesise measures from other organisations (such as those by the WHO), OECD datasets are able to achieve a greater degree of detail. What sets this dataset apart is the separation of said indicators by the kind of environmental risk 21 . The quantified impact of several environmental risks can be seen for any one of the above indicators. The environmental risks that are accounted for are: air pollution, lead, residential radon, unsafe water, sanitation and handwashing, environment-related occupational risks and environment-related behavioural risks.
In line with our present purposes, the OECD has also reported on the actuarial role in the management of environmental risks 21 . Two structurally distinct types of risks are distinguished that are to be treated differently by an insurer: environmental liability risk, the financial risk associated with environmental pollution, and natural catastrophe risk, the risk of damages in connection with extreme environmental events. Acknowledging that environmental risk is highly influenced by the legal and regulatory framework, a comparative analysis of these is made. This report also presents an overview of the different environmental insurance products that currently exist on the international market, suggesting that these products include an ex ante internalization of pollution costs, thus providing an incentive for increased prevention and precaution.
20 See: https://www.oecd-ilibrary.org/environment/environmentallyadjusted-multifactor-productivity_5jlr2z7ntkf8-en [Last accessed 15 January 2020]. 21 See: http://www.oecd.org/finance/financial-markets/1939368.pdf [Last accessed 15 January 2020].
Rather than treating environmental risks as a whole, as other indicators do, this global research organisation assesses specific environmental risks. For example, the Aqueduct water risk framework 22 combines
22 See: https://www.wri.org/aqueduct#aqueduct-tools [Last accessed 15 January 2020].
thirteen water risk indicators into a composite overall water risk score for agriculture and food security. This indicator presented are:
Water stress, the ratio of total water withdrawals to available renewable surface and groundwater supplies. Higher values indicate more competition among users. Groundwater table decline, the average decline of the groundwater table as the average change
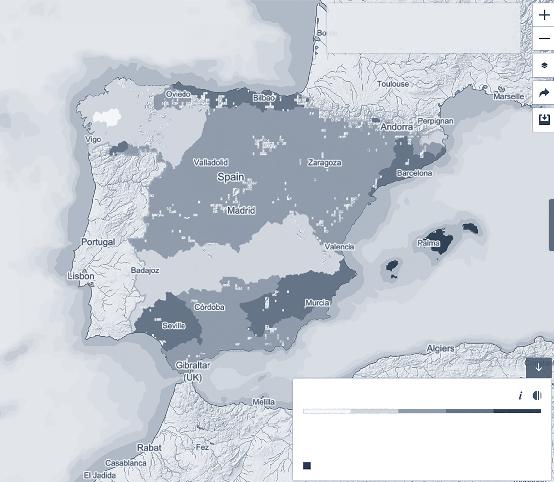
FIGURE 2. Aqueduct water risk framework.
Global Risk Of Water Stress In Irrigated & Rainfed Crop Producing Areas
Risk Of Coastal Eutrophication Potential In Irrigated & Rainfed Crop Producing Areas In Spain

Water Stress
Low
(<10%) Lowmedium (10-20%) Mediumhigh (20-40%)
Arid and low water use No data High
(40-80%) Extremely high (>80%)
Risk Of Drought Risk In Irrigated & Rainfed Crop Producing Areas In Spain
Coastal Eutrophication Potential
Low Lowmedium (-5 to 0)) Mediumhigh (0 to 1) High Extremely high (>5)
Drought Risk

Low Lowmedium (0.2-0.4) Medium Mediumhigh (0.6-0.8) High
for the period of study, expressed in centimetres per year. Higher values indicate higher levels of unsustainable groundwater withdrawals. Interannual variability, the average yearly variability of available water supply. Higher values indicate wider variations in available supply from year to year. Seasonal variability, the average within-year variability of available water supply. Higher values indicate wider variations of available supply within a year. Drought risk measures where droughts are likely to occur, the population and assets exposed, and the vulnerability of the population and assets to adverse effects. Higher values indicate higher risk of drought. Coastal eutrophication potential, the potential for excess nitrogen, phosphorus, and and silica to stimulate harmful algal blooms in coastal waters. Higher values indicate higher levels of excess nutrients, creating more favourable conditions for harmful algal growth and eutrophication in coastal waters downstream. Share of population at risk of hunger represents the percentage of the population at risk of suffering from malnourishment.
This tool remains primarily a prioritization tool and should be augmented by more detailed local and regional analysis. For example, a central measurement of water risk is overall water risk, which is not directly measured by the World Resources Institute.
Another indicator for measuring the environmental risk of a specific issue is the PALM Risk Tool 23 , which stands for Prioritizing Areas, Landscapes, and Mills. It offers an automated way to assess the risk of deforestation associated with a palm oil mill and its supply base. It comprises of two indices: past deforestation- related
impacts and potential for future deforestation- related
impacts. The methodology calculates the average value of each indicator for the full mill set, then assesses how far above or below the average level of risk a particular mill falls on each indicator. The way that the PALM Risk Tool is calculated means that it satisfies multiple uses. When the indicators are aggregated by index, users can disaggregate past performance and areas of possible future concern. When the indicators are aggregated by theme (such as primary forests, peatlands, protected areas etc.), users can determine which environmental problems are the most pervasive in their supply chain.
The World Resources Institute also publishes bestpractice documents on regional risk pools 24 for of environmental events. Three such pools have been developed to provide sovereign parametric insurance to developing countries: the Caribbean Catastrophe Risk Insurance Facility, the African Risk Capacity, and the Pacific Catastrophe Risk Insurance Company. These pools have provided developing countries with numerous benefits including insurance pay-outs, tools to identify and manage disaster risks, and platforms to foster political dialogue on disaster risk management. Publications such as these lay the groundwork for environmental risk insurance in developing countries.
Similarly, publications target investor-related audiences seeking to understand the business impact of environmental risks. For example, the World Resources Institute published, in collaboration with the International Finance Corporation (mentioned above) a report 25 establishing operational, physical, regulatory, reputational, market-related and financing risks for publicly listed companies in emerging South and Southeast Asian countries. The strength of these publications is that they successfully establish the link between environmental risks and traditional financial analysis on corporate value and financial strength for companies.
INTERGOVERNMENTAL PANEL ON CLIMATE CHANGE
One of the Intergovernmental Panel on Climate
Change (IPCC)’s foundational aims is to assess climate vulnerability. Vulnerability, or the propensity to be adversely affected by climate events, encompasses a
24 See: https://wriorg.s3.amazonaws.com/s3fs-public/future-disaste r-risk-pooling-developing-countries.pdf [Last accessed 15 January 2020]. 25 See: https://wriorg.s3.amazonaws.com/s3fs-public/pdf/emerging _risks_emerging_asia.pdf [Last accessed 15 January 2020].
variety of elements including sensitivity or susceptibility to harm and lack of capacity of adaptation. The IPCC define risk as the probability of occurrence of a hazard multiplied by the consequence of the hazard, determined by the vulnerability of the exposed system.
The IPCC’s definition of vulnerability is characterised as a function of a system’s exposure and sensitivity to climatic stimuli and its capacity to adapt to their effects. This definition is contested as it corresponds to outcome (also known as end-point) vulnerability. However, it does not provide a clear definition of these attributes or the relationship between them.
The IPCC have four main indices to measure environmental risk 26 . Positively, they take into account not only the expected physical damage, victims and economic equivalent loss, but also social, organizational and institutional factors.
The Disaster Deficit Index measures the risk a country faces from a macroeconomic and financial perspective. It requires the estimation of critical impacts during a given period of exposure, as well as the country’s financial ability to cope with the situation. The Disaster Deficit Index utilises scientific predictions of extreme hazards and deductive indicators on their consequences.
The Local Disaster Index identifies the social and environmental risks resulting from more recurrent lower level events (which are often chronic at the local and subnational levels). These events have a disproportionate impact on more socially and economically vulnerable populations, and have highly damaging impacts on national
26 See: https://www.ipcc.ch/site/assets/uploads/2018/03/SREX-Chap 2_FINAL-1.pdf [Last accessed 15 January 2020].
development. The Local Disaster Index employs historical indicators of past events with different impact levels.
The Prevalent Vulnerability Index is comprised of a series of indicators that reflect social resilience, socioeconomic weaknesses and other conditions that affect vulnerability. The Prevalent Vulnerability Index aggregates quantitative and qualitative indicators.
The Risk Management Index combines indicators that measure a country’s risk management performance. These indicators reflect the organizational, development, capacity and institutional actions taken to reduce vulnerability and losses, to prepare for crisis and to recover efficiently from disasters. In the same way as the above indicator, this index also aggregates quantitative and qualitative indicators.
The benefit of such a system of indices is that it provides an approach to evaluation that is flexible and compatible with other evaluation methods, as these can be incorporated under the umbrella of the main index. Another strength is its ability to disaggregate results and thus identify factors that should take priority in risk management actions.
CONCLUSION
The need for a plethora of robust indicators of environmental risk becomes clear amidst the increasing variability of the climate. The aforementioned sources are an appropriate place to look towards. In an effort to adapt to the new requirements of this changing climate, they provide indicators that include a measurement of the linkages between and social risks, that are accessible for relevant actors in the field and establish the connection between environmental risks and traditional financial analysis.