MOVING TOGETHER:
A PEOPLE-FOCUSSED
PATHWAY TO FAIRER AND

GREENER TRANSPORT


Stephen Frost (IPPR), Maya Singer Hobbs (IPPR)
IPPR, the Institute for Public Policy Research, is an independent charity working towards a fairer, greener, and more prosperous society. The Fair Transition Unit (FTU) was established in June 2022 as a new landmark initiative to carry forward the work of IPPR’s cross-party Environmental Justice Commission and award-winning work on environmental breakdown.

This research is kindly supported by Calouste Gulbenkian Foundation, the Foundation for Integrated Transport, Gower Street, John Ellerman Foundation, Treebeard Trust and an independent family trust. The views are those of the authors only.


If you are using this document in your own writing, our preferred citation is: Frost S and Singer Hobbs M (2024), Moving together: A people-focussed pathway to fairer and greener transport. http://www.ippr.org/articles/moving-together
Permission to share This document is published under a creative commons licence: Attribution-NonCommercial-NoDerivs 2.0 UK http://creativecommons.org/licenses/bync-nd/2.0/uk/ For commercial use, please contact info@ippr.org


IPPR are committed to exploring what a fair transition to net zero transport looks like in Great Britain.
Within this report we present findings based on analysis of England’s National Travel Survey and the Scottish Household Survey (2013 to 2021), weighted to reflect transport behaviours of all adults in Great Britain (including Wales).
Data tables related to this analysis are available here: http://www.ippr.org/ articles/moving-together
At the heart of this new analysis are 12 profiles that describe the ways people travel now and the opportunities that exist for different groups on the path to net zero.
The unique starting point for this research are the recommendations of the communities that shaped IPPR’s crossparty Environmental Justice Commission. They told us that the UK’s approach to addressing the climate and nature crises has to have fairness as a foundation and that the costs and benefits must be equitably distributed across society.
• Summarises the key challenges facing decisionmakers in seeking to reduce greenhouse gas emissions from transport
• Presents analysis of the relationship between transport emissions and inequality
• Introduces a new model for understanding how people travel and the opportunities that different groups have to reduce emissions at pace
• Considers the implications of transport inequality on decarbonisation pathways and policy design.
The transport system reflects and contributes to wider inequalities in society. Income, gender, ethnicity, age and whether you have a disability all shape how you travel and the related transport emissions. Some people have effectively unlimited mobility, particularly those on the highest income – leading to an emissions footprint far in excess of all other groups.
The government’s current laissez–faire approach to decarbonising aviation is untenable for a fair transition to net zero. Emissions cannot be reduced in-line with the UK’s 2030 and 2035 legally-binding climate commitments without action to reduce the emissions associated with frequent flying. Not doing this puts the burden of the transition on the shoulders of those with the least responsibility for fuelling the climate crisis.
For decarbonisation of surface transport there are two simple answers – improve public transport and speed up the transition to electric vehicles. Public transport must be seamlessly integrated with shared mobility and high quality routes for walking, wheeling and cycling. Some people will need financial support to access electric vehicles but others will be able to easily replace their fossil-fuelled private cars using their own resources.
Acting to reduce emissions from transport can have huge benefits in addressing inequality and improving quality of life. Change can be hard and may be disruptive for some but the right approach will reduce transport poverty and support those currently facing the most significant barriers to accessing the things they need in life to do so more easily.
Half of the population are responsible for a tenth (11 per cent) of transport emissions.
The wealthiest 0.1 per cent of people in Great Britain emit at least 22 times more from transport than the lowest earners.
People with an income over £100k travel at least double the distance each year of those under £30k.
The findings in this report have many implications for those designing net zero and transport policy, but this report is focussed on making just one recommendation.
All decarbonisation pathways must be designed with people, and the principles of a just and fair transition, as their starting point. The path to net zero has to be about the real-world impact that change will have in people’s lives and communities.


There is a rapidly closing window of opportunity to secure a liveable and sustainable future for all
Intergovernmental Panel on Climate Change (2023)
→ Globally, we are not on track to keep warming below 1.5°C and have not made the required commitments to keep warming below 2°C.
→ Successfully limiting warming to below 1. 5°C or 2°C requires rapid and deep emissions reductions this decade.
→ Fast and sustained emissions reductions will lesson the impacts of climate change on people and planet, and deliver many benefits for people’s health.
→ The immediate action required will be disruptive and this requires careful policy design to mitigate.
→ Priority must be given to equity, climate justice, social justice, inclusion and a just transition – these enable ambitious climate action.
→ Consumption can be reduced through behavioural and lifestyle changes in a way that delivers co-benefits for societal wellbeing – developed economies and individuals on higher incomes are best positioned to make these changes while maintaining quality of life.
The Intergovernmental Panel on Climate Change has described the need to reduce transport emissions, and outlined how this might be done. Despite this, the UK, amongst other developed countries, has missed the opportunity at successive global climate and nature conferences to spell out how they will deliver these reductions.
This is not just about emissions. As the Lancet has made clear, climate change is both the greatest global health threat facing the world in the 21st century and the greatest opportunity to redefine the social and environmental determinants of health.
FIG.1:
The UK has made limited progress in reducing emissions from transport over the past three decades and it is now the country’s largest emitting sector. The path to achieving the Climate Change Committee’s balanced pathway is not on track and achieving reductions in line with -1.5C requires urgent action.
Source: Authors’ analysis of DESNZ historical emissions, CCC 6th Carbon Budget and Zeke Hausfather’s reporting on the remaining carbon budget for a 50 per cent chance of staying within 1.5°C
Approaches to assessing emissions from transport vary. The standard method within national statistics is to count flights that originate in the UK, excluding return flights. The impacts from nonCO2 emissions from aviation are also discounted. As this analysis focusses on the emissions of people’s travel we have included both return flights and adjusted for the wider impacts of flying. This has a dramatic impact on the emissions footprint of some groups and gives a truer account of the disparities in emissions that exist between individuals, and how significant the contribution of aviation is to the UK’s carbon footprint.
Emissions from surface transport and aviation in UK national accounts (2019) and when adjusted for return flights and impacts of non-CO2 emission
Source: Authors’ analysis of DESNZ historical emissions for 2019, ONS data for UK residents travelling abroad versus foreign travellers visiting the UK, and the academic literature for the scale of non-CO2 impacts from aviation
Emissions from travel are not fairly shared across people living in Great Britain.
→ The half of the population who emit the least are responsible for just a tenth (11 per cent) of transport emissions.
→ The highest emitting 10 per cent of the population are responsible for four tenths (42 per cent) of all transport emissions.
→ Half of all transport emissions are emitted by less than a fifth (15 per cent) of the population.
FIG. 3: EMISSIONS FROM TRAVEL ARE UNFAIRLY SHARED IN GB TODAY
Share of transport emissions by population in Great Britain
Source: Authors’ analysis. See methodology section for data source.
There is huge disparity between the emissions from transport of the wealthiest and those on lowest incomes.
→ The highest earning 0.1 per cent of people in Great Britain emit at least 12 times more from transport than average and 22 times more than the lowest earners.
→ The top 1 per cent of earners emit more than seven times the average and thirteen times that of the lowest earners.
Transport emissions per person by income groups in Great Britain
Source: Authors’ analysis. See methodology section for data source.
FIG. 5: THE WEALTHIEST ARE THE MOST MOBILE IN GREAT BRITAIN
Distance travelled per person by income groups in Great Britain
People with an income over £100k travel at least double as far each year as those under £30k, and almost three times further than those under £10k
Source: Authors’ analysis. See methodology section for data source.
The citizens’ juries delivered by IPPR as part of the Environmental Justice Commission in late 2020 and early 2021 set out a clear path on how the public expect changes to transport to be made.
The analysis presented in this report directly responds to their call for action.
→ Support people to make good travel choices based on their need
→ Put addressing inequality at the centre of transport decision-making
→ Stop doing the things that make the environment worse
→ Recognise that there is not one answer to providing a cleaner transport system
→ Make changes affordable and share the costs fairly
→ Empower people and communities to shape their own areas
→ Stop thinking in silos
→ Recognise the urgency of the nature and climate crises
→ Those with the resources need to act first
→ Focus on the wider benefits of cleaner transport and value these properly in decision-making





• How are people currently travelling within Great Britain and what distance?
• Who is currently flying, and how often?
• Whose mobility is constrained by the design of the current transport system?
• What level of greenhouse gas emissions from transport are associated with different groups?
• What changes in travel behaviours could support faster emission reductions?
• What barriers may people face in making changes to their travel behaviours?
• Who has the resources to reduce emissions at pace?
• How could emissions reductions be fairly shared across Great Britain?
This analysis is based on England’s National Travel Survey and Scottish Household Survey data for the years 2013–2021. It has been weighted to be representative of the Welsh population but does not include Northern Ireland.
It should be noted that our analysis of travel behaviours will reflect the limitations of the data collection methods used in these national surveys. These will not have captured the travel behaviours of either the extremely wealthy or the very poorest in society. Although household surveys are among the most inclusive survey approaches, they exclude certain groups – such as those of no fixed abode or living in communal establishments and residential care homes. The divides between the most mobile and the least are therefore likely even greater than our modelling shows.
This data has been segmented based on travel behaviour by running the data through multiple clustering algorithms. From this we built up a picture of the travel and demographic factors which stand out as differentiating different mobility needs and experiences across the population of Great Britain.
Based on these findings we have defined 12 archetypes which represent the diversity of mobility and tell the story of transport emission inequality in Great Britain today.








This analysis demonstrates the huge differences in travel of people across Great Britain.
→ People matching Profile 1 travel up to 15 times as much as Profile 12 each year. That’s more than 80,000km of combined flying and surface travel compared to just under 5,500km.
→ People in Profiles 1 and 2 all fly more than five times a year, with many flying more than 10 times. Those two groups account for the vast majority of domestic flying. Profiles 6, 7, 9, 10 and 11 don’t fly at all.
FIG. 6: THE DISTANCE TRAVELLED BY EACH GROUP SHOWS BIG DIFFERENCES IN BOTH FLYING AND SURFACE TRANSPORT BEHAVIOURS
Share of transport emissions by population in Great Britain
Source: Authors’ analysis. See methodology section for data source.
Annual distance travelled per person by car in each transport profile plotted against the percentage of the group who live in rural areas
The distance travelled by private car varies across the profiles, often linked to the extent to which the group is made up of people living in rural areas.
→ All three of the groups that travel furthest by car (Profiles 1, 4 and 6) are more likely to include those living in the countryside.
→ Profile 6, the group that relies on cars more than any other, is over half (51 per cent) made up of rural dwellers.
Source: Authors’ analysis. See methodology section for data source.
Profile 1 and 2 have the largest personal transport emission footprint by some margin due to their frequent flying. Profile 1 contains 4 per cent of the population but they account for more annual emissions per year than profiles 3, 6, 7, 9, 10, 11 and 12 combined (58 per cent of the population).
FIG. 8: SOME GROUPS CONTRIBUTE A GREAT DEAL MORE TO THE COUNTRY’S EMISSIONS FOOTPRINT THAN OTHERS
Percentage of the GB adult population matching each profile and the proportion of total transport emissions from personal travel each group is responsible for
Source: Authors’ analysis. See methodology section for data source.
This table shows average income and age of the people within our profiles, alongside the proportion that share certain characteristics. The highest and lowest figures in each column have been highlighted. The wide variation between profiles shows how different people’s identity and social situation may affect their travel. For instance, Profile 12’s low mobility is linked to having a low income, being in less secure housing (renting), working in manual occupations (or not at all) and living in more deprived neighbourhoods.
12.CAR
The mix of transport behaviours and demographics makes clear who has the most opportunity for reducing their transport emissions, and who has the most responsibility to do so.
The question for many in Great Britain is less about emissions reductions and more about increasing mobility. They already have low emissions, but their access to transport is poor. Therefore, a just transition for transport for some groups (for example Profiles 11 and 12)could involve increasing how much they travel.
Profile 7 has limited need to make any changes to their behaviour over the next 10 years – they are domestically mobile without much use of a car and don’t fly.
By comparison, the highest emitting and wealthiest group (Profile 1) must make faster changes to their behaviour for the transition to net zero to be equitable and be seen to be fair.

Source: Authors’ analysis.



Qualitative assessment of the need and ability of different groups to go faster in reducing transport emissions.





The next UK government will face the same challenges as today’s. There are both near-term climate commitments to meet and the longer term path to net zero is far from clear.
This new analysis has been undertaken in the recognition that public support for net zero is contingent on policies being seen to be effective and fair. The only way to achieve net zero transport is by making equity and people the starting point of how decarbonisation pathways are designed. This approach should be used to engage and inspire the public in an honest conversation about how we get to a greener, fairer and healthier future. The Climate Change Committee and UK government can both do more to embed this within their modelling approaches.
There are many insights from this analysis that can be used to shape transport and climate policy. Amongst the key ones is that the need and opportunity for changing travel behaviours is not evenly distributed across society. The wealthiest and the most frequent flyers have the most urgent need to reduce their emissions. For some other groups the question is how investment in sustainable transport can best address their current lack of mobility, and the social exclusion this can imply.
Over the coming year we will consider what transport choices or policy initiatives may best support both emissions reductions or increased personal mobility for different groups. However, some conclusions on these are immediately clear.
Everyone would benefit from improved public transport, particularly when this is integrated with active travel and shared mobility schemes (such as electric car clubs). Providing more people the freedom to choose to travel in this way could make a significant difference to their emissions by 2030 and beyond.
Being able to access the things we need closer to home should go hand-inhand with making these mode choices more attractive. For five of our profiles, flying a lot or a little less would be the best option for rapid emission reductions. Some have the resources to make the move to electric vehicles immediately whereas others, particularly those on lower incomes in rural areas, may need support to make this shift.


Qualitative assessment of the key actions that each group could take to reduce emissions or sustainably increase their mobility within five years if the right transport policies are put in place.









Source: Authors’ analysis.
This analysis forms the first part of a longer term research programme focussed on the twin challenges of reducing the environmental impact of transport and tackling transport-related social exclusion.
Our goal is to design a decarbonisation pathway for personal travel that is grounded in people’s experience and is in-line with creating a more prosperous and equal society.
This report has demonstrated the link between wealth and transport emissions but this is not the only factor influencing travel behaviours or the only form of inequality linked to transport. As evidenced by the make-up of our different
transport profiles - geography, gender, ethnicity, age and disability all can impact access to transport options and shape travel needs. These factors also impact the extent people experience the wider harms caused by the current transport system – including road collisions, community severance and air or noise pollution.
Based on these initial findings, we will now engage members of the public from across Britain in a debate about our shared path to net zero. We will also work closely with the communities experiencing the worst impact of the current transport system and most frequently marginalised in transport decision making to shape policies that will better meet their needs.


Gender: 32 per cent female / 68 per cent male
Ethnicity: 93 per cent white / 7 per cent minority ethnic
Average age: 37
Likelihood of children: 47 per cent
Mobility: 2 per cent have a mobility issue
Average income: c.£73,200. A quarter (26 per cent) earn more than £100,000.
Education: 61 per cent have a degree or higher
Profession: 70 per cent have a managerial/ professional role. 77 per cent work full time.
Home ownership: 86 per cent own their house outright, or have a mortgage / 14 per cent rent. 43 per cent live in detached houses Car access: 100 per cent
→ Highest concentrations live in the South East (20 per cent), Scotland (19 per cent) and London (15 per cent)
→ 19 per cent live in rural areas and 81 per cent live in urban areas.
→ 36 per cent live in the least deprived neighbourhoods (by quintile), with 7 per cent in the most deprived.
→ 24,460 kgCO2e transport emissions per year, per person
→ 4 per cent of adult population of GB
→ 14 per cent of all personal transport emissions in GB
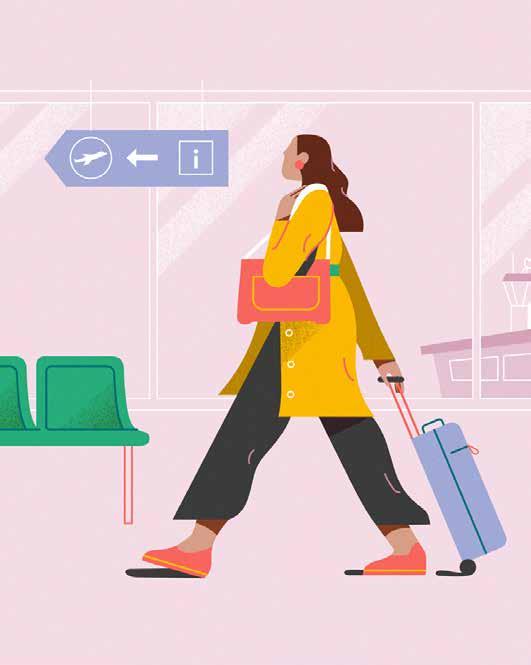
This group travels over 80,000 km a year. All fly more than five times a year, with 30 per cent flying more than 10 times.
This group travels furthest on the rail network and second furthest by car.
The most significant reduction in transport emissions would come from flying less per year.
This group has the resources to buy a battery electric vehicle and most could have made the transition from petrol or diesel cars by 2030.
Gender: 66 per cent female / 34 per cent male
Ethnicity: 92 per cent white / 8 per cent minority ethnic
Average age: 29
Likelihood of children: 16 per cent
Mobility: 3 per cent have a mobility issue.
Average income: c.£17,100. Three quarters (73 per cent) earn less than £30,000.
Education: 47 per cent have a degree or higher
Car ownership: 94 per cent have access to a car. PROFILE 2:
Profession: 52 per cent have a managerial / professional role. 43 per cent work full time.
Home ownership: 76 per cent own their house outright, or have a mortgage / 22 per cent rent. 32 per cent live in detached houses.
→ Highest concentrations live in Scotland (41 per cent), London (12 per cent) and the South East (10 per cent)
→ 15 per cent live in rural areas and 85 per cent live in urban areas.
→25 per cent live in the least deprived neighbourhoods (by quintile), with 12 per cent in the most deprived.
→ 18,755 kgCO2e transport emissions per year, per person
→ 2 per cent of adult population of GB
→ 9 per cent of all personal transport emissions in GB
This group travels over 57,000 km a year. All fly more than five times a year, with 22 per cent flying more than 10 times.
This group is the second least likely to travel actively and third least likely to travel by bus.
The most significant reduction in transport emissions would come from flying less per year.
Increasing bus use to more closely match those living in similar areas would reduce surface transport emissions.
→ Highest concentrations live in London (52 per cent), Scotland (14 per cent) and the South East (8 per cent)
→ 2 per cent live in rural areas and 98 per cent live in urban areas.
Likelihood of children: 27 per cent
Mobility: 4 per cent have a mobility issue.
Average income: c.£63,000. Over two thirds (35 per cent) earn more than £75,000.
Education: 59 per cent have a degree or higher
Profession: 44 per cent have a managerial/ professional role. 70 per cent work full time.
Home ownership: 31 per cent own their house outright, or have a mortgage / 67 per cent rent. 51 per cent live in a flat or maisonette.
Car ownership: 0 per cent have access to a car.
→ 30 per cent live in the most deprived neighbourhoods (by quintile), with 5 per cent in the least deprived.
→ 7,054 kgCO2e transport emissions per year, per person
→ 18 per cent of adult population of GB
→ 6 per cent of all personal transport emissions in GB
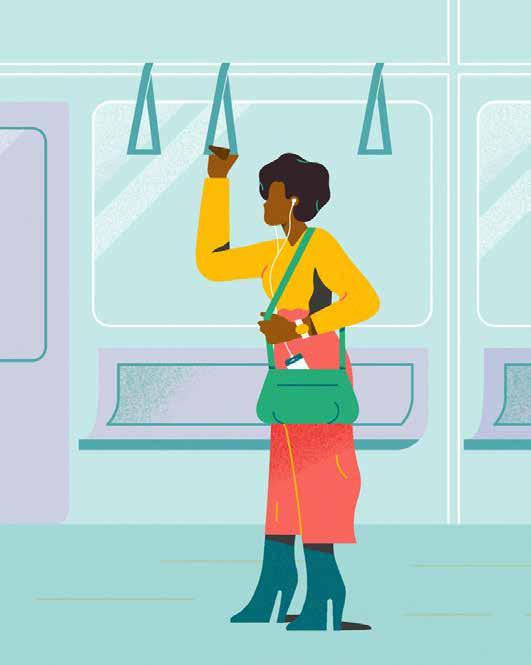
This group travels almost 25,300 km a year. A quarter (25 per cent) fly more than 5 times a year.
This group is the most likely to travel actively, the second most likely to travel by bus and second most likely to travel by rail or underground.
The most significant reduction in transport emissions would come from flying less per year.
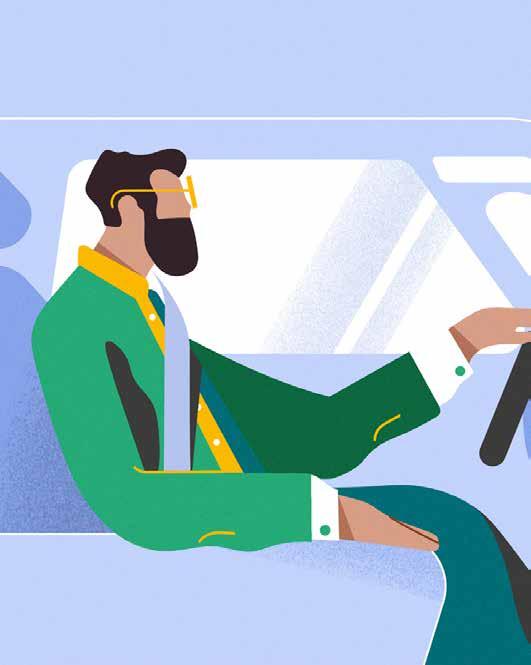
→ Highest concentrations live in South East (15 per cent), Scotland (12 per cent) and East of England (11 per cent)
Ethnicity: 94 per cent white / 6 per cent minority ethnic
Average age: 42
Likelihood of children: 40 per cent
Mobility: 3 per cent have a mobility issue.
Average income: c.£52,300. Four in 10 (39 per cent) earn more than £60,000.
Education: 40 per cent have a degree or higher
→ 26 per cent live in rural areas and 74 per cent live in urban areas.
→28 per cent live in the least deprived neighbourhoods (by quintile), with 9 per cent in the most deprived.
→ 6,610 kgCO2e transport emissions per year, per person
→ 9 per cent of adult population of GB
This group travels over 28,000 km a year. Three quarters (74 per cent) fly between two and five times a year.
Profession: 51 per cent have a managerial/ professional role. 61 per cent work full time.
Home ownership: 84 per cent own their house outright, or have a mortgage / 15 per cent rent. 37 per cent live in a detached house.
Car ownership: 100 per cent have access to a car. PROFILE 4:
→ 28 per cent of all personal transport emissions in GB
This group travels the third furthest by car and the third lowest by bus.
The most significant reduction in transport emissions would come from flying less per year.
Many within this group have the resources to buy a battery electric vehicle and could have made the transition from petrol or diesel cars by 2030.

Gender: 63 per cent female / 27 per cent male
Ethnicity: 82 per cent white / 18 per cent minority ethnic
Average age: 33
Likelihood of children: 28 per cent
Mobility: 1 per cent have a mobility issue.
Average income: c.£52,600. Four in 10 (41 per cent) earn more than £60,000.
Education: 42 per cent have a degree or higher
Profession: 42 per cent have a managerial/ professional role. 56 per cent work full time.
Home ownership: 74 per cent own their house outright, or have a mortgage / 24 per cent rent. 62 per cent live in a semidetached or terrace house.
Car ownership: 100 per cent have access to a car.
→ Highest concentrations live in London (17 per cent), the South East (14 per cent) and North West (11 per cent)
→ 0 per cent live in rural areas and 100 per cent live in urban areas.
→24 per cent live in the least deprived neighbourhoods (by quintile), with 14 per cent in the most deprived.
→ 5,926 kgCO2e transport emissions per year, per person
→ 5 per cent of adult population of GB
→ 8 per cent of all personal transport emissions in GB
The most significant reduction in transport emissions would come from flying less per year.
Many within this group have the resources to buy a battery electric vehicle and could have made the
This group travels over 24,100 km a year. Almost two thirds (63 per cent) fly between two and five times a year.
This group is travels the third furthest by car and the third lowest by bus.
transition from petrol or diesel cars by 2030. Given this group live in urban areas, improvements to public transport could support a reduction in car mileage.
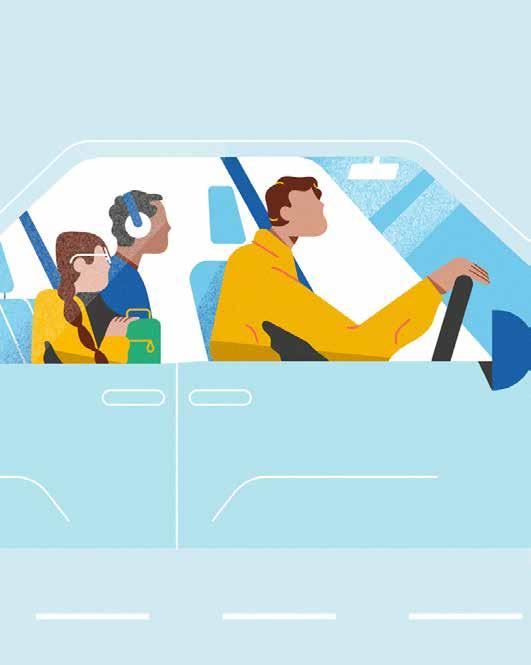
Gender: 23 per cent female / 77 per cent male
Ethnicity: 97 per cent white / 3 per cent minority ethnic
Average age: 43
Likelihood of children: 69 per cent
Mobility: 6 per cent have a mobility issue.
Average income: c.£50,700. Almost half (46%) earn between £30,000 and £60,000.
Education: 27 per cent have a degree or higher
Profession: 40 per cent have a managerial/ professional role. 69 per cent work full time.
Home ownership: 75 per cent own their house outright, or have a mortgage / 23 per cent rent. 61 per cent live in a semidetached or terrace house.
Car ownership: 100 per cent have access to a car.
→ Highest concentrations live in the South East (14 per cent), the South West (14 per cent) and East of England (12 per cent).
→ 51 per cent live in rural areas and 49 per cent live in urban areas.
→20 per cent live in the least deprived neighbourhoods (by quintile), with 10 per cent in the most deprived.
→ 1,848 kgCO2e transport emissions per year, per person
→ 13 per cent of adult population of GB
→ 4 per cent of all personal transport emissions in GB
This group travels almost 13,400 km a year.
This group travels the second furthest by car and the least by bus. They are also low users of trains or the underground. Travel by car accounts for 92 per cent of the distance they travel each year.
Some within this group have the resources to buy a battery electric vehicle and could have made the transition from petrol or diesel cars by 2030, others could be supported to access electric vehicles through car clubs or social leasing schemes. Improvements to public transport could support a reduction in car mileage.
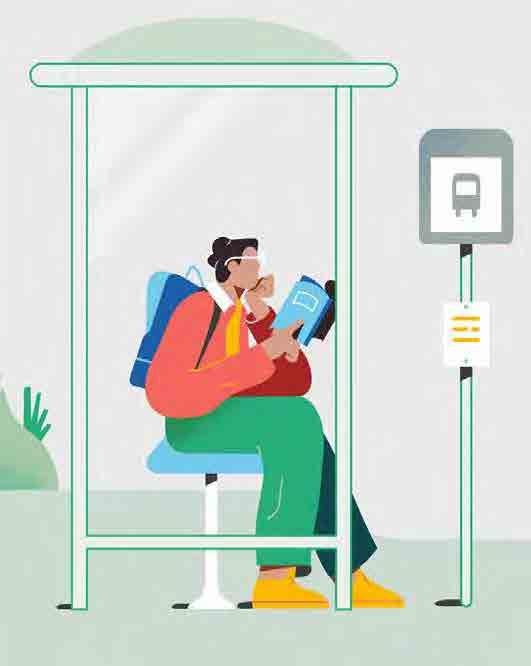
PROFILE 7:
Gender: 39 per cent female / 61 per cent male
Ethnicity: 68 per cent white / 32 per cent minority ethnic
Average age: 21
Likelihood of children: 54 per cent
Mobility: 0 per cent have a mobility issue.
Average income: c.£57,900. Almost half (47 per cent) earn over £60,000.
Education: 19 per cent have a degree or higher
Profession: 29 per cent are students. 43 per cent work full time.
Home ownership: 67 per cent own their house outright, or have a mortgage / 32 per cent rent. 75 per cent live in a semidetached or terrace house.
Car ownership: 100 per cent have access to a car.
→ Highest concentrations live in London (16 per cent), the South East (15 per cent) and West Midland (11 per cent).
→ 0 per cent live in rural areas and 100 per cent live in urban areas.
→ 26 per cent live in the most deprived neighbourhoods (by quintile), with 15 per cent in the least deprived.
→ 780 kgCO2e transport emissions per year, per person
→ 10 per cent of adult population of GB
→ 1 per cent of all personal transport emissions in GB
This group travels over 6,900 km a year.
This group travels the third lowest distance by car and the third highest by bus or active travel. They are also the fourth highest users of trains or the underground.
Investment in public transport and active travel will support this group to choose these for their daily travel even more frequently. Access to electric vehicles may best be supported through car clubs and other shared mobility schemes.
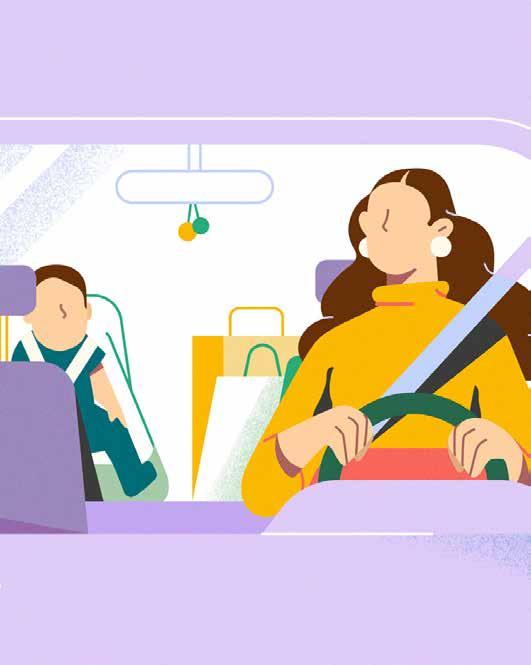
Average age: 45
Likelihood of children: 60 per cent
Mobility: 6 per cent have a mobility issue.
Average income: c.£45,400. Almost half (45 per cent) earn between £50,000.
Education: 30 per cent have a degree or higher
Profession: 36 per cent have a managerial/ professional role. 50 per cent work full time.
Home ownership: 77 per cent own their house outright, or have a mortgage / 22 per cent rent. 65 per cent live in a semidetached or terrace house.
Car ownership: 99 per cent have access to a car.
→ Highest concentrations live in the South East (16 per cent), North West (14 per cent) and London (13 per cent).
→ 8 per cent live in rural areas and 92 per cent live in urban areas.
→22 per cent live in the lest deprived neighbourhoods (by quintile), with 16 per cent in the least deprived.
→ 3,771 kgCO2e transport emissions per year, per person
→ 15 per cent of adult population of GB
→ 12 per cent of all personal transport emissions in GB
Some within this group have the resources to buy a battery electric vehicle and could have made the transition from petrol or diesel cars by 2030, others
This group travels over 18,300 km a year. All (100 per cent) fly just once a year.
This group travels the fourth furthest by car and are average users of public transport.
could be supported to access electric vehicles through car clubs or social leasing schemes.
Improvements to public transport could support a reduction in car mileage.

Likelihood of children: 72 per cent
Mobility: 3 per cent have a mobility issue.
Average income: c.£39,600. Half (51 per cent) earn between £20,000 and £50,000.
Education: 24 per cent have a degree or higher
→ Highest concentrations live in the South East (14 per cent), North West (12 per cent) and East Midlands (10 per cent).
→ 10 per cent live in rural areas and 90 per cent live in urban areas.
→21 per cent live in the most deprived neighbourhoods (by quintile), with 17 per cent in the least deprived.
→ 1,088 kgCO2e transport emissions per year, per person
→ 9 per cent of adult population of GB
Profession: 33 per cent have a routine / manual role. 44 per cent work full time.
Home ownership: 68 per cent own their house outright, or have a mortgage / 31 per cent rent. 70 per cent live in a semidetached or terrace house.
Car ownership: 97 per cent have access to a car. PROFILE 9:
→ 4 per cent of all personal transport emissions in GB
Access to electric vehicles may best be supported through car clubs and other shared mobility schemes.
Improvements to public transport could support a reduction in car mileage.

Likelihood of children: 8 per cent
Mobility: 0 per cent have a mobility issue.
Average income: c.£24,600. A third (34 per cent) earn between £10,000 and £19,999.
Education: 18 per cent have a degree or higher
Profession: 40 per cent have a routine / manual role. 61 per cent are economically inactive (for example, retired).
Home ownership: 82 per cent own their house outright, or have a mortgage / 17 per cent rent. 65 per cent live in a semidetached or terrace house.
Car ownership: 100 per cent have access to a car.
→ Highest concentrations live in the South East (15 per cent), North West (12 per cent) and East of England (11 per cent).
→ 1 per cent live in rural areas and 99 per cent live in urban areas.
→23 per cent live in the least deprived neighbourhoods (by quintile), with 14 per cent in the most deprived.
→ 1,080 kgCO2e transport emissions per year, per person
→ 2 per cent of adult population of GB
→ 2 per cent of all personal transport emissions in GB
Few within this group have the resources to buy a new car and access to battery electric vehicles may best be supported through social leasing or car club schemes.
Improvements to public transport could support a reduction in car mileage.

Likelihood of children: 24 per cent
Mobility: 100 per cent have a mobility issue.
Average income: c.£30,300. Over half (56 per cent) earn between £10,000 and £30,000.
Education: 14 per cent have a degree or higher
Profession: 79 per cent are economically inactive (for example, sick or disabled).
Home ownership: 54 per cent own their house outright, or have a mortgage / 31 per cent rent. 68 per cent live in a semidetached or terrace house.
Car ownership: 100 per cent have access to a car.
→ Highest concentrations live in the North West (14 per cent), South East (13 per cent) and East of England (12 per cent).
→ 3 per cent live in rural areas and 97 per cent live in urban areas.
→21 per cent live in the most deprived neighbourhoods (by quintile), with 18 per cent in the least deprived
→ 850 kgCO2e transport emissions per year, per person
→ 3 per cent of adult population of GB
→ 1 per cent of all personal transport emissions in GB
Few within this group have the resources to buy a new car and access to battery electric vehicles may best be supported through social leasing or Motability schemes.
Improvements to public transport and active travel infrastructure could support increases in mobility.
Gender: 59 per cent female / 41 per cent male
Ethnicity: 85 per cent white / 15 per cent minority ethnic
Average age: 43
Likelihood of children: 35 per cent
Mobility: 17 per cent have a mobility issue.
Average income: c.£13,600. Almost three quarters (72 per cent) earn between £0 and £20,000.
Education: 17 per cent have a degree or higher
Car ownership: 0 per cent have access to a car. PROFILE 12: CAR FREE, HIGH BUS, LOW INCOME
Profession: 49 per cent have a routine / manual role. 20 per cent work full time.
Home ownership: 30 per cent own their house outright, or have a mortgage / 68 per cent rent. 58 per cent live in a semidetached or terrace house.
→ Highest concentrations live in London (16 per cent), Scotland (15 per cent) and the North West (12 per cent).
→ 5 per cent live in rural areas and 95 per cent live in urban areas.
→40 per cent live in the most deprived neighbourhoods (by quintile), with 7 per cent in the least deprived.
→ 1,013 kgCO2e transport emissions per year, per person
→ 12 per cent of adult population of GB
→ 3 per cent of all personal transport emissions in GB
This group travels under 5,500 km a year. The majority make no flights (79 per cent). They travel the furthest by bus and fourth furthest by active travel. Over a third (38 per cent) of their travel each year is by public transport or active travel.
Improvements to public transport and active travel infrastructure will support increases in mobility. Few within this group have the resources to buy a new car and access to battery electric vehicles may best be supported through shared mobility and car club schemes.
The authors are grateful to colleagues at IPPR for their support with this report, particularly Luke Murphy and Becca Massey-Chase.
The authors appreciate the technical input of Richard Riley, Robert Pearce-Higgins and Laurence Peplow at ERM in support of this research.
We also appreciate the time spent by Greg Marsden reviewing this analysis and our conversation with Jillian Anable, Malcolm Morgan and Christian Bretter about our findings. Any errors in this work are those of the authors alone.
Our thanks also go to those who have helped with the design and publication of this report: Abi Hynes and Richard Maclean at IPPR, Jim Caunter for copyediting and the team at Flow, particularly Clare O’Mahoney and Josh Taylor, who have brought our ideas to life.
www.ippr.org
