
SPENDING AND STABILITY
HOW MUCH FISCAL SPACE DOES THE UK HAVE?
Carsten Jung and Carys Roberts
2022
November
ABOUT THE AUTHORS
Carsten Jung is a senior economist at IPPR. Carys Roberts is executive director at IPPR.
ACKNOWLEDGEMENTS
The authors would like to thank IPPR colleagues George Dibb, Shreya Nanda, Rosie Lockwood, Liam Evans, and Abi Hynes, as well as Jo Michell at UWE Bristol, for their contributions to this paper. We would also like to thank economists at the International Monetary Fund (IMF), the New Economics Foundation, Resolution Foundation and participants at a roundtable hosted by Das Progressive Zentrum Berlin for analytical and policy discussions that informed the research.
Download
This document is available to download as a free PDF and in other formats at: http://www.ippr.org/publications/spending and stability
Citation
If you are using this document in your own writing, our preferred citation is: Jung C and Roberts C (2022) Spending and stability: How much fiscal space does the UK have?, IPPR. http://www.ippr.org/publications/spending and stability
Permission to share
This document is published under a creative commons licence: Attribution-NonCommercial NoDerivs 2.0 UK http://creativecommons.org/licenses/by-nc-nd/2.0/uk/ For commercial use, please contact info@ippr.org

SUMMARY
After devastating turmoil in markets following the government’s mini budget, the key question for the government right now is what its fiscal policy stance should be. The new Chancellor, having reversed course on about two thirds of the tax cut plans announced in the mini budget, has said there will be spending cuts to come in the name of macroeconomic stability.
This briefing outlines the current macroeconomic situation and disentangles the binding constraints on fiscal policy in the short term and the medium term. Throughout, we point out some crucial uncertainties that surround policy making at this time of high macroeconomic risk
We challenge the notion that spending cuts are somehow inevitable for restoring macroeconomic stability. We set out an approach that would both stabilise the economy and ensure that public services are on a secure footing
We argue the following.
• In the short term, the binding constraint for fiscal policy is to avoid further fuelling inflation. Inflation risk will likely be an issue through at least 2023. To help contain inflation we argue that the Bank of England should continue to raise interest rates, but more slowly and by less than markets expect, to about 3 4 per cent. This would leave real rates (nominal rate minus inflation) slightly negative, as they were prior to the pandemic. But, any further tightening by the Bank should be highly responsive to new economic data. Given this monetary policy approach, we argue there is fiscal space for additional spending of between £90—120 billion (beyond a policy baseline of August 2022) within the inflation constraint.
• There is an urgent need for further support measures for households and businesses in 2023, including to maintain spending on public services in real terms, invest in warmer homes, support businesses, and protect households from the rising cost of living.
• Moreover, household and business support measures can help avoid inflation becoming embedded. That is because policies which help absorb the shock of high prices such as subsidised energy price caps can avoid businesses from having to increases their prices and workers from requiring wage increases. The government should thus provide bolder policies of this kind to avoid second round effects from inflation.
• To keep inflation risk in check while supporting households and businesses, taxes will need to play a bigger role, taking demand out of the economy. In our public spending scenario, the inflation constraint on fiscal policy could be exceeded in 2023. To limit additional inflation risk, tax revenues should be increased. We
3 IPPR | Spending and stability: How much fiscal space does the UK have?
estimate that about £40 billion in tax increases would be needed to stay within the constraint.
• Tax increases should be focused on the financial ‘winners’ from recent years including the pandemic – a time which saw huge windfall wealth gains at the top of the distribution. As well as fully reversing the mini budget cut to NICs (or implementing a similarly sized but more equitable tax rise on income), this could include equalising taxes on labour and investment income and increasing the windfall tax on energy producers. Taxes on capital and corporations are less likely to be disinflationary than income taxes, and therefore more revenue needs to be raised in order to achieve the same disinflationary effect.
• In the medium term, once inflation ebbs, the key constraint on public spending is the design of self imposed fiscal rules. Both the Conservative and the Labour parties have committed to the debt to GDP ratio falling. There are significant drawbacks to this kind of fiscal rule, including that it is insensitive to macroeconomic conditions.
• With regards to this rule, contrary to how this is reported in the media, there is no single number that tells us ‘how much can we borrow to stabilise the debt?’
Instead, we show that this depends on economic conditions and how the spending is used. In the decade preceding the pandemic, interest rates were so low that, counterintuitively, governments could borrow large sums, while still reducing their debt to GDP ratio. We illustrate this for the future through simulations.
• Assuming this self-imposed debt-to-GDP rule is in place, we estimate that in 2025, the government could run a primary deficit of £49 billion (2 per cent of GDP) and still have a stable debt burden. This is the case if, in the medium term, the macroeconomic environment returns to one similar to pre pandemic with similar interest rates and growth levels. If public spending is used in ways that increase growth (for example via public investment or increasing labour supply through childcare provision) even higher primary deficits can be compatible with stable debt. Under these scenarios the government would not have to cut spending from current projections in order to stabilise debt in the medium term. This contrasts with often cited numbers that state the UK needs to run a primary surplus which would involve tax increases or spending cuts We find that such numbers seem to assume what we would call a ‘downside scenario’ with regards to macroeconomic conditions, including for example zero per cent growth in the medium term.
• Finally, we argue that recent market turmoil was mostly caused by surpassing of the short-term inflation constraint, combined with the fact that policies announced did not credibly address key upcoming challenges caused by the cost of living crisis. The mini budget thus gave rise to higher inflation expectations and triggered large policy uncertainty. We do not think that the market reaction was mainly due to long term debt sustainability considerations.
4 IPPR | Spending and stability: How much fiscal space does the UK have?
1. INTRODUCTIONAfter devastating turmoil in markets following the government’s mini budget, the key question for the government right now is what its fiscal policy stance should be. The new Chancellor, having reversed course on most tax cut plans announced in the mini budget, has said there will be spending cuts to come in the name of macroeconomic stability.
In this briefing, we challenge the notion that spending cuts are somehow inevitable for restoring macroeconomic stability. We set out an approach that would both stabilise the economy but also ensure that public services are on a secure footing. To do so, we need to separate the short term and the long term constraints on fiscal policy.

In the short term, we are in the midst of an inflation emergency; public spending can both help ease the pressures inflation created, but it can also make inflation worse. Given the huge costs of prolonged high inflation, this constraint is of paramount importance so long as inflation is high. We discuss this constraint in chapter two of this paper.
Once inflationary pressures have eased, fiscal policy should be thought of as more constrained by standard questions around debt sustainability. We discuss this in chapter three.
There is huge uncertainty currently regarding the UK’s macroeconomic trajectory and underlying drivers at work. The global economic environment and macro policy responses are also rapidly changing. Our approach in this briefing is therefore to set out the debates on key relevant issues, including across countries, highlight uncertainties and provide our best assessment on the best direction for the UK to take.
5 IPPR | Spending and stability: How much fiscal space does the UK have?
THE INFLATION CONSTRAINT ON MACRO POLICY
MONETARY POLICY SHOULD TIGHTEN, BUT MORE SLOWLY
UK annual consumer price inflation was 10.1 per cent in September 2022 (ONS 2022). High inflation, and a concern that it will not come down to the target level of 2 per cent without strong policy action, has led to the argument that monetary policy should be tightened, with higher interest rates taking inflationary steam out of the economy.
There are broadly four reasons given.
Figure 1: The UK economy is thought to be above potential at the moment

OutputgapinG7countriesin2022,percentofGDP
Source: IMF (2022b)
Note: The output gap indicates where aggregate demand is, compared to the potential supply of the economy. Countries above potential could be so if there are, for example, labour shortages, meaning companies cannot produce as much as they would like.
• First, core inflation stripping out food and energy is significantly elevated across countries, but especially in the UK, which has the highest core inflation in
6 IPPR | Spending and stability: How much fiscal space does the UK have? 2.
the G7 (OECD 2022). Those arguing for continued tightening of monetary policy say that such high core inflation today will mean higher inflation expectations tomorrow. The US and the UK, moreover, have much tighter labour markets than the other G7 countries and economies thought to be above potential at the moment (along with Italy), while the other G7 countries are thought to be significantly below. The IMF and other forecasters therefore put both the US and the UK at higher inflation risk (IMF 2022).
• Second, with inflation high, real contemporaneous interest rates will still be negative into next year, meaning monetary policy can still be seen as relatively loose in aggregate. To illustrate this: negative real interest rates give an advantage to borrowers, as it means that they find it easier to repay their debts in ‘tomorrow’s prices’ because they borrowed in yesterday’s prices. It therefore still gives a strong incentive to borrow to invest.
Figure 2: Real interest rates are negative and will be going into 2023
Realinterestrates(nominalrateminusinflation),percent
Source: IMF (2022b)
• Third, building on standard macro models that are calibrated based on past inflation episodes, market expectations are that further interest rate increases are needed to quell inflation. Based on this, markets expect them to rise to about 3 6 per cent. 1 This is putting some pressure on central banks to act on this to safeguard their credibility.
• Fourth, in some past episodes in which inflation was high for long periods, higher inflation expectations became embedded and it was subsequently harder to bring
1 With the Eurozone’s rates expected to peak lower than those in the US and the UK.

7 IPPR | Spending and stability: How much fiscal space does the UK have?
them down (BIS 2022). It is thus, the argument goes, of paramount importance to ensure inflation does come back down as quickly as possible.
Taken alone, these could be seen as strong grounds to reduce demand somewhat in the economy (through either tightening monetary or fiscal policy), reducing demand for goods and services, and especially for non energy goods and services which are at the centre of concern. The ideal scenario envisioned by proponents of this approach is to do this by just the right amount, without causing a big economic downturn often referred to as a ‘soft landing’ scenario. The Bank for International Settlements (BIS) has conducted a study showing that there are indeed several instances where this has worked (Shin 2022). They found that a ‘soft landing’ tended to be achieved when GDP growth was strong, when central banks started raising rates early and the rise in inflation was moderate. All this suggests central banks should keep raising rates.
But there is also a risk of overdoing it. 'Taking demand out of the economy' through interest rate hikes means slowing the economy, which could lead to a recession and increased unemployment. Overly tightening would therefore risk economic hardship, likely to be concentrated in groups with worse labour market outcomes. Moreover, it might be the case that the UK is already nearing a point at which inflation will come down more or less back to target without much further tightening. There are broadly six arguments for this view
• First, given central banks across the world are all tightening at the same time (Obstfeld 2022), and (partly as a result) the world economy is slowing, the effects of monetary policy tightening are likely to be amplified. In other words, by not taking global factors into account sufficiently, policymakers might focus too much on their domestic economy and thus might be collectively over tightening.
• Second, medium term inflation expectations are only slightly elevated, and not enough to suggest a serious de anchoring of inflation from expectations. Relatedly, as the IMF has argued, the risk of a wage price spiral at the moment is limited (Bluedorn 2022).
• Third, contemporaneous real rates (Figure 2) are low, but more forward looking rates (with inflation likely lower) are significantly higher and could be positive in about two years’ time.
• Fourth, some indicators of imported inflation are starting to fall, including global shipping and oil prices. This could soon, with a lag, be reflected in lower headline inflation.
• Fifth, monetary policy works with a lag of a year or so (eg Gertler Karadi 2015). Hence contemporaneous (core) inflation is an imperfect indicator for judging when it is going to come down in the future.
• Sixth, there are significant financial stability risks from tightening too quickly. With economies still as or more leveraged than they were before the financial crisis this is a serious risk, as academic research shows (Schularick and Taylor 2012). We have already seen this risk materialise in some emerging economies. Tightening too
have?
8 IPPR | Spending and stability: How much fiscal space does the UK
quickly could cause financial turmoil and inflict more pain than a more cautious approach.
Given some price pressures seem to be plateauing, our assessment is that central banks including the Bank of England should start slowing the pace of tightening. As the world economy slows, a 'soft landing' scenario might already be in train. Central banks have already proven that they are willing to act swiftly and aggressively. But the next moves should be guided by careful assessment of incoming data. To support monetary tightening, the Bank of England should avoid conducting any large scale quantitative easing, unless financial stability is at risk.
A guide could be to bring real interest rates over time back to the levels they were at before the pandemic (about 1 per cent), when the UK was closer to potential. With inflation expected to average about 4 5 per cent over the next three years, this would mean nominal interest rates rising from 2.25 per cent to only about 3 4 per cent. This is about 1 3 percentage points lower than what markets currently expect. But increases should proceed slowly, and be highly responsive to new data on the economy (for example to what extent growth is affected). This implication appears to align with the most recent Bank of England thinking (Broadbent 2022).
Our view is that this approach would help bring down core inflation risks while avoiding risks of overtightening. Yet this crucially depends on how monetary policy interacts with fiscal policy. We discuss this in the remainder of this chapter.
THE IMF VIEW IS THAT THE GOVERNMENT DEFICIT SHOULD FALL BUT THIS SHOULD BE CHALLENGED
The IMF, and implicitly most central banks, argue that there is no room for a net fiscal expansion and that deficits should be reduced. At the same time, the Fund is projecting economies like the UK to have positive output gaps next year, meaning they will be operating below potential. The UK is projected to go from a slight overheating in 2022 to having slack in the economy in 2023. This prescription runs counter to standard counter cyclical fiscal policy approaches. But the IMF and others argue that unless steam is taken out of the economy inflation could become embedded and as a result end up being harder to bring down in the future.
Their argument rests on two assumptions:
• that inflation is ‘sticky’ and will not come down to target by itself, even if economies are not overheating and even if the main drivers of inflation are imported
• a positive output gap (ie slack in the economy) is needed for some time in order to get inflation back down to target. The economy needs to be deliberately weakened to bring inflation back down.
How much fiscal space does the UK have?
9 IPPR | Spending and stability:
Figure 3: All G7 countries except Italy are expected to have positive output gaps in coming years

OutputgapsinG7countries,percentofGDP
Source: IMF (2022b)
There is some evidence in support of this view. First, there is some research saying that once people face high inflation today they expect it to be high in the future too, with raised inflation expectations leading to higher actual inflation (BIS 2022). Second, the Fund argues that while median inflation expectations have not edged that much higher, the distribution has widened and there is now a (small) number of people that expect a very high inflation outcome (IMF 2022). Moreover, the fund also argues that in a context of high uncertainty around what the correct macro stance is, the risk of doing too little to fight inflation is higher than the risk of causing too much unemployment (IMF 2022).
The implication of this view is that governments should not act to push up demand to achieve zero output gaps and should instead reduce budget deficits. In some countries, this argument would imply deliberately not stepping in to avoid a recession. Most G7 countries are adhering to this IMF view, as figure 4 shows.
10 IPPR | Spending and stability: How much fiscal space does the UK have?
Source: IMF (2022b)
However, both underlying assumptions made by the IMF can be challenged.
First, it is not clear that this time around high inflation will be sticky. Median inflation expectations by households and businesses remain fairly anchored, and moderate monetary tightening, as suggested above, can keep them anchored In the UK, two year inflation expectations were at 3.2 per cent as of August 2022 (Bank of England 2022a; IMF 2022). And wages are not even close to keeping up with inflation, leading to large real pay cuts for most people. Both indicate that the ‘second round effects’ of inflation are, so far, weak. If it stays this way, and energy and imported goods prices stop rising, inflation more widely might fall again, by itself. Indeed, inflation can be expected to trend downwards given the huge fall in real wages.
Second, there are huge uncertainties around how much the economy needs to slow in order to reduce inflation (also referred to as the 'sacrifice ratio'). With monetary policy moving to its pre pandemic stance as suggested above, governments already having cut deficits significantly from the pandemic stimulus packages (figure 4) and the world economy slowing by almost one percentage point in 2023 (compared to expectations earlier in the year), 2 there is a real risk of reducing fiscal support too quickly. While some (such as Jason Furman) argue that, historically, slack in the economy has needed to rise by a lot to bring inflation down, others (such as Paul Krugman) say that this relationship has all but broken down and what matters much more is expectations, which remain anchored.
2 IMF (2022b)

11 IPPR | Spending and stability: How much fiscal space does the UK have? Figure 4:
Most
G7
countries are reducing deficits in line with the IMF view
AnnualchangeinbudgetdeficitofG7countries,percentagepointsofGDP
A middle view is that of the Bank of International Settlements (BIS 2022) that slack in the economy is needed if there is a risk of a transition from a ‘low inflation regime’ to a ‘high inflation regime’. The idea for this is that a large amount of slack of the economy is needed only if second round effects, including the behaviour of people and businesses changing, are present. In other words, if we can prevent these second round effects from taking hold in other ways, then creating slack in the economy might not be required. Below we argue for an underexplored mechanism for how this could be achieved.
Finally, a related argument, for example made by the IMF, is that risks from high inflation outweigh those of a recession. The typical argument is that (i) when inflation gets de anchored it is very hard and costly to get it back down, so it is better to ‘nip it in the bud’ early; and (ii) a greater number of people are affected by inflation than by a recession. However, a recession often hurts lower paid groups harder and can lead to labour market scarring. This has severe welfare implications as well as political consequences, and may disproportionately impact minority groups.
SUPPORT FOR HOUSEHOLDS AND BUSINESS CAN PREVENT SECOND ROUND EFFECTS AND EASE INFLATIONARY PRESSURES
Another argument challenging the IMF view of the need for reducing deficits to bring down inflation, is that fiscal policy, via household and business support measures, can actually reduce wage profit price spiral dynamics.
We can see this be examining this mechanism through which slack in the economy might work against inflation in the current situation. 3 Let’s call it the ‘slack mechanism’, argued for by the IMF and at the heart of macroeconomics textbooks. If a country experiences an imported inflation shock, in which one type of good (such as energy) is becoming more expensive, households and businesses are prompted to make up for the loss in real income or profit and bargain for higher wages or prices. This in turn causes other prices in the economy to go up too, then leading to second and third round effects.
The ‘slack mechanism’ posits that causing slack in the economy, through higher interest rates and fiscal tightening, effectively reduces demand for workers, goods and services and thereby lowers the power of workers to ask for higher wages and the pricing power of businesses to maintain profits. In other words, economic slack reduces everyone’s bargaining power, preventing both businesses and workers from making up for higher energy prices. That in turn means an energy price shock will not feed through as much to prices. Inflation then does not become embedded.
Of course, there are many problems with this mechanism even if it works to reduce inflation. First, slowing the economy causes significant hardship, especially for lower earners, as we alluded to above. Second, power between workers and businesses is very unequally distributed. This is showing in the current situation already. In both the US and the UK, in aggregate, real wages have not kept up with inflation while corporate profits have kept up (Hayes and Jung 2022). Causing further slack in the economy could hurt workers even further while businesses increase prices regardless.
3 This, in other words, refers to unpacking the Phillips Curve relationship.
12 IPPR | Spending and stability: How much fiscal space does the UK have?
We thus propose an alternative mechanism, which we call the ‘shock absorption mechanism’. The core idea is that if governments support households and businesses visibly and sufficiently in response to an energy shock (or indeed a price shock for other systemically important goods), they should have less need to increase their wages and prices to make up for the energy shock. The more we cushion the blow of high energy prices 4, the more likely we are to avoid high inflation becoming embedded.
There are various policies to achieve this but as we have argued in Jung et al (2022), ‘fiscal price caps’ are a good example. At the time of writing, the UK’s Energy Price Guarantee limits the price increases households and businesses face (at least until April 2023). By doing so, it lowers the pressure for second round effects. It has an important psychological effect of people not ‘seeing’ higher inflation in the way they would without the policy and it will therefore lessen the sense of sliding into a ‘high inflation regime’. Preventing this could be crucial. A flaw of the policy is that it is fully funded by borrowing; it could at least partly be funded by extending windfall taxes on corporations, including those beyond energy (Hayes and Jung 2022).
The fact that governments including the UK have to some extent put in place fiscal price caps, is likely to have already, at least partially, prevented second round effects. We argue, therefore, that redistributive policies can prevent the need for using the crude ‘slack mechanism’. However, both in terms of degree of compensation and in its design, improvements likely could have been made. 5
In sum, based on the arguments above, the inflation constraint can be fulfilled through the following policy approach:
• The government and the Bank of England should move towards a neutral macro policy stance, meaning fiscal and monetary policy should target a zero output gap. 6
• Government should support households and businesses through strong redistribution measures to reduce wage-profit-price-spiral dynamics.
What would this mean for fiscal policy in practice?
To answer this, we estimate the fiscal space available to government in 2023, when the inflation constraint will be crucial. We estimate that compared to a policy baseline of August 2022, there is room for supporting the economy with additional spending in the the
4 In the simplifying scenario where only energy prices are increasing.
5 Upcoming IPPR research will set out how UK government should adapt the design of the energy price cap.
6 As outlined above, we assume that for monetary policy, moving to the pre pandemic real rate constitutes neutrality.
13 IPPR | Spending and stability: How much fiscal space does the UK have?
TO STAY WITHIN THE INFLATION CONSTRAINT, MONETARY AND FISCAL POLICY SHOULD TARGET A ZERO OUTPUT GAP, WHILE SUPPORTING HOUSEHOLDS AND BUSINESSES
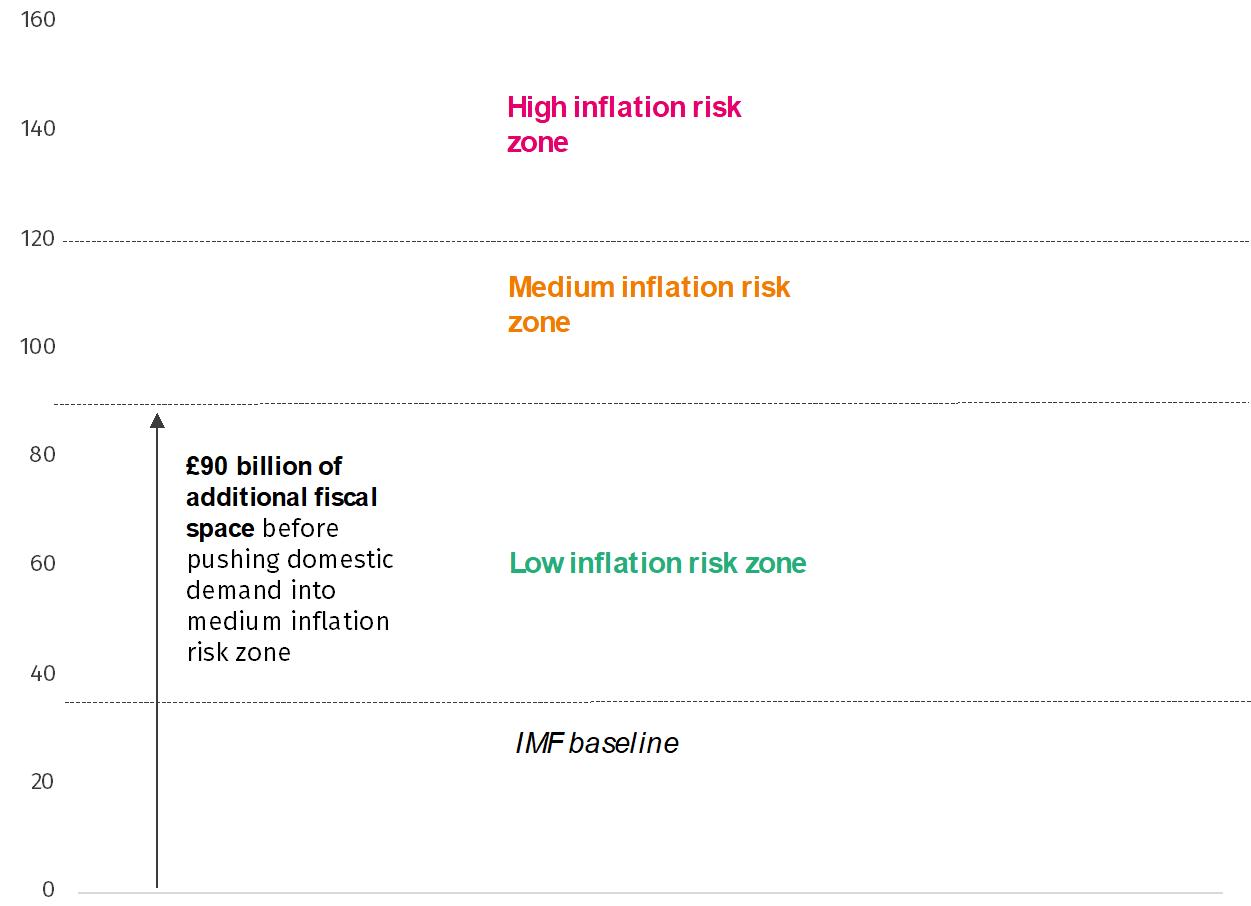
range of £90 120 billion. In calculating this, one of the main uncertainties is how much slack there is in the economy. 7 In figure 5, to reflect this uncertainty, we show different inflation risk zones. If slack is low (for example due to continued low labour force participation) there is less fiscal space. If there is more slack in the economy, there is more fiscal space. We calculate the range based on the IMF (less slack) and Bank of England (more slack) estimates of the output gap in the UK economy.
Figure 5: The short term constraint: the government has likely between £90 billion and £120 billion fiscal space in 2023
Source: IPPR analysis of IMF (2022b), Bank of England (2022b). Note: IMF baseline refers to the spending decisions made after May 2022 already incorporated in the UK borrowing projections. Specifically, the IMF accounts for £35 billion of energy support in 2023. ‘Low inflation risk zone’ is spending up to the output gap for 2023 projected by the IMF, assuming a multiplier of 0.5 for that spending ‘Medium inflation risk zone’ is spending between the output gap projected by the IMF and that projected by the Bank of England (adjusted for the IMF baseline to make it comparable), assuming a multiplier of 0.5 for that spending. ‘High inflation risk zone’ is everything above the Bank of England output gap.
There is also a risk of spending too little, given the potential for fiscal policy to actively reduce inflation through redistribution (discussed above), and the need for spending to meet broader economic and societal objectives. Indeed, there are many additional spending pressures facing a government looking to help households and businesses
7 See Sigl Glockner et al (2021) for a debate on the problems around this.
stability: How much fiscal space does the UK have?
14 IPPR | Spending and
through the cost of living crisis, shore up public services and invest in a more prosperous and cleaner future economy. In the current context, real terms reductions in spending on public services and welfare would be damaging to economy, politically challenging and likely counterproductive. Instead, both will require funding boosts to underpin a strong recovery. High energy prices only increase the need for investment in warmer homes, alongside schemes to help families and businesses to buy energy now.
In figure 6, we set out a scenario which includes the following assumptions for public spending.
• The energy price cap is maintained until end March 2023, as set out by the Chancellor on 17th October 2022.
• This is later replaced with an alternative scheme with somewhat reduced quarterly costing for the rest of 2023. 8
• Cost of living support similar to that passed in June 2022 is repeated for 2023.
• Public services receive funding in line with inflation to stay afloat.
• The government invests in energy efficiency retrofit in homes across the country.
• No spending cuts elsewhere.
The figure shows that in this scenario, domestic demand would be increased to a degree that runs a high risk of further fuelling UK inflation.
To stay within the inflation constraint, we therefore argue that taxes will need to play a bigger role, taking demand out of the economy. In the short term, this will be important to enable strong and socially just support measures, while keeping the economy at potential and avoiding high inflation risk. Cost of living support measures will likely have to continue well into 2023; meanwhile ageing and the climate and nature crisis put further pressures on government budgets.
We are not the first ones to suggest this. The IMF (2022a) in its assessment of the UK economy this year suggested “raising more revenue now” through tax increases in order to address “demand supply imbalances”. We agree.
As illustrated on the right hand side of figure 6, to stay within the inflation constraint while pursuing support policies, the government should raise about £40 billion Key will be identifying taxes that support wider goals such as efficiency, equity and behaviour change, while taking into account their important role in reducing inflation risk. 9
8 The reduced costing is due to lower energy prices and some savings due to changed targeting. There is significant uncertainty around the scale of support but also its cost, as future energy prices are uncertain 9 Even though the energy price guarantee adds to demand side inflation pressures, we argue that it is overall disinflationary (as detailed in Jung et al 2022). However, it can be more disinflationary if it is at least partly tax funded. Similar to other types of energy bill support for households, subsidised price caps do provide a demand stimulus and thus add to overall inflationary pressures
How much fiscal space does the UK have?
15 IPPR | Spending and stability:
Figure 6: The UK should raise taxes to maintain a neutral macroeconomic stance, containing inflation risk, while supporting businesses and households
UKfiscalspacewithregardstotheinflationconstraint,spendingandtaxscenario,£
Source: Energy price guarantee costing (for households and businesses) uses HMT (2022) estimates for 2022 23 interpolated to Q1 2023 only. The ‘energy price follow up support’ assumes £40 billion cost for Q2 2023 Q4 2023 stated in Bell et al (2022) and assumes that a mechanism is found that is akin to the tax claw back for high earners described in Corlett et al (2022) for Q2 Q4 2023, amounting to £7.1 billion over three quarters. For business support, the same ratio between Q1 and Q2 Q4 2023 costings is assumed. ‘Keeping public services afloat’ uses IFS (2022) estimates and assumes that the annualised cost in 2023 is the same size as the annualised cost in 2023 24. Additional cost of living support assumes a support package of the size passed in June 2022 will be necessary in 2023. ‘Retrofit’: Emden and Murphy (2022). NICs estimate is from HMT (2022).
Note: See figure 5 for sources and notes on low, median and high inflation risk zones. The multiplier of all spending decision is set as 0.5 which is significantly higher than the covid support spending (CJRS) multiplier. It is thus (with regards to the inflation constraint) more conservative as a given amount of spending is more inflationary than with a lower multiplier. Our estimate of required tax rises is based on the assumption that the multiplier of tax increases is the same as (eg on core inflation). This slightly weighs against the disinflationary effect they have on anchoring energy price expectations. Thus, well designed price caps are best (at least partly) tax funded.
16 IPPR | Spending and stability: How much fiscal space does the UK have?
billion,2023
those of the spending decisions. As we discuss in more detail below, this assumption needs to be relaxed depending on the tax decision made. (1) The NICs cut number in the chart also includes the stamp duty land tax cut which remains in place from the mini budget. However, it makes up only 8 per cent of the sum of remaining tax cuts and we thus don’t list it independently for presentational reasons.
In figure 6 we illustrate reinstating the higher NICs rates first announced under Johnson, as this is actively under discussion though alternatives such as increasing income tax instead would be more progressive and could be implemented instead. But this would still require about £23 billion in further fiscal consolidation through taxes.
In table 1 we outline some of these options for further tax increases. This could start with closing the gap between tax rates on income from working and investing, while reducing or ending exemptions and loopholes that bring down effective rates (Nanda and Parkes 2019). For example, reform of capital gains tax, dividend income tax, and national insurance contributions (NICs) could all support this objective. Broader and higher windfall taxes on energy companies profiting from high global energy prices is another option, including closing loopholes. We include in the table options for wealth tax reform, including replacing inheritance tax with a lifetime gifts tax. A wealth tax on net assets over £10m either annual or as one off has also been discussed as an effective way to raise revenue from those who have benefited from the pandemic, though IPPR has not yet assessed the merits of such an approach (Advani 2022; Bangham et al 2020).
What needs to be taken into account, as shown in the right hand column, is that compared to a NICs increase, the remaining taxes (which are mostly capital or corporation taxes) have lower multipliers. 10 This means that they are less disinflationary than income taxes, and thus more revenue needs to be raised in order to achieve the same disinflationary effect. Assuming about half the size of multipliers, implies about £46 billion in capital taxes would need to be raised to fill the remaining gap.
Table 1: Options for raising taxes that dampen inflation risk while also improving efficiency, equity and behaviour change
Annual revenue (£ billion)
multiplier (i.e. demand impact)
Restoring the NICs increase or similar income tax reform
rates on capital gains and income from work and removing the annual exempt amount
Extending national insurance contributions to all investment income and pension age
Though there is currently still limited literature on the exact size of specific capital tax multipliers see appendix of Jung and Nanda (2021).
17 IPPR | Spending and stability: How much fiscal space does the UK have?
Likely
17 High Equalising
[1] 17 Low
individuals [2] 12 Low medium 10
Equalising dividend rates and removing separate allowances [3]
Abolishing non dom tax status [4]
3.2
Low
Low
Share buybacks tax [5] 0.2
No current estimate
Replacing inheritance tax with a lifetime gifts tax [7]
Annual wealth tax on net assets over £10m [8]
Low
Low Extending the windfall tax on oil & gas companies [6]
Low
Low
Sources: [1] Nanda (2019a) [2] Advani et al (2021) Excludes pension income. [3] Evans, Hayes and Dibb (2022); Nanda (2019b) [4] Advani et al (2022) [5] Evans, Hayes and Dibb (2022) [6] Krebel and Kumar (2022). Revenue estimates likely to be out of date and therefore not included here. [7] Roberts et al (2018) [8] Wealth Tax Commission (2022)
Note: As we argue in Jung and Nanda (2021) the multipliers for capital taxes such as capital gains tax (CGT) and windfall taxes could be about half of those of labour taxes, and potentially less. Capital taxes might thus have to rise more than comparable labour taxes to offset a given amount inflationary demand side pressures. Some revenue estimates are calculated for previous years, meaning estimates are likely to be conservative. We do not assess interactions between tax measures.
Countries around the world are indeed exploring tax options as part of their macro policy packages. For example, in the USA, the Inflation Reduction Act is seeking to address inflation by increasing corporation taxes and significantly improving enforcement. The European Commission is developing a joint approach to taxing windfall profits by energy companies. The UK’s recent decision to reduce taxes at a time when as above the opposite is required, is out of step with these approaches by other countries and, as we argue in the next chapter, has likely contributed to the market turmoil following the mini budget
space does
have?
18 IPPR | Spending and stability: How much fiscal
the UK
6
9
16
3. THE (SELF-IMPOSED) FISCAL RULE CONSTRAINT ON FISCAL POLICY
It is the stated goal of both the Conservative and Labour parties to reduce the debt-toGDP ratio, and there is much discussion about what it would take to stabilise or reduce this ratio over time. The rationale for using this indicator is that if debt to GDP is not growing, markets will have confidence in the UK’s ability to pay back its debt and thus offer favourable borrowing conditions. In the medium term, in which inflation is reduced, it is such self imposed fiscal rules, aimed at signalling a commitment to debt sustainability, that act as the primary constraint on fiscal policy.
There are good rules and bad rules. A debt-to-GDP rule (which both the Conservative and Labour party have chosen) has significant drawbacks. Most prominently is that it is insensitive to the state of the economy; it limits borrowing to invest when this could be growth enhancing and ultimately decrease debt in the long term even if it increases it in the long term. A better rule, for instance, might be a debt-interest-to-GDP rule (Furman and Summers 2020) or a net worth rule (Roberts and Jung 2020).
As we argue in the box below, the mini budget market turmoil was unlikely to have been caused by such long term concerns about the debt burden. Rather, it is likely it was the short-term inflation constraint, outlined above, that was biting. This is not to say that the debt level and the long term do not matter to investors. But it is more a credible overall fiscal framework and a strategy to deliver on it that are required here, rather than specific debt or deficit targets in the short term.
That said, given both major parties in the UK have committed to reducing net debt-toGDP, below we provide some calculations of how this target can be met, and debunk some common misconceptions around it.
BOX: WHAT CAUSED THE MINI BUDGET MARKET TURMOIL?
Following the ‘mini budget’, interest rates on UK government debt climbed by more than a percentage point. While interest rates rose globally (thanks to monetary tightening) the UK’s rose by 83 per cent more than those in the US, in the month up to 3 October.
19 IPPR | Spending and stability: How much fiscal space does the UK have?
Figure 7: Following the mini budget, the increase in UK borrowing costs was 94 per cent larger than that in the US over the period of the previous month
Basis point increase in 10-year government bond yields in the month to 12 Oct
Source: Bloomberg (2022)
Three key factors caused this:
- First, the size of fiscal loosening at a time of inflation risk, especially given multiple equilibria for inflation expectations. There was some fiscal space, as we showed above, but the measures seemed to be on course to violate the inflation constraint. So, markets expected higher inflation and higher rates.
- Second, the choices of how to use fiscal space. The tax cuts proposed were unlikely to address the actual problems in the economy; to boost growth as claimed or to support households through this period of high inflation, eroding confidence. Instead what was needed was a signal to boost public services. Moreover, announcing tax cuts made huge future swings in monetary and fiscal policy very likely (Wren Lewis 2022) and thus created significant policy uncertainty. This was compounded by the choice not to accompany the mini budget with OBR scrutiny. An important lesson from the mini budget is that both the size of fiscal space and whether it gets exceeded, as well as the how it is used, matter.
- Third, the large increase in gilts coming onto the market at a time when the Bank was selling them caused low liquidity and drops in prices, and this collided with insurers' hedging strategies.
These three factors are more important than the question of long term debt sustainability. The UK deficit would not have been larger than that of France in the medium term (figure 8). And none of the big three rating agencies, for instance, actually downgraded UK credit worthiness – they only changed the outlook. So, it was unlikely that

20 IPPR | Spending and stability: How much fiscal space does the UK have?
a huge increase in the default risk premium triggered the increase in rates and rather the three points mentioned above.
Government borrowing as per cent of GDP
Source: IPPR analysis of IMF (2022b), IFS (2022)
In discussions of debt to GDP ratios, economists often state a single deficit figure that will stabilise debt. However, in reality, the primary deficit figure that stabilises debt will depend hugely on two factors: (1) the macroeconomic environment and (2) how the borrowing is spent. As a result, and contrary to how this is often discussed in the media, there is there is no single number that tells us ‘how much can we borrow to stabilise the debt?’. We illustrate these dependencies with the illustrations shown in figure 9. See the annex for the equations on which this is based.

21 IPPR | Spending and stability: How much fiscal space does the UK have?
Figure 8: UK and French net government borrowing before and after mini budget announcements
Figure 9: The debt stabilising primary deficit depends hugely on underlying macroeconomic assumptions
Debtstabilisingprimarydeficit(£billionperyear,2025:positivevaluesindicateaprimary deficit,negativevaluesasurplus)
Source: IPPR analysis of IFS (2022), IMF (2020b).
Notes: See annex for derivation of underling formulas. The illustrations assume a starting condition of 85 per cent debt to GDP. The primary deficits shown are debt to GDP stabilising, so any deficit below would deliver falling debt to GDP. All estimates assume 2 per cent inflation in the medium term in line with IMF (2022b) forecasts. The IFS number is derived from their estimates for debt service payments, overall deficit and debt increases for 2025 26 in IFS (2022).
1. The broader macro environment determines what is needed to stabilise debt
First, the debt stabilising deficit depends on the macroeconomic situation: specifically, the difference between the overall interest rate paid on government debt (‘r’) and the (nominal) growth rate of the economy (‘g’). The faster the pie (that is, the economy) grows, the easier it is to lower the debt burden as a share of that pie. Such an environment makes it easier to lower the debt burden compared to the inverse (where r > g).
This is reflected by the y axis in figure 9. The faster the economy grows, the higher the deficit that the government can run while keeping debt to GDP stable. The figure shows that, with macroeconomic conditions similar to the years preceding the pandemic, which include 2 per cent growth, the deficit in 2025 could be £49 billion and still be stabilising
22 IPPR | Spending and stability: How much fiscal space does the UK have?
the debt. This contrasts with an IFS estimate of about minus £25 billion (meaning a surplus rather than deficit).
Next to growth, the other crucial factor influencing the debt stabilising primary deficit is the interest rate on all public debt. In the five years prior to the pandemic this was about 2 per cent. 11 The UK has a comparatively long maturity of its debt so it will take some time for this number to increase. If the number were to trend upwards to, say, 3 per cent this would lower the deficit that the government could run. In the scenario mentioned above this would mean the UK could run a £25 billion surplus and still stabilise the debt. This would still be £50 billion higher than the IFS estimate.
Those arguing the UK needs to run a primary surplus thus must be assuming an adverse macroeconomic scenario, shown on the left hand side of the chart. It would assume zero per cent trend growth and a full percentage point increase of interest on all public debt. While certainly not impossible, we think this should be seen as a downside scenario rather than a base case for the medium term.
2. How borrowing is spent determines what is needed to stabilise debt
Second, and crucially, it matters how the borrowing ‘is spent’. As we highlight above, GDP growth is crucial for showing how easy it is for the debt to GDP ratio to fall. If public borrowing is ‘spent’ on things that have a high chance of increasing GDP growth, such as public investment, then this will be much better for public finances than spending it on things that are unlikely to improve economic performance substantially (such as tax cuts). As highlighted in the box above, part of the problem with the recent mini budget was that its tax cutting measures were widely seen by markets and forecasters as unlikely to increase growth by much (IMF 2022b).
If, however, borrowing is used in a growth enhancing way, including through public investment in the net zero transition or by increasing labour supply, this can increase the deb stabilising deficit. In figure 9, if medium growth were to increase to 3 per cent, the debt stabilising primary deficit could be as high as £73 billion in 2025 (2.4 per cent of GDP). This would be almost £100 billion higher than the IFS estimate.
It is for this reason that public investment, in many fiscal frameworks, has a different status than other types of spending; it can enduringly increase sustainable growth and thereby improve public finances. It is thus crucial that fiscal rules do not prevent governments from borrowing to invest.
Finally, as this section has shown, the size of the debt stabilising deficit varies hugely depending on the macroeconomic environment and how spending is used. Any claims around debt stabilisation should be very explicit about what assumptions are made, so as not to imply certainty where it does not exist. Scenario analysis such as the approach presented here is more appropriate to illuminate these uncertainties.
11 This r g value is calculated for 2015 19, based on IMF (2022b).
stability: How much fiscal space does the UK have?
23 IPPR | Spending and
CONCLUSION
The turmoil following the ‘mini budget’ has prompted the return of calls for spending cuts. However, we think there is another, more sensible path for the long term health of the UK economy. We set out that there is indeed fiscal space available to the UK government and it can borrow more to support households and businesses in the cost of living crisis. But in the short term it needs to be mindful of the inflation constraint, and we therefore set out how tax rises can enable support at an adequate level.
We also argue that in the medium term, the government could run a substantial primary deficit, subject to a favourable macroeconomic environment and provided this is used to increase growth. Any fiscal framework should reflect these two crucial aspects and it should be avoided talking about single numbers that reduce the debt without making clear both what the assumed macro environment is and what the borrowing would be used for.
24 IPPR | Spending and stability: How much fiscal space does the UK have? 4.
REFERENCES
Advani A (2022) ‘Three ways Sunak could raise £10bn to help Britons struggling with energy bills’, Guardian. https://www.theguardian.com/money/2022/may/19/rishi-sunak-energy bills tax
Advani A, Burgherr D and Summers A (2022) Reforming the non dom regime: revenue estimates, CAGE Research Centre, University of Warwick.
https://warwick.ac.uk/fac/soc/economics/research/centres/cage/manage/publications/bn38.202 2.pdf
Advani A, Hughson H, Summers A and Tarrant H (2021) Fixing National Insurance: A better way to fund social care, CAGE Research Centre, University of Warwick. https://warwick.ac.uk/fac/soc/economics/research/centres/cage/manage/publications/bn33.202 1.pdf
Bangham G, Corlett A, Leslie J, Pacitti C, Smith J (2020) Unhealthy finances, Resolution Foundation. https://www.resolutionfoundation.org/publications/unhealthy-finances/
Bank of England (2022a) Bank of England/Ipsos Inflation Attitudes Survey - August 2022. https://www.bankofengland.co.uk/inflation-attitudes-survey/2022/august-2022
Bank of England (2022b) Monetary policy report – August 2022. https://www.bankofengland.co.uk/monetary-policy-report/2022/august-2022
Bank of International Settlements [BIS] (2022) BIS Annual Economic Report, BIS. https://www.bis.org/about/areport/areport2022.pdf
Bell T, Corlett A, Handscomb K, Marshall J and Smith J (2022) Cutting tax cuts: Jeremy Hunt rewrites Government’s economic policy, Resolution Foundation. https://www.resolutionfoundation.org/app/uploads/2022/10/Cutting-tax-cuts.pdf
Bloomberg (2022) ‘Rates and Bonds’, online database. https://www.bloomberg.com/markets/ratesbonds
Bluedorn J (2022) ‘Wage Price Spiral Risks Appear Contained Despite High Inflation’, blog post, IMF. https://www.imf.org/en/Blogs/Articles/2022/10/05/wage-price-spiral-risks-appear contained despite high-inflation
Broadbent B (2022) ‘The inflationary consequences of real shocks’, speech. https://www.bankofengland.co.uk/speech/2022/october/ben broadbent speech-at-imperialcollege the-inflationary-consequences of-real-shocks
Corlett A, Leslie J, Marshall J, Smith J (2022) A blank cheque, report, Resolution Foundation. https://www.resolutionfoundation.org/app/uploads/2022/09/A-blank cheque.pdf
Emden J and Murphy L (2022) ‘Plan for a retrofit revolution: how more than two million new jobs would boost levelling up and also tackle the energy crisis’, blog post, IPPR. https://www.ippr.org/news-and-media/press-releases/plan for-a-retrofit-revolution-how more than two-million-new jobs would boost levelling up and-also-tackle-energy-crisis
Evans J, Hayes C and Dibb G (2022) Buy back better: The case for raising taxes on dividends and buybacks, IPPR and Common Wealth. http://www.ippr.org/publications/buy-back better
25 IPPR | Spending and stability: How much fiscal space does the UK have?
Gertler M, Karadi P (2015) ‘Monetary Policy Surprises, Credit Costs, and Economic Activity’, American Economic Review. https://www.aeaweb.org/articles?id=10.1257/mac.20130329
Hayes C and Jung C (2022) Prices and profits after the pandemic, IPPR and Common Wealth. http://www.ippr.org/publications/prices-and-profits-after-the-pandemic
Her Majesty’s Treasury [HMT] (2022) The Growth Plan 2022, mini budget document. https://assets.publishing.service.gov.uk/government/uploads/system/uploads/attachment_data/f ile/1105985/HMT_Autumn_Statement_2022_PRINT.pdf
Institute for Fiscal Studies [IFS] (2022) Green Budget 2022 – Chapter 3 – The outlook for public finances, IFS. https://ifs.org.uk/sites/default/files/202210/Outlook%20for%20the%20public%20finances.pdf
International Monetary Fund [IMF] (2022) World Economic Outlook – October 2022, IMF. https://www.imf.org/en/Publications/WEO/Issues/2022/10/11/world-economic outlook october 2022
Jung C, Murphy L, Sandher J, and Sherzad M (2022) ‘Freezing the energy price cap could fight inflation and support households’, blog post, IPPR. https://www.ippr.org/blog/freezing the energy-price-cap-could-fight-inflation-and-support-households
Jung C and Nanda S (2021) Tax and recovery: Beyond the binary, IPPR. https://www.ippr.org/research/publications/tax-and recovery
Krebel L and Kumar C (2022) ‘Splitting the energy bill’, blog post, New Economics Foundation. https://neweconomics.org/2022/08/splitting-the energy bill
Schularick M and Taylor AM (2012) ‘Credit Booms Gone Bust: Monetary Policy, Leverage Cycles, and Financial Crises, 1870 2008’, American Economic Review, 102(2):1029–61. https://www.aeaweb.org/articles?id=10.1257/aer.102.2.1029
Mauro P and Zhou J (2020) ‘r g negative: Can we sleep more soundly?’, IMF working paper. https://www.imf.org/en/Publications/WP/Issues/2020/03/13/r-minus-g-negative-Can-We-Sleep More Soundly 49068
Nanda S (2019a) Reforming the taxation of income from wealth, IPPR. https://www.ippr.org/files/2019-11/capital-gains-tax-briefing.pdf
Nanda S (2019b) Reforming the taxation of dividends, IPPR. https://www.ippr.org/research/publications/reforming-the-taxation-of dividends
Nanda S and Parkes H (2019) Just tax: Reforming the taxation of income from wealth and work, IPPR. https://www.ippr.org/research/publications/just-tax
Obstfeld M (2022) Uncoordinated monetary policies risk a historic global slowdown, PIIE. https://www.piie.com/blogs/realtime-economic-issues-watch/uncoordinated-monetary-policies risk-historic-global slowdown
OECD (2022) Economic Outlook September 2022. https://www.oecd-ilibrary.org/sites/ae8c39ecen/index.html?itemId=/content/publication/ae8c39ec en&_csp_=975061244d5d905018ab2bd19cea8c9a&itemIGO=oecd&itemContentType=book
Office for National Statistics [ONS] (2022) ‘Consumer price inflation, UK: September 2022’, data release.
26 IPPR | Spending and stability: How much fiscal space does the UK have?
https://www.ons.gov.uk/economy/inflationandpriceindices/bulletins/consumerpriceinflation/sept ember2022
Roberts C, Blakeley G and Murphy L (2018) A Wealth of Difference: Reforming the taxation of wealth, IPPR. http://www.ippr.org/research/publications/a-wealth of-difference
Roberts C and Jung C (2020) The Chancellor’s Challenge: delivering a stimulus for post pandemic recovery, IPPR. https://www.ippr.org/research/publications/chancellors-challenge
Shin H S (2022) Inflation and the path to a soft landing, BIS. https://www.bis.org/speeches/sp220717.pdf
Sigl-Glockner (2021) ‘A new fiscal policy for Germany’, Dezernat Zukunft working paper https://www.dezernatzukunft.de/wp-content/uploads/2021/07/A new-fiscal-policy for Germany.pdf
Furman J and Summers L (2020) ‘A Reconsideration of Fiscal Policy in the Era of Low Interest Rates’, Brookings Working Paper. https://www.brookings.edu/wp-content/uploads/2020/11/furman summers-fiscal-reconsideration-discussion-draft.pdf
Wealth Tax Commission (2022) Wealth Tax Simulator. http://taxsimulator.ukwealth.tax/#/
Wren-Lewis S (2022) ‘Why it is crucial to understand why financial markets move, rather than worry about the role of markets in aiding the downfall of a Chancellor and Prime Minister’, blog post, Mainly Macro https://mainlymacro.blogspot.com/2022/10/why-it-is-crucial-to-understandwhy.html
27 IPPR | Spending and stability: How much fiscal space does the UK have?
ANNEX
We derived the debt stabilising primary deficit as follows: (1) ��������+1 ����������������+1 = �������� ∙ (1+ �������� ) ���������������� ∙ (1+ �������� ) + ��������+1 ����������������+1
Where:
• �������� is nominal debt in time t
• g is the growth rate
• r is the interest rate on government debt
• P is the nominal primary deficit
Imposing that debt is stable between periods, this can be reformulated to: (2) ��������∗ = �������� �1 1+ �������� 1+ �������� �
Where:
• ��������∗ the debt stabilising nominal primary deficit over ����������������
• �������� is nominal debt over ���������������� , stable across periods
Equation (2) shows that, crucially, the debt stabilising deficit depends on r and g as well as the existing debt-to-GDP level.
28 IPPR | Spending and stability: How much fiscal space does the UK have?