Volume: 10 Issue: 01 | Jan 2023 www.irjet.net


Volume: 10 Issue: 01 | Jan 2023 www.irjet.net
Abstract In comparison to other nations, India's government allocates only 1.5% of its annual GDP to public healthcare. On the other hand, over the past 20 years, worldwide public health spending has nearly doubled along with inflation, reaching US $8.5 trillion in 2019, or 9.8% of global GDP. Around 60% of comprehensive medical procedures and 70% of outpatient care are provided by multinational multiprivate sectors, who charge people exorbitant prices. Health insurance is becoming into a necessity for everyone due to the rising cost of high-quality healthcare, rising life expectancy, and the epidemiological shift toward non-communicable diseases. In the previous ten years, there has been a significant increase in insurance data, and carriers now have access to it. To improve outcomes, the health insurance system looks into predictive modelling.
Keywords Machine Learning, Regression Models, Ridge Regression, Linear Regression, Multiple Linear Regression and Polynomial Regression.
Weliveonaplanetthatisfullofdangersandambiguity. people,Families,businesses,realestate,andotherassets areexposedtovariousriskkinds.andtherearedifferent risk levels. These Risks of mortality, ill health, and propertylossareamongthedangers.
Themostimportantaspectsofpeople'slivesarelifeand wellbeing.
However, hazards may seldom be eliminated, therefore the realm of Finance has created a variety of protective products. Protecting people and organisations from these dangers. Financial resources to pay them back. Insuranceisaresult.
Policy that lowers or eliminates loss expenses that are paid by different dangers[1], regarding the importance of insurance in people's lives of people, it becomes crucial for the businesses of insurance to be accurate enough to quantify or assess the sum covered information. Instead of exposing the data itself, the nature of the data stored is disclosed. Gestures can be identified by examining photo metadata and content information. Feature extraction and classification are combinedinoneoperation.
Thecostofinsurancepremiumsdependsonanumberof factors. the result is Costs for insurance are continuous
quantities. The best is regression available options to meetourneeds. We employ manylinear Sincethereare numerous independent variables in this analysis, regression variables utilised in the target (dependent) variable's calculation. For The dataset for health insurancepremiumcostsisutilisedinthisstudy[2].
First, the dataset underwent preprocessing. next, we practicedevaluationofregressionmodelsusingtraining databasedontestingresultsforthesemodels.
Several research projects on calculating medical costs have been published in many health-related contexts. Many likely assumptions underlie machine learning, however, the performance of it depends on using a virtually accurate method. pertaining to the mentioned problem domain and using the acceptable methods to create,train,andusethemodel.
Moranandcoworkers"usedathoroughlinearthecostof an item using the regression method ICU using patient profile information and DRGs The amount of time spent in the groups (diagnosis-related) a hospital, and other characteristics."
The model Sushmita et al. "presented was based on Using a person's medical history and previous spending patterns, future medical expenses expected costs for eachquarter.
Machine learning (ML) algorithms for predicting health insurance premiums are continuously being researched and developed in the healthcare industry. A computational intelligence method for calculating healthcare insurance costs using a variety of machine learning approaches was proposed in the work of [2]. One piece [3] started out by considering the possible effects of employing predictive algorithms to determine insurance rates. Would this put the concept of risk mutualization in jeopardy, leading to new forms of bias and insurance exclusion? The second part of the study examined how the insured's realisation that the corporation had a wealth of continuously updated information about her actual behaviour affected their relationship.
Van den Broek-Altenburg and Atherly's study [4] aimed to ascertain consumers' opinions about medical insurance by monitoring their Twitter activity. The purpose was to use sentiment categorization to learn howindividualsfeelaboutdoctorsandhealthinsurance.
The authors used an Application Program Interface (API) to gather tweets on Twitter that contained the terms "health insurance" or "health plan" throughout the 2016–2017 healthcare insurance registration period in the United States. Insurance is a strategy that lowers or eliminates the expenses of losses brought on by various risks. The price of insurance is affected by a number of [5] factors. These factors have an effect on howinsurancepoliciesarecreated.
The statistical techniques known as regression procedures are used to determine the relationship between a target or dependent variable and a group of independentorpredictorvariables.
It is assumed that there is some sort of correlation betweenthetargetandpredictorvariablesandthatboth have numerical values. The models we're using to solve ourproblemaredetailedmorebelow.
A.ModelChoice:
Simple Linear Regression: In simple linear regression [16], the model develops a linear connection between thetargetvariable(Y)andasingleindependentvariable (X).
The dependent(y) and independent(X) variables are independent,andthelinearregressionmodel aimstofit theregressorlinebetweenthem.
Y=a+bXistheequationfortheline(1)
where "a" is the value of the Y intercept that the line makes when X is equal to zero and "b" is the slope that denotes the change in Y with the change in X. These model parameters are referred to as regression coefficients.Agreatervalueof"b"indicatesthat,inboth directions, a little change in X results in a substantial change in Y. The Ordinary Least Squares method can be usedtodeterminethevaluesof"a"and"b."
There will always be some discrepancy between the values predicted in linear regression models, therefore we add an error term to the original equation (1) to accountforthedifferenceandhelpinprediction.
Y=a+bX+(2)
• The sample size of data should be greater than the numberof
•Theregressioncanonlybevalidacrossaspecificsetof data,andtheerrortermisnormallydistributed.
• This also implies that the mean of the error has an expectedvalueofzero.
MultipleLinearRegression: Multipleregression[17]isa statistical method that assesses the strength of the relationshipbetweenanumberofindependentvariables andadependentvariable.
In basic linear regression, there is just one independent variable and one dependent variable; however, in multiple linear regression, there are many predictor variables, and the value of the dependent variable (Y) is now determined based on the values of the predictor variables. It is assumed that the predictor variables are independent of one another. Assume that the regressor fits the regression line in an N-dimensional space if the goal value depends on "n" independent variables. The regressorlineequationisnowwrittenasY=a+b1X1+ b2X2+b3X3+.....+bnXn+(3),where"a"representsthe value of the Y-intercept, "b1, "b2, "b3,..., "bn" > are the regression coefficients connected to the n independent variables,and"istheerrorterm."
Another unique kind of linear regression is polynomial regression,whichisdescribedin[18].Thegoal oflinear regression is to fit a straight line between the independent and dependent variables. In situations where there isn't a linear relationship between the goal and predictor variable, a curve is fitted against the two variables rather than a straight line. This is done by establishing a curvilinear link between the dependent and independent variables using a polynomial equation of degree n that is fitted to the non-linear data. The requirement that the independent variables be independent of one another is not necessary in polynomial regression. Thus, the line's equation becomesY=a+b1X1+b2X2+b3X3+...+bnXn
Applying polynomial regression has a number of advantages,includingthefollowing:
• Polynomial Regression provides the most accurate estimateof
• Higher degree polynomials typically offer a strong fit on the dataset in terms of the relationship between the dependentandindependentvariables.
• The main idea behind polynomial regression is to fit a varietyofcurvestothedataset.
Polynomialregressionhasthefollowingdrawbacks:
•Theseareoverlysensitivetothepresenceofoutliersin the dataset, as outliers increase the variance of the model.
• The model performs poorly when it encounters an unidentifiedpieceofdata.
For the purpose of creating the ML Health Insurance Prediction System, we collected our dataset from the Kaggle website [21]. (MLHIPS). The acquired data set consists of 1338 rows and seven properties or features, three of which have category values and the remaining four have numerical values. After that, the data set is splitinhalf.
Thefirstpartisknownastrainingdata,whilethesecond part is known as test data. The model will be more accuratewhenmakingpredictionsbasedonunobserved data the moredata thatisprovidedtothemodel during its training phase. When splitting data for testing and training,theaverageratiois80:20
Therewereblankvaluesincertainfieldsofthedataset.
Thedistributionswereexamined,anditwasdetermined to replace the Adding new characteristics to missing variables suggests that there are gaps in the data. [9]. This is only conceivable if the data is lost entirely at random, thus it is necessary to first design the missing datamechanism,whichchoosesthemostefficientwayto analyse the data. [10] [11]. Medical data have hidden linkages and multilevel structures [12]. It is crucial to uncover these underlying patterns using a variety of availablefundamentalanalysisapproachescombined.
This is the rationale behind the widespread usage of variousensembleMachineLearningmodelsinthestudy ofmedicaldata.
The subject of price prediction has also been addressed by researchers using hierarchical regression analysis. Manyof themhaveemployedvariousensemblelearning methodologies.
As can be seen in the table above, there are seven variables in the dataset. The values of the remaining six variables are taken into account while determining the cost of a customer's charges, which is our goal variable. The data is examined, correctly recreated, and properly incorporated into machine learning algorithms during thisphase.First,welookedforanymissingvaluesinthe dataset.

The bmi and charges columns in the dataset were discoveredtobeempty.
The mean values of the corresponding attribute values wereusedtoimputethemissingvalues.
The sex, smoker, and region columns in our example were categorical columns that were turned into numerical values using label encoding because regressionmodelsonlyacceptnumericaldata.
Additionally, severely skewed data in regression scenariosmayleadtoanunsatisfactorymodelfit.Andin this situation, severely skewed data can frequently be normalised using the log (natural logarithm) transformation.
Therefore,thelog transfer isemployed to normalisethe expensesofhealthinsurance.Additionally,thefollowing graphdisplaystheincreasedcostofhealthinsurance.
Histogram or density plot for the dependent variable (charges)showsthemedical insurancecosts distributed havebeenskewedtotheright.

The categorical variables are then converted to numeric or binary values that can either represent 0 or 1. For instance, the "Male" variable would be true (1) if the subject is a man instead of "SEX" with males or females. "Female"wouldalsobe(0)

The data can now be applied to all regression models usedinthisinvestigation,asshowninthetable.


Thefollowingmetricsareusedtogaugetheeffectiveness oftheregressionmodel.
R2 Score: R-Squared is a useful metric for assessing the model'sfitness.The rangeoftheR-squaredvalueis0to 1(0%to100%).Ahighervalueindicatesabetterfit.

SSE (Squared Sum of Error) is the sum of the squared residuals, which are the squared deviations of each observationfromthevaluepredicted.

SST (Sum of Squared Total): squared deviations between each observation and the mean value as a whole.
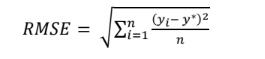
TheRootMeanSquareError,orRMSE,isafrequent a process for determining a model's prediction error, whichshowshowcloselytheobserveddatapointsare
Thepredictedvaluesdemonstratethemodel'sperfectfit to the observed data. Lower RMSE values suggest a bettermatch.
As can be seen from the calculations above, Polynomial Regression performs better than other models for the proposedMLHIPS,withanaccuracyof80.97%.
Incontrasttoothermodels, polynomial regressionfits a curve to the dataset, which raises the model's variance and lowers the residual error. When employing Polynomial Regression, the model produces better results, with an RMSE of 5100.53 and an R2 value of 0.80. Polynomial regression eventually yields superior results if the target and collection of predictor variables have a nonlinear connection. In addition, MLHIPS' PolynomialRegressionRidgeandLassoRegressionhave eachobtainedaccuracyvaluesof75.82%and75.86%.
The six independent factors have strong correlations with one another, which is why lasso regression and ridgeregressionyieldcomparablefindings.Theaccuracy of the MLHIPS multiple linear regression model is 75.66%. In contrast, simple linear regression had the lowest accuracy of all, at 62.86%. The dataset is divided in the aforementioned situation in an 80-20 ratio for trainingandtestingpurposes.
The accuracy of the polynomial regression falls from its prior value of 80.97% to 80.54% in the dataset of the 70:30 ratio, which is inconsequential. The accuracy valuesoftheothermodelshavesimilarlydecreased.
Additionally,itwasobservedthattheaccuracyincreased from the previous value of 80.97% to 83.62% when the degree of polynomial regression was changed from n=2 to n=3. though later on, raising the degree even further to 4 and greater values accuracy decreased for degrees n=4 and n=5, from 83.62% to 68.06% and 51.98%, respectively. Therefore, the polynomial regression gives us a decent level of accuracy in forecasting the charges withdegreen=3.
Forourproposedproblemstatement,wereviewedsome standard regression models in this study. Moving forward, however, certain new techniques, such as Support Vector Machine (SVM), XGBoost, Decision Tree (CART), Random Forest Classifier, and Stochastic Gradient Boosting, need to be addressed. On top of model evaluation, a variety of optimization methods, including the Genetic Algorithm and the Gradient DescentAlgorithm,maybeused.

Before training our model, we can also use certain feature selection strategies on our dataset to improve accuracy since some features could be missed when predictingcharges.
A properly balanced dataset with a higher number of observations is also necessary for a model to perform well. This will lower the variability of the model and enablethemodeltobetrainedeffectivelyinthefutureif moredatabecomeavailable.
Theoldmethodofcalculatinghealthinsurancecostsisa difficult undertaking for insurance firms. Human interaction in the process can occasionally result in flawed or inaccurate conclusions, and as the amount of
data grows, it takes longer for humans to calculate. The organisationcanbenefitgreatlyfromtheuseofmachine learning models in situations like these. In this study, a number of machine learning regression models are employedtoforecastthepriceofhealthinsuranceusing data from the dataset's unique attribute values. Table II provides a summary of the outcomes. Polynomial Regression is the most effective, with an accuracy of 80.97%,anR2of0.80,andanRMSEof5100.53.
For insurance companies, using the outdated way of figuring health insurance prices is a challenging task. As the amount of data increases, human computation becomesmoretime-consumingandoccasionallyleadsto erroneous or misleading results. Machine learning models can be used in instances like these to the organization's great advantage. This study uses data from the distinct attribute values of the dataset to anticipate thecostofhealthinsuranceusinga variety of machine learning regression models. The results are summarised in Table II. The most efficient model is polynomialregression,whichhasanaccuracyof80.97%, anR2of0.80,andanRMSEof5100.53.
1.Gupta,S.,&Tripathi,P.(2016,February).Anemerging trendofbigdataanalyticswithhealthinsuranceinIndia. In 2016 International Conference on Innovation and Challenges in Cyber Security (ICICCS-INBUSH) (pp. 6469).IEEE.
2. Kaggle Medical Cost Personal Datasets. Kaggle Inc. https://www.kaggle.com/mirichoi0218/insurance
3. Pesantez-Narvaez, J., Guillen, M., & Alcañiz, M. (2019). Predicting motor insurance claims using telematics data XGBoostversuslogisticregression.Risks,7(2),70
4. Singh, R., Ayyar, M. P., Pavan, T. S., Gosain, S., & Shah, R. R. (2019, September). Automating Car Insurance Claims Using Deep Learning Techniques. In 2019 IEEE Fifth International Conference on Multimedia Big Data (BigMM)(pp.199-207).IEEE.
5. Stucki, O. (2019). Predicting the customer churn with machine learning methods: case: private insurance customerdata
6.Chen,T.,&Guestrin,C.(2016).XGBoost:ascalabletree boosting system 22nd ACM SIGKDD Int. In Conf. on KnowledgeDiscoveryandDataMining.
7. Aler, R., Galván, I.M., Ruiz-Arias, J.A., Gueymard, C.A. (2017). Improving the separation of direct and diffuse solar radiation components using machine learning by gradientboosting.InSolarEnergyvol.150,pp.558-569.
8.Volkovs,M.,Yu,G.W.,&Poutanen,T.(2017).Contentbased neighbor models for cold start in recommender systems. In Proceedings of the Recommender Systems Challenge2017(pp.1-6).
9. Cunningham, Padraig, and Sarah Jane Delany. 2007. “K-Nearest Neighbour Classifiers.” Multiple Classifier Systems34(8).SpringerNewYork,NY,USA:1–17
10. Jiang, Shengyi, Guansong Pang, Meiling Wu, and Limin Kuang. 2012. “An Improved K-Nearest-Neighbor Algorithm for Text Categorization.”Expert Systems with Applications39(1).Elsevier:15039.
11. Mccord, Michael, and M Chuah. 2011. “Spam Detection on Twitter Using Traditional Classifiers.” In International Conference on Autonomic and Trusted Computing,175–86.Springer.
12. Breiman, L. (1996). Bagging predictors. Machine learning,24(2),123-140
13.Breiman,Leo,andothers.2001.“StatisticalModeling: The Two Cultures (with Comments and a Rejoinder by the Author).” Statistical Science 16 (3). Institute of MathematicalStatistics:199–231.
14 X.Zhu,C.Ying,J.Wang,J.Li,X.Laietal.,“Ensembleof ML-Knn for classification algorithm recommendation,” Knowledge-BasedSystems,vol.106,pp.933,2021.
15. G. Reddy, S. Bhattacharya, S. Ramakrishnan, C. L. Chowdhary,S.Hakaketal.,“Anensemble-basedmachine learningmodelfordiabeticretinopathyclassification,”in 2020 Int. Conf. on Emerging Trends in Information Technology and Engineering, IC-ETITE, VIT Vellore, IEEE,pp.1–6,2020.
16 Douglas C Montgomery, Elizabeth A Peck and G Geoffrey Vining, “Introduction to linear regression analysis”,JohnWiley&Sons,vol.821,2012.
17. Tian Jinyu, Zhao Xin et al., “Apply multiple linear regression model to predict the audit opinion,” in 2009 ISECS International Colloquium on Computing, Communication,Control,andManagement,IEEE,pp.1–6, 2009.
18 Ostertagova et al., ”Modelling using Polynomial Regression”, “Procedia Engineering”, vol. 48, pp. 500506,2012.
19. Donald W. Marquardt, Ronald D. Snee et al., ”Ridge Regression inPractice”, ”The American Statistician”, vol. 29,pp–3-20,2012.
20 V.Roth,“ThegeneralisedLASSO”,”IEEETransactions onNeuralNetworks”,vol.15,pp–1628,2004.