
International Research Journal of Engineering and Technology (IRJET) e-ISSN: 2395-0056
Volume: 11 Issue: 11| Nov 2024 www.irjet.net p-ISSN:2395-0072
SPATIAL AND TEMPORAL ANALYSIS OF HISTORICAL RAINFALL PATTERNS AND ITS CLIMATE CHANGE IMPACT ON PEECHI DAM CATCHMENT AREA.
Dr P Mahadevana, Shamna Abdullab , Akshay Sankar kc, Fathima Zulafa V Pc , Powel Thomasc , Sandhra P S c
a Professor and head of the Department, Civil Engineering, IES College of Engineering, b Assistant Professor, Civil Engineering, IES College of Engineering c UG student, Civil Engineering, IES College of Engineering, Chittilapilly, Thrissur, Kerala -680551, ***
Abstract - This comprehensive research project delves into the spatial and temporal analysis of historical rainfall patterns within the Peechi Dam catchment area, primarily focusing on assessing the impact of climate change. The study spans two pages and commences by establishing the significance of understanding historical rainfall dynamics in the context of water resource management and climate change adaptation.It meticulously outlines the methodology, incorporating advanced spatial and temporal analysis techniques, to discern patterns and trends in historical rainfall data. The research rigorously examines the spatial distribution of rainfall across the catchment area over an extended time frame, providing an in-depth exploration of how precipitation varies across different geographical regions. Simultaneously, the temporal analysis investigates trends and fluctuations in rainfall patterns over multiple decades, aiming to identify potential shifts attributable to climate change. A critical component of the study is the integration of climate change impact assessment. Utilizing sophisticated modeling and statistical tools, the research endeavors to quantify the influence of climate change on historical rainfall patterns. It scrutinizes whether observed variations align with established climate change projections, elucidating the potential implications for the region's water resources. The project also considers the broader environmental and socio-economic consequences of altered rainfall patterns, emphasizing the importance of developing adaptive strategies. The implications extend beyond mere hydrological changes, encompassing ecological shifts, agricultural impacts, and potential consequences for communities dependent on the Peechi Dam catchment area. In conclusion, this research not only contributes to the scientific understanding of historical rainfall dynamics and climate change impacts but also offers actionable insights for policymakers, water resource managers, and local communities. The comprehensive two-page exploration serves as a valuable resource for addressing the challenges posed by evolving precipitation patterns in the context of climate change and sustainable water resource management in the PeechiDamcatchmentarea.
Key Words: Spatial and temporal analysis, Modelling and statistical tools, Adaptive Strategies, Community resilience
1.INTRODUCTION
Thehydrologicalcycleisoneoftheimportantcomponents of the weather and climate system that is significantly affected by the precipitation and evaporation processes. Understanding historical rainfall patterns provides a baseline for assessing climate change effects and identifyingprecipitationshifts,aidinginforecastingfuture climate scenarios. The study of historical rainfall patterns and their evolution over time is a critical aspect of understanding the impacts of climate change on hydrological systems. The Peechi Dam catchment area, a vital water resource in Kerala, India, has experienced significant changes in rainfall distribution, which have profound implications for water availability, agricultural productivity, and ecosystem sustainability. This project aims to conduct comprehensive spatial and temporal analysisofthehistorical rainfall data toassesstheimpact of climate change on the Peechi Dam catchment area and forecastfuturetrends.
TheMann-KendallTauTestisastatisticalmethodusedto detect trends in time series data. This method is particularly useful when the distribution of the data is unknown or abnormal. The test compares the ordering of datapointstodetermineifthereisaconsistentupwardor downward trend over time[20]. The test assumes that thereisnotrendinthedataasthenullhypothesis.Onthe other hand, the alternative hypothesis indicates either a positive or negative trend. One of the key advantages of this test is its resilience to missing data and abrupt changes. This is because of its non-parametric nature. In thiscase,thetestwillbeusedtoanalyzerainfallpatterns, providing insights into long-term trends that may be associated with climate change. Sen's Slope Estimator Test, also known as Theil-Sen Estimator, is a nonparametricmethodthatisusedtomeasurethemagnitude

International Research Journal of Engineering and Technology (IRJET) e-ISSN: 2395-0056
Volume: 11 Issue: 11| Nov 2024 www.irjet.net p-ISSN:2395-0072
ofa trend in a time series[7].This estimator isoftenused in conjunction with the Mann-Kendall Tau Test. Unlike parametric tests, which assume a specific data distribution, Sen's Slope Estimator is resistant to outliers and does not require data to follow any particular distribution. The estimator calculates the slope as the medianofallslopesbetweenpaireddatapoints,providing arobustmeasureoftrendmagnitude.Inthecontextofthe Peechi Dam catchment area, Sen's Slope Estimator will provide a reliable estimate of the rate at which rainfall patterns are changing, thus contributing to a more accurate prediction of future scenarios. The combination of these two tests will allow for a detailed analysis of historical rainfall data, providing insight into the changes in rainfall patterns over time and how they relate to indicatorsofclimatechange.
Trendanalysisisacriticalcomponentofclimaticresearch, providing insights into the historical and potential future states of various meteorological parameters. Our study, spanningfrom1983to2022,delvesdeepintotheclimatic elements that shape the environmental narrative of a specific region. By dissecting data into monthly, annual, and seasonal segments, we capture the intricate fluctuations of climate that define periods such as Summer, Winter, and Monsoon seasons. The parameters chosen for this analysis are not arbitrary; they are the linchpins of meteorological science. Minimum and Maximum Temperatures offer a window into the thermal behavior of the region, influencing phenomena from evaporation rates to the survival of local flora and fauna. RelativeHumiditymeasuresthesaturationofwatervapor in the air, a determinant of precipitation patterns and a key player in the water cycle. Wind Speed affects the dispersal of seeds, the erosion of soil, and the spread of weather systems. Lastly, Precipitation is the culmination of these factors, a tangible measure of the climate’s ebb and flow-renowned for its statistical prowess and graphical capabilities, to conduct the Mann-Kendall Tau testandSen’sSlopeEstimatorTest.
The positiveor negativevaluesofSen’sslope,denoted as Q,areparticularlytelling.ApositiveQindicatesanupward trend, a signal that a particular parameter, such as temperature or precipitation, is on the rise. Conversely, a negative Q suggests a decline, a warning that could have significant implications for water management, agriculture,andoverallecologicalbalance.
1.1Objective
Collecting historical rainfall data for the region ofinterest.
Selection of parameters for seasonal, annual, and monthly past rainfall patterns in trend analysis.
Analyze the trend using the Mann-Kendal tau testandSenslopetest
1.2Scopeofstudy
The study will focus on specific geographical regions to provide a detailed examination of historical rainfall patterns and future forecasting. These regions will be chosenbasedontheirecologicalsignificanceandpotential impact on local communities. The temporal scope encompasses a substantial period, allowing for a comprehensive analysis of historical rainfall data. This extended timeframe aims to capture long-term trends, cyclical variations, and potential shifts in precipitation patterns. The project will leverage a variety of reliable data sources, including meteorological stations, satellite imagery, and climate databases, to ensure a comprehensive and accurate representation of historical rainfallpatterns.
2. METHODOLOGY
2.1General
Theflowchartforthemethodologyisshownin Fig 1. The studyarea underconsiderationisPeechi,a regionlocated withintheThrissurForestDivisionoftheThrissurdistrict in the state of Kerala. Encompassing an expansive area of approximately 108 km², Peechi is characterized by its geographical coordinates,fallingbetweenlatitudes10°30’ and 10°40’ N and longitudes 76°15’ and 76°25’ E. [26]. A range of parameters that are essential for the analysis wereselected.Thechoicesweredrivenbythenecessityto encompass vital environmental elements that have a significant influence on our research area. These parametersincludeprecipitation,Minimumandmaximum temperatures, Relative humidity, and wind speed. The monthly parameters of the past 40 years of data from 1983to2023were.takenfromNASA'spower dataaccess viewerwebsite[32].
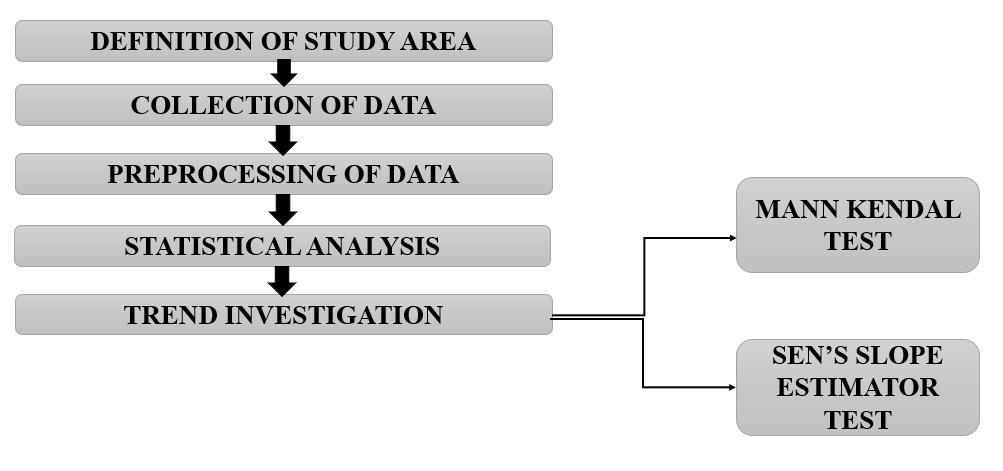
Fig1 MethodologyFlowchart
The data is then pre-processed which involves a series of steps to organize and clean the raw data before analysis. Initially, the collected rainfall data may contain inconsistencies, errors,ormissingvalues thatcouldaffect

International Research Journal of Engineering and Technology (IRJET) e-ISSN: 2395-0056
Volume: 11 Issue: 11| Nov 2024 www.irjet.net p-ISSN:2395-0072
the accuracy of subsequent analyses. The monthly data of each parameter is then categorized into 4 seasons. (1) Summer which starts from the month March to May, is alsoreferredtoasthepre-monsoonseason.(2)TheSouthsouthwest monsoon starts in June and ends with the month September.(3)Northeastmonsoon in Octoberand November.(4)WinterseasonfromDecembertoFebruary [20]. Also, the 12 months are grouped to determine the annual data. Therefore, analysis is done for monthly, seasonal,andannualdataforeachparameter.
2.2STATISTICAL ANALYSIS[7]
Statistical analysis involves evaluating data to identify patterns and trends. It helps remove bias and provides numerical insights. In this preliminary stage, we focus on eight key factors: minimum, maximum, mean, median, standard deviation, variance, skewness, and kurtosis. These factors are particularly relevant for analyzing hydrological parameters like precipitation, maximum temperature (Tmax), minimum temperature (Tmin), relative humidity (RH), and wind speed. The goal is to draw meaningful conclusions from raw data and facilitate decision-makingbasedonpasttrends.
2.3
TRENDANALYSIS[7][20]
Our study’s investigation into rainfall trends unfolds in three methodical stages. Initially, we apply Kendall’s Tau testtodetectanyconsistenttrendsinrainfall,servingasa dependablemethodforrevealinganypersistentincreases ordecreasesinthedata.Subsequently,inthesecondstage, we utilize Sen’s slope estimates to measure the extent of these rainfall trends, offering a precise gauge of the changesinprecipitationlevels.Thefinalstageisdedicated to the graphical depiction of the observed rainfall trends, encapsulating the data in a visual format. This step-bystep approach ensures a comprehensive and detailed examinationoftherainfallpatternsthroughoutthestudy.
2.3.1
MANKENDAL -TAU TEST [7]
In our study, we utilized Kendall’s tau test, a nonparametric approach, to evaluate the presence of trends within a sequence of data points. The test assesses whether there is a statistically significant monotonic (consistently increasing or decreasing) trend. The test’s designfocusesonthesignsofdifferencesbetweenpairsof observations, rather than their actual magnitudes, which enhances its robustness against outliers. The resilience of Kendall’stautesttooutliersisakeyfeature,asitevaluates the sign differences between variables, not their precise values. The tau value that results from this test quantifies the strength of the association between two variables, X andY,reflectingtheextentoftheircorrelation.
In essence, it measures the degree to which variables X andYarerelatedintermsoftheirdirectionalmovements.
ThecalculationofKendall’stauvalueisasfollows:
Here, S is the sum of the sign differences from the MannKendall statistical principle, and n is the number of data points. (X1, X2, …, Xn) represent the data points, and (Xi, Xj) arethedatapointsattimes( i )and( j ).
The computation of S involves summing up the sign differencesbetweenallpairsofdatapoints:
Thesignfunctionisdefinedas:
A tau value of zero suggests no trend, while a non-zero tau value indicates a trend. A negative tau value implies a negative correlation, with Y tending to decrease, and a positive tau value indicates a positive correlation, with Y tendingtoincrease.
The Mann-Kendall Test is instrumental in discerning the existence of trends, signaling whether they are ascending or descending. However, it does not quantify the size of these trends. To complement this, Sen’s Slope estimates are used to measure the degree of the identified trends. Thus, while the Mann-Kendall Test reveals the trend’s direction, Sen’s Slope provides a quantification of how significant the trend is, whether it’s an increase or a decrease.
2.3.2 SEN’S SLOPE ESTIMATOR TEST [7]
Sen’s Slope Estimator Test is a robust statistical tool used to measure the rate of change in a dataset over time, complementing the directional trend information providedbyKendall’stautest.Thismethodisparticularly useful when the data exhibits a linear trend, as it accurately quantifies the rate at which the variable is increasingordecreasing.
Consideradatasetwithnobservations,denotedby X1, X2, ………Xn, let , represent the observations at times i andjrespectively,with(j>i).
Theindividual slope Ti between eachpairofobservations iscalculatedasfollows:
Where,

International Research Journal of Engineering and Technology (IRJET) e-ISSN: 2395-0056
Volume: 11 Issue: 11| Nov 2024 www.irjet.net p-ISSN:2395-0072
i =1to(n-1), j =2ton.
Iftherearenvaluesof Xj, theestimatesofslopewillbe, ( )
Sen’sSlopeEstimatoriscalculatedasthemedianofallthe individual slopes between data points in a dataset. The medianwasdeterminedas, { ( ) ( )
WhereQistheSen’sslope.
A positive value of Q suggests a rising trend, whereas negative Q values indicate a decreasing trend in the temporaldata.Qrepresentstheslopemagnitudeperyear.
Thelineartrendlineequationisthenexpressedas:
whereQistheSen’sSlope,Bistheintercept,andt istime. Theinterceptiscalculatedasthemedianofthedifferences between the observed values and the product of Sen’s Slopeandtime
Trend analysis was conducted using R software, a powerful tool for statistical computing and graphics. R’s extensive package ecosystem and data manipulation capabilitiesallowedforsophisticatedanalysisoftemporal data R’s programming environment is designed for data analysis, making it an ideal choice for handling the complexities of trend analysis. The use of R software ensuredahighlevelofaccuracyandreproducibilityinour trendanalysisprocess.
3. RESULTS AND DISCUSSIONS
3.1Statistical analysis
Theresultofthestatistical analysisforall theparameters fromtheyear1981to2022isprovidedinTable1.
Precipitation
Amongthemonths,Juneexhibitsthehighestmeanrainfall of458.18mm,whileJanuaryexperiencesthelowestmean rainfall at 13.34 mm. Additionally, June has the highest standard deviation (SD) of 145.71 mm, indicating greater variabilityinrainfallduringthatmonth.Thevariancealso follows a similar pattern, with June having the highest variance of 21231.06 mm² and January having the lowest varianceof714.05mm².Furthermore,Marchdisplays the highest positive skewness of 4.44, suggesting a rightskewed distribution with more extreme high rainfall
events. In terms of kurtosis, March exhibits the highest value of 24.08, signifying a heavy-tailed and peaked distribution. Conversely, the summer months have the lowest kurtosis of 1.25, implying a less heavy-tailed distribution compared to other months. Notably, both JanuaryandDecemberrecordaminimumrainfallof0mm, whileJuneboaststhemaximumrainfallof922.85mm
MinimumandMaximumTemperature
Among the months, May exhibits the highest standard deviation (SD) of 1.63, indicating high variability in maximumtemperaturesacrossdifferentyearswithinthat month. This suggests that the maximum temperatures in May vary significantly from year to year, possibly due to diverse weather patterns or climatic conditions. Conversely, August has the lowest standard deviation of 0.53, indicating relatively low variability in maximum temperatures across different years within that month. This implies that the maximum temperatures in August tend to be more consistent or stable from year to year compared to other months. Additionally, variance measures the spread of data points around the mean. Months with higher variance have more spread-out data points, indicating greater variability in maximum temperatures. Similar to the standard deviation, May also has the highest variance, reflecting its high variability in maximum temperatures. Conversely, August has the lowest variance, indicating more consistent maximum temperatures compared to other months. Whereas, October exhibits the highest standard deviation (SD) of 0.95, indicating significant variability in minimum temperatures across different years within that month. This suggests that the minimum temperatures in October vary considerably due to diverse weather patterns or climatic conditions. Conversely, August has the lowest standarddeviation(SD)of 0.39,implyingmoreconsistent or stable minimum temperatures from year to year. Additionally, variance measures the spread of data points around the mean. Similar to the standard deviation, October also has the highest variance, reflecting its high variability in minimum temperatures. Conversely, August has the lowest variance, indicating more consistent minimum temperatures compared to other months. Skewness measures the asymmetry of the distribution of data points. Positive skewness indicates a longer tail on therightsideofthedistribution,whilenegativeskewness indicates a longer tail on the left side. Kurtosis measures the “tailedness” of the distribution. Positive kurtosis indicates a sharp peak and heavy tails, while negative kurtosisindicatesaflatterpeakandlightertails.
Relativehumidity
June has the highest standard deviation of 1.955146, indicating high variability in relative humidity across different years within that month. This suggests that the relative humidity in June varies significantly from year to
© 2024, IRJET | Impact Factor value: 8.315 | ISO 9001:2008 Certified Journal | Page153

International Research Journal of Engineering and Technology (IRJET) e-ISSN: 2395-0056
Volume: 11 Issue: 11| Nov 2024 www.irjet.net
year, possibly due to changing weather patterns or environmentalconditions.Augusthastheloweststandard deviationof0.853942,indicatingrelativelylowvariability in relative humidity across different years within that month. This implies that the relative humidity in August tends to be more consistent or stable from year to year comparedtoothermonths.Variancemeasures thespread of data points around the mean. Months with higher variance have more spread-out data points, indicating greater variability in relative humidity. Similar to the standard deviation, June also has the highest variance, reflecting its high variability in relative humidity. August has the lowest variance, indicating more consistent relative humidity compared to other months. The values ofskewnessandkurtosis foreachmonth provideinsights intotheshapeandcharacteristicsoftherelativehumidity distributionforthatmonth.
Windspeed
p-ISSN:2395-0072
The month with the highest mean wind speed is June (5.676905), followed closely by July and August. These months typically experience higher values compared to others. The month with the lowest mean is March (3.114762), followed by February and November. Months with higher standard deviation and variance tend to have more variability in their data points, indicating greater fluctuations from the mean. In this dataset, June has the highest standard deviation and variance, suggesting more variability in the data, while December has relatively lower standard deviation and variance. Skewness measuresthesymmetryofthedistribution.Novemberhas the highest skewness (0.863565), indicating a rightskewed distribution. June has the lowest skewness (0.56149), indicating a left-skewed distribution. Kurtosis measures the tails of the distribution. November has the highest kurtosis (1.376597), indicating heavy tails. July hasthelowestkurtosis(-0.47951),indicatinglightertails. The month with the minimum wind speed is February (2.59), and the month with the maximum wind speed is June(6.98).
Table 1
StatisticalAnalysisResult


Volume: 11 Issue: 11| Nov 2024 www.irjet.net p-ISSN:2395-0072
3.2 Trendanalysis
Trendanalysisforprecipitation
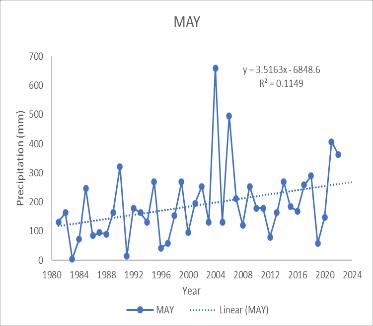
Annual, monthly, and seasonal precipitation trends from 1983 to 2022 were investigated individually. An increase in significant trends was observed annually with MK test valueof251andSen’sslopevalueof1.1614.Formonthly precipitation, a statistical increase in trend was observed forMay,September,andNovember.ForMayMKtestvalue shows 238 with Sen’s slope of 3.2018. September gives MK value of 172 with Sen’s slope of 2.9289. At the same time.NovembergivesanMKvalueof195withSen’sslope of 1.4381. Only the month of June showed a significant decreaseinthetrendwithMkvalue-238alongwithSen’s slope -4.5703. The seasonal analysis showed a positive trend for Northeast monsoon and Winter. For the Northeastmonsoon,theMKtestgivesSvalueof176with Sen’s slope Q value of 1.9586. Winter gives the value 259 withtheMk testand 1.6141forSen’sslope. Thetrend analysis indicates a significant increase in a certain parameter during May, September, November, the northeast monsoon season, and annually. Conversely, a decreasing trend is observed for June. This pattern suggests a seasonal variability with higher values during the northeast monsoon and winter months, which could be attributed to increased rainfall during these periods. For the Peechi Dam catchment area, these trends could haveseveralimplications.Thesignificant.increasesduring the monsoon and winter months could lead to higher water inflow into the dam, potentially improving water availabilityforirrigation,powergeneration,anddomestic use. However, it also raises concerns about the dam’s capacitytohandle potential flood eventsand the needfor effective water management strategies. The observed decrease in June, typically a monsoon month, is unusual and may indicate changes in climatic patterns or other environmentalfactors.Thiscouldaffectthewaterbalance in the catchment area, possibly leading to water scarcity issuesduringwhatistraditionallyareplenishmentperiod. Overall,theanalysissuggeststhatwhilethereisanoverall annual increase, the monthly variability, especially the decreaseinJune,couldposechallengesforwaterresource management in the Peechi Dam catchment area. It highlights the importance of continuous monitoring and adaptive management to mitigate potential risks associatedwiththesetrends.
Table 2 Analysisofprecipitation
(Note:N=Nosignificanttrend,+S=Significantincreasein trend, -S = significant decrease in trend, SW= southwest monsoon,NE=northeastmonsoon.)

International Research Journal of Engineering and Technology (IRJET) e-ISSN: 2395-0056
Volume: 11 Issue: 11| Nov 2024 www.irjet.net p-ISSN:2395-0072
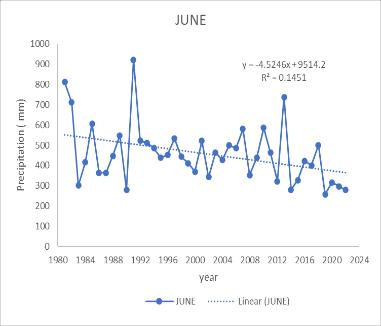
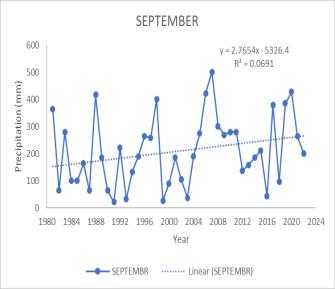
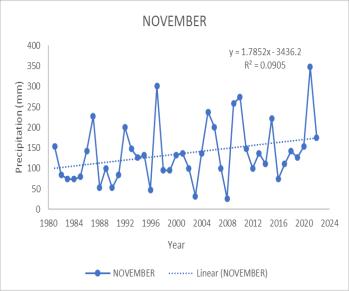
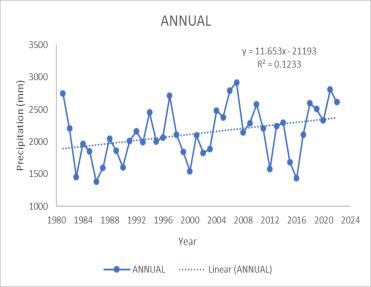
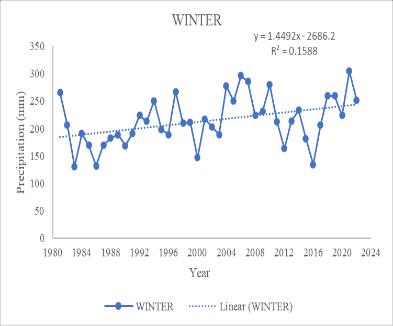
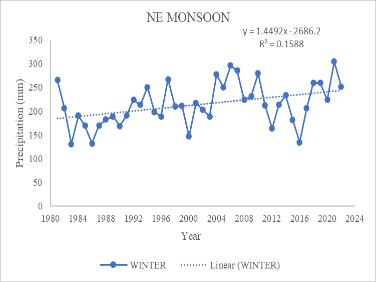
Fig 2 TimeseriesgraphofPrecipitationfor(a)May(b)
June (c) September (d)November (e)Annual (f) Northeast Monsoon(g)Winter
Trend Analysis for Minimum and Maximum Temperature
MK test value and Sen’s slope value for minimum and maximumtemperatureareshowninTable2
Table 2 Trend analysis for Tmax and Tmin
(Note:N=Nosignificanttrend,+S=Significantincreasein trend, -S = significant decrease in trend, SW= southwest monsoon,NE=northeastmonsoon.)
MK test value and Sen’s slope value for minimum and maximum temperature are shown in Table 4.2. Annual Tmin showed no significant trend in the analysis. A significant increase in trend is observed for June, July, August, and September. June gives MK value of 208 with Sen’s slope value of 0.0167. For July Mk test gives the value of 308 and Sen’s slope gives the value of 0.0208. August month also shows a positive trend with MK test valueof209andSen’sslopevalueof0.0150.Similarly,the month of September also shows an increasing trend with the Mk test value of 246 and Sen’s slope value of 0.0156. Seasonal analysis of the Tmin time series shows an increase in significant trend for Southwest monsoon with Mk test value 369 and Sen’s slope value 0.0190The trend analysis for maximum temperature (Tmax) in the Peechi catchmentarea indicatesthatthereisnosignificanttrend

International Research Journal of Engineering and Technology (IRJET) e-ISSN: 2395-0056
Volume: 11 Issue: 11| Nov 2024 www.irjet.net
annually However, there is a significant increasing trend during July, August, and September, as well as during the Southwest monsoon season. shows a positive trend with MKtestvalue282andSensslopevalue0.02727.Similarly, themonthofAugustalsogivesanMKtestvalueof363and a Sens slope value of 0.02467 September MK test gives a value of 345 and Sen’s slope gives a value of 0.0333. seasonal analysis for maximum temperature shows a significant increase in trend only for southwest monsoon withMktestvalue273andSen’sslopevalue0.0227
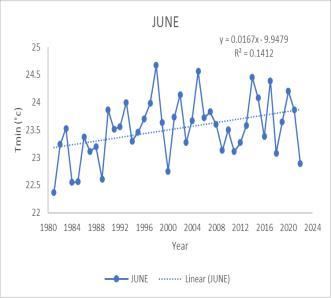
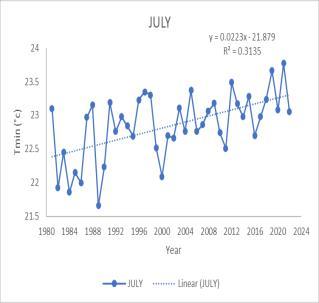
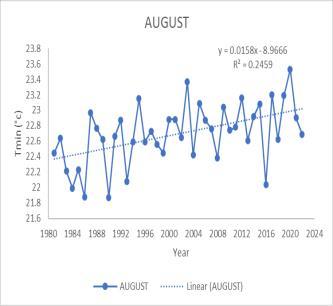
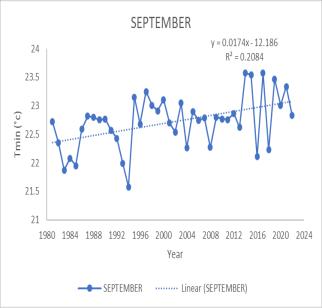
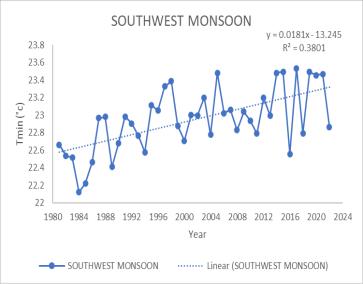
Fig 4 Timeseriesgraphof Maximumtemperature for (a) July (b) August (c) September (d)SouthwestMonsoon
Thesetemperaturetrendscansignificantlyimpactrainfall patterns and the catchment area. Higher minimum and maximum temperatures during the monsoon months can lead to increased evaporation rates, potentially intensifyingthehydrologicalcycle.Thiscanresultinmore pronounced rainfall The catchment area may experience
p-ISSN:2395-0072
changes in water storage, runoff patterns, and soil moisture levels. Additionally, the local ecosystem, including flora and fauna, may be affected by altered climaticconditions,potentiallyimpactingbiodiversityand agriculturalpractices.
TrendanalysisforRelativehumidity
The trend analysis for relative humidity in the catchment area shows a significant annual increase, highlighted by a Mann-Kendall (MK) test value of 246 and a Sen’s slope of 0.056. This upward trend is particularly pronounced duringMay,July,andDecember,andisalsoevidentduring thesummerseason.Specifically,MayexhibitsanMKvalue of249andaSen’sslopeof0.1572,indicatingthereismore moisture in the atmosphere, which can lead to a higher potential for rainfall. This could result in changes to the rainfall patterns, such as more frequent or intense precipitation events, particularly during the months and seasonsidentified.Forthecatchmentarea,
thiscouldmeanchangesinwaterstorageduetoincreased runoff, impacts on the local ecosystem, and potential challengesforwaterresourcemanagementsteepincrease. July and December also show significant increases, with MK values of 220 and 241its Sen slope suggest that relativehumidityisrising,especiallyduringthesemonths, whichcouldleadtomoremoistureintheatmosphereand potentially more rainfall. An increasing trend in relative humidity suggests that there is more moisture in the atmosphere, which can lead to a higher potential for rainfall. This could result in changes to the rainfall patterns, such as more frequent or intense precipitation events, particularly during the months and seasons identified. For the catchment area, this could mean changes inwaterstorageduetoincreasedrunoff,impacts onthelocalecosystem,and potentialchallengesforwater resourcemanagement.

International Research Journal of Engineering and Technology (IRJET) e-ISSN: 2395-0056
Volume: 11 Issue: 11| Nov 2024 www.irjet.net p-ISSN:2395-0072
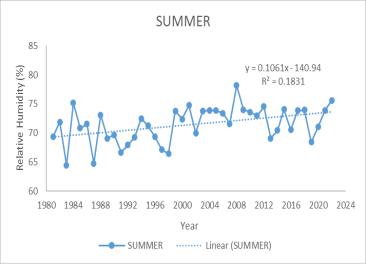
Table 3 Trendanalysisforrelativehumidity (b)July(c)December(d)Annual(e)Summer
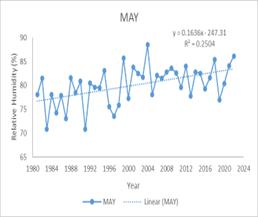
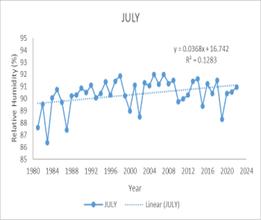
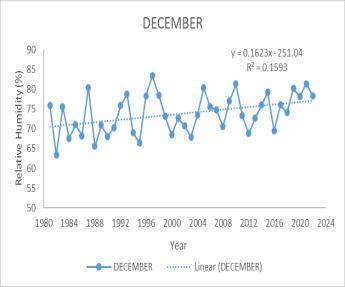
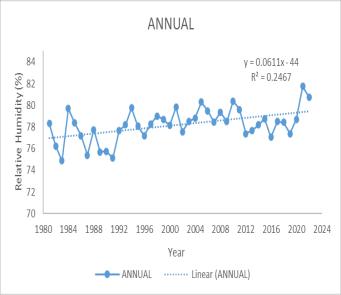
Fig 5 Time series graph of Relative Humidity for (a) May
Trendanalysisforwindspeed (e)
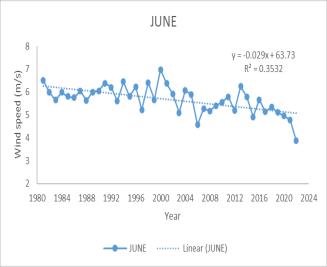
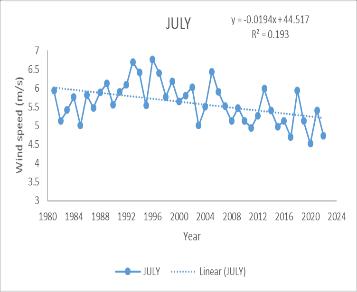
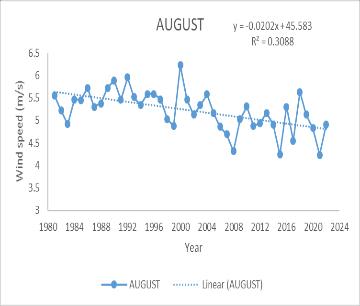
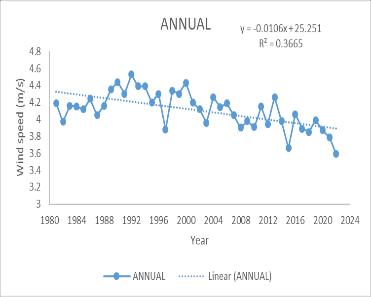
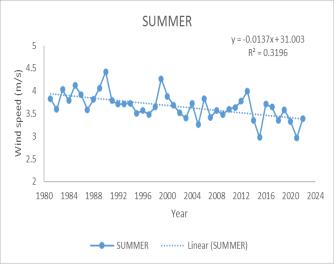
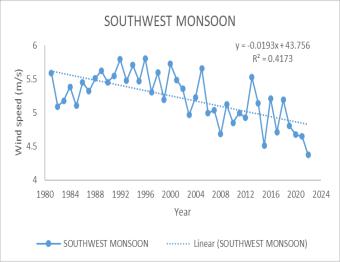
The trend analysis for wind speed from 1983 to 2022 revealsasignificantannualdecrease,withanMKtestvalue of -361 and a Sen’s slope of −0.0113. Monthly trends also show a decrease, particularly from March to August, with the most notable declines in March (MK -309, Sen’s slope −0.0197), April (MK -291, Sen’s slope −0.0195), July (MK -351, Sen’s slope −0.02636), and August (MK -341, Sen’s slope −0.01929). Seasonally, the Southwest monsoon and summerseasonsexhibitadecreasingtrendinwindspeed.
A decrease in wind speed during the monsoon and summer seasons could have several implications for precipitation rates. Lower wind speeds may lead to reduced evaporation rates, potentially increasing relative humidity and the likelihood of precipitation. This could result in more consistent and possibly heavier rainfall duringthemonsoonseason,affectingthehydrologyofthe catchment area. For agriculture, changes in wind speed and subsequent rainfall could necessitate adjustments in irrigation practices and crop planning. Additionally, the local ecosystem could experience shifts in species distribution and behavior due to changes in water availabilityandclimateconditions.

International Research Journal of Engineering and Technology (IRJET) e-ISSN: 2395-0056
Volume: 11 Issue: 11| Nov 2024 www.irjet.net
Table 4 TrendanalysisforWindspeed
MKTESTVALUE
(Note:N=Nosignificanttrend,+S=Significantincreasein trend, -S = significant decrease in trend, SW= southwest monsoon,NE=northeastmonsoon.)
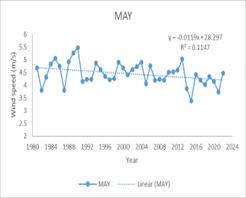
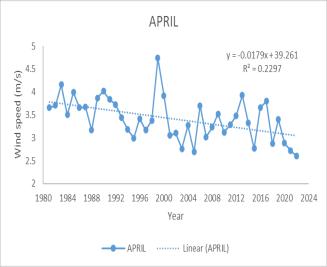
(c) June (d) July (e) August(f) Annual (g) Summer (h) Southwestmonsoon
4. CONCLUSIONS
Thestudyinvestigatedhistoricalrainfallpatternsandtheir climatechangeimpactinthePeechiDamarea.Keyfindings includeanincreaseinprecipitationduringspecificmonths, such as May, September, November, the northeast monsoon, winter, and annually. Conversely, June experienced a decreasing trend in precipitation. Temperature trends revealed rising minimum and maximum temperatures during June, July, August, September,andthesouthwestmonsoon.Relativehumidity showed an upward trajectory in May, July, December, and fortheannualaverageandsummer.Windspeedexhibited a declining pattern during March, April, May, June, July, August, the southwest monsoon, summer, and annually. These trends directly impact the Peechi Dam catchment area. Increased precipitation affects water availability, while rising temperatures and humidity levels impact ecosystems.Efficientreservoirmanagementstrategiesare crucial to mitigate evaporation losses. In summary, adaptive measures are essential to address dynamic climateshiftsinthePeechiDamarea.
5. REFERENCES
1. B. Anand & D. Karunanidhi “Long-termspatialand temporal rainfall trend analysis using GIS and statistical methods in Lower Bhavani basin, Tamil Nadu, India” Indian Journal of Geo-Marine Sciences, Vol. 49 (03), March 2020, pp. 419-427

International Research Journal of Engineering and Technology (IRJET) e-ISSN: 2395-0056
Volume: 11 Issue: 11| Nov 2024 www.irjet.net p-ISSN:2395-0072
2. Sanjeev Dwivedia, b, Manoj Kumar Thakurc, T V Lakshmi Kumard, B M Raoe, C M Kishtawale & M S Narayanand “An appraisal of rainfall estimation over India using remote sensing and in situ measurements” Indian Journal of Radio & Space Physics, Vol 50, December 2021, pp 167-177
3. Vandana. M Kabani “Morphometric analysis and watershed prioritization: a case study of Kabani River basin, Wayanad district, Kerala, India” Indian Journal of Geo-Marine Sciences Vol. 42(2), April 2013, pp. 211-222
4. K I Timothy· & S K Sarkar “Model for rainfall rate distributions over India” Indian Journal of Radio & Space Physics Vol. 27, April 1998, pp. 71-75.
5. M.V. Subrahmanyam & B. Pushpanjali “TheIndian Ocean moisture flux variations during the summer monsoonanditsrelationwithIndianrainfall” Indian Journal of Geo- Marine Sciences Vol. 48 (12), December 2019, pp. 1971-1977.
6. Rajesh Kumar, I M L Das, R M Gairola, A Sarkar, Vijay K Agarwal “Rainfall retrieval from TRMM radiometric channels using artificial neural networks” Indian Journal of Radio & Space Physics, Vol. 36, April 2007, pp. 114-127
7. P Mahadevan & S N Ramaswamy “Statistical studiesonplanningforwaterresourcemanagement onVaigaireservoircatchmentonVaigairiver,Tamil Nadu state, India” “ISSN: 2277-3878 (Online), Volume-8 Issue-2, July 2019”
8. Suraj Kumar, Thendiyath Roshni, Ashish Kumar, Drisya Jayakumar “GIS-Based Drought Assessment in Climate Change Context” A Case Study for Sone Command, Bihar”, “(March 2021)”
9. M. Manikandan D. Tamilmani “Spatial and TemporalVariationofMeteorologicalDroughtinthe Parambikulam-AliyarBasin,TamilNadu”, J. Inst. Eng. India Ser. A (July–September 2015) 96(3):177–184
10. Mahadevan Palanichamy, Ramaswamy Sankaralingam Narayanasamy “Prediction and Validation of Rainfall Classes for Vaigai River CatchmentusingEl Nino”,“ISSN: 2277-3878 (Online), Volume-8 Issue-2, July 2019”
11. B. Anand & D. Karunanidhi “Long-termspatialand temporal rainfall trend analysis using GIS and statistical methods in Lower Bhavani basin, Tamil Nadu, India” Indian Journal of Geo-Marine Science (Vol. 49 (03), March 2020, pp. 419-427)
12. Vimod K K & Kripa Mariya Thomas “ Extreme climaticeventsinChalakudy town,Thrissurdistrict , Kerala , International Research Journal of Engineering and Technology (Volume: 09 Issue: 10,oct 2022)
13. A A Kadir , M Kaamin , N S Azizan , S Sahit , S M Bukari , M Mokhtar , N Ngadiman and N B Hamid “ Application of Geographic Information Systems (GIS) Analaysing Rainfall Distribution Patterns in Batu Pahat District”,Soft Soil Engineering International Conference 2015 (SEIC2015)
14. Hongliang Xu ,Ying Zhang,Xiuzhen Zhu and Mingfeng Zheng “Effectsof rainfall-runoff pollution non eutrophication in coastal zone: a case study in shenzhen bay,southern china”, Hydrology Research 50.4, 2019
15. Mahadevan Palanichamy,Ramaswamy sankaralingam & Narayanaswamy “Statistical Studies on rainfall and time-based deviations in precipitate trends in vaigai river basin,TN state, india”,Indian Journal of Geo Maine Sciences Vol. 49 (01), january 2020, pp 15-23
16. walid Ben Khelifa & Manel Mosbahi “Modelingof rainfall-runoff process using HEC-HMS model for an urban ungauged watershed in Tunisia”, Modeling Earth Systems and Enviroment
17. S. Aruna Jyothy, D. Srinivasa Murthy & P.Mallikarjuna “Regional and Temporal variations of intensity-duration-frequency relationship: A case study”, J. Inst. India Ser. A (MARCH 20190 100(1):157165
18. Sunny Agarwal, Jyoti P Pattil, V.C.Goyal, Ajai Singh “Assessment of Water Supply-Demand using (WEAP) Model for Ur river watershed, Madhya Pradesh, India”, J. Inst. Eng. India Ser. A (MARCH 2019) 100(1):21-32
19. Malarvizhi R & Ravikumar G “Statistical research on rainfall and river discharge patterns over time from a hydrological perspective”, MalarvizhiRavikuma: statistical analysis on rainfall and river discharge trends-2019
20. P.C Joshi & B Simon “Use of NOAA temperaturesounding data in long-range forecasting of southwest monsoon rainfall”,Indian Journal of Radio & Space physics Vol. 18, june 1989, pp. 117-119
21. Abinash Sahoo, Dillip K. Ghose “Flood frequency analysis for menace gauging station of Mahanadi river,india”,J. Inst. Eng. India Ser. A (september 2021) 102(3):737-748

International Research Journal of Engineering and Technology (IRJET) e-ISSN: 2395-0056
Volume: 11 Issue: 11| Nov 2024 www.irjet.net p-ISSN:2395-0072
22. Resat Acar, Samet Celik & Serkan Senocak “Rainfall intensity-duration-frequency (IDF) model using an artificial neural network approach”,Journal of Scientific & Industrial research vol.67 march 2008. Pp. 198-202
23. Jitendra Rajput, N.L Kushwaha, D. K. Singh and Indra Mani ‘Trend assessment of rainfall, temperature and relative humidity using nonparametric tests in the national capital region, Delhi”,MAUSAM, 74, 3 (july 2923), 593-606
24. Operation and Maintenance Manual for Peechi Dam Kerala State, Central Water Commission Ministry of WaterResourcesGovtofIndia
25. https://www.google.com/url?sa=t&source=web&rct =j&opi=89978449&url=https://irrigation.kerala.gov .i
26. Amudha. B., 2013 Operational weather forecasting using data from Automatic Weather stations and other modern observing system- Case study of tropicalcyclone, Mausam, v.64, pp.437-456
27. Gurugnanam .B, Suresh. M , Vinoth. M . and Kumaravel. S High/Low Rainfall Domain Demarcation Mapping Using GIS at Salem District, Central Tamil Nadu. (ISSN 0974 - 6846).Indian Journal of Science and Technology. Vol. 3. No.5. pp.542-545.,2010
28. Ishappa Muniyappa Rathod, Aruchamy.S., Spatial Analysis of Rainfall Variation in Coimbatore District Tamilnadu using GIS, International Journal of Geomatics and Geosciences Volume 1, No 2,.2010
29. Seetharam, K., Rainfall analysis over Rayalaseema meteorologicaldivision, Mausam.2013
30. Jitendra Rajput, N.L Kushwaha, D. K. Singh and Indra Mani ‘Trend assessment of rainfall, temperature, and relative humidity using nonparametric tests in the national capital region, Delhi”,MAUSAM,74,3(July2923),593-606
31. https://power.larc.nasa.gov/data-access-viewer/
