
International Research Journal of Engineering and Technology (IRJET) e-ISSN: 2395-0056
Volume: 11 Issue: 11 | Nov 2024 www.irjet.net p-ISSN: 2395-0072

International Research Journal of Engineering and Technology (IRJET) e-ISSN: 2395-0056
Volume: 11 Issue: 11 | Nov 2024 www.irjet.net p-ISSN: 2395-0072
Austin Indrapaul A 1 , Gokuldhev M 2
1PG student, Dept. of Computer Science & Engineering, Vel tech University, Chennai, India
2 Ass. Professor, Dept. of Computer Science & Engineering, Vel tech University, Chennai, India
Abstract - Economic data analysis plays a crucial role in various aspects of decision-making, policy formulation, and understanding the state of the economy. This project introduces a sophisticated no-code solution tailored for comprehensive data analysis and visualization. This innovative initiative is designed to empower users to gain insights on data, without the need of writing a code. By leveraging these we will analyze economic data for a country and create an AI model which uses real time information. Through the integration of some advanced technologies such as React, Flask, and Python, our web-based application delivers an interactive and user-friendly platform for conductingin-depthanalysisonthisdatasetbyendusers.The bull or bear run of sectors such as real estate, energy, FMCG etc. can be forecasted with the analyzed data using the AI model. The app will feature MVC architecture to improve scalability and easier maintenance. This project can help to understandacountry'seconomicposition,movement,pattern anditsimpactonvarioussectorsbasedonseveralfactors,and it can predict the future trends.
Key Words: DataAnalysis,EconomicDataset,Forecasting, SectorAnalysis,No-CodeApp
1.INTRODUCTION
Economic data analysis plays a crucial role in understanding and making informed decisions about the economy.Theobjectiveistoremovebarriersforindividuals whomaynothaveprogrammingordatascienceskillsbut still want to perform analysis on economic datasets. The solutionwillofferauser-friendlyinterfacethatallowsusers toselectthedesireddataset,choosetheanalysistheywant toperform,andgenerateinsightsandvisualizationswithout writinganycode.Theprojectoperateswithinthedomainof Data analysis and Machine learning through a web application. To ensure accurate and reliable analysis, the project will prioritize data processing and transformation operations. Visualization will enable users to explore and interactwiththechartstogainadeeperunderstandingof theeconomicdata.Ithaswide-rangingapplicationsinpolicy making, business analysis, financial services, academic research, non-profit organizations, economic forecasting, andriskassessment.Withthehelpofadvancedtechnologies, this toolkit will make economic data analysis more accessibleanduser-friendly.
Theexistingsystemforeconomicdataanalysistypically involves theuse ofstatistical softwarelikeR orPython.In this system, professionals with expertise in economics, finance, or data analysis are required to write code to manipulate and analyze economic data. They use programming languages to perform tasks such as data cleaning, transformation, statistical modeling, and visualization.Thisapproachrequiresastrongunderstanding ofprogrammingconceptsandstatisticaltechniques,making itmoresuitableforindividualswithtechnicalbackgrounds. Theexistingsystemofteninvolvesasteeplearningcurvefor non-technical users who may not have the necessary programmingskillsordomainknowledge.
Disadvantage: Modelstrainedwithhistoricdatacanbe lesseffectiveandaddingdiversedatasetstothepretrained modelcanbechallenging.Also,theexistingsoftwarecanbe complexfortheindividualswithoutatechnicalbackground.
Thisprojectaimstosimplifytheprocessandmakeitmore accessible to non-technical users. It would involve the development of a user-friendly interface or platform that allows users to perform economic data analysis without writingcode.Theproposedsystemwouldprovideintuitive tools and functionalities that enable users to manipulate, analyze,andvisualizeeconomicdatausingavisualinterface. This could include features such as drag-and-drop functionality, pre-built analysis templates, interactive visualizations, and automated data cleaning and transformationprocesses.
Advantages: The goal of the proposed system is to empower users with limited technical skills to conduct economic data analysis efficiently and effectively, without the need for extensive programming knowledge. The analysisperformedwillbecompletelyuser-driven,basedon theuser’sneedsthemodel canbetunedanditprovidesa personalizedfeelfortheuser.
For this application, MVC architecture is followed, the MVC(Model-View-Controller)architectureisadesignpattern
Volume: 11 Issue: 11 | Nov 2024 www.irjet.net p-ISSN: 2395-0072
that separates an application into three interconnected components. The Model represents the application's data structure and business logic. The View is responsible for rendering the Model's data to the user, and the Controller handles user input and updates the Model and View accordingly. This architecture promotes organized coding practices and allows for efficient code management and scalability.
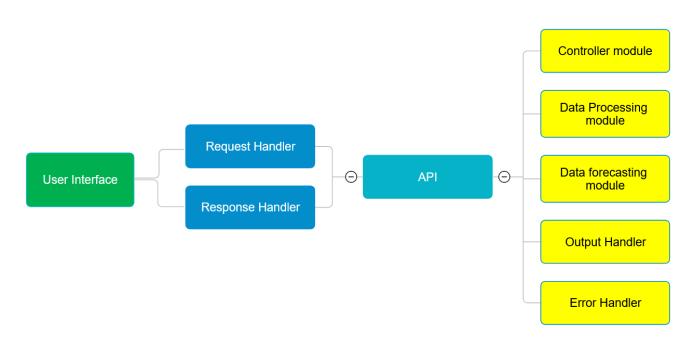
InaboveFig-1,Thearchitecturediagramdepictsamodular software system, comprising a User Interface (UI), an Application Programming Interface (API), and various backend modules. TheUI, the componentwithwhich endusers interact, is connected to two handlers: the Request HandlerandtheResponseHandler.Thesehandlersarelikely responsibleforprocessingincomingrequestsfromtheUIand sendingbackresponsesafterprocessing,respectively.
TheAPIservesasagatewaybetweentheUIhandlersandthe backend modules, facilitating communication and data exchange.OntherightsideoftheAPI,therearefivedistinct backendmodules,eachwithaspecificrolewithinthesystem:
Controller module: This could be the central unit that orchestrates the flow of data and commands between the othermodules.
Data Processing module:Thismoduleislikelyresponsible formanipulatingandpreparingdataforfurtheranalysisor presentation.
Data forecasting module: This suggests the system has predictivecapabilities,possiblyusinghistoricaldatatomake futureprojections.
Output Handler: Thismodulemaybeinchargeofformatting anddeliveringtheprocesseddataorresultsbacktotheUI throughtheAPI.
Error Handler: Thismoduleiscrucialforrobustness,asit manages errors that may occur during the processing of requests. It ensures that the system can gracefully handle exceptionsandprovidemeaningfulfeedbacktotheuser.
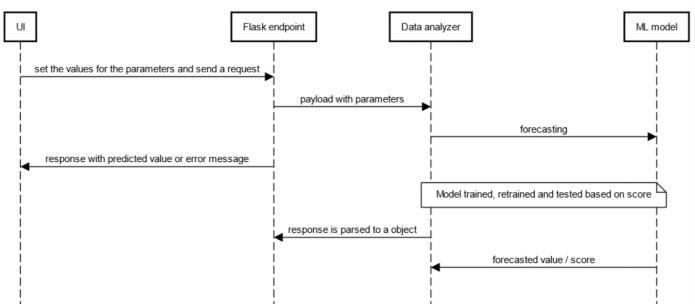
InaboveFig-2,wehavethreemainparticipants:theUser,the System,andtheForecastingModel.Theapplicationbegins whentheusergivesthevaluesfortheinputparameters.The datawillbesenttobackendsystemviaflaskAPIendpoint. Followingthis,allthevalidationsareperformedontheinput. Thentheparsedinputissenttothemodelfortheprediction. The model can be retrained for improving the accuracy. Finally,theoutputinpassedbacktotheUI.
In summary, these diagrams represent a structured approach to handling user requests, processing data, and managingsystemresponsesanderrors,whichistypicalin modernsoftwarearchitecture.Overall,thediagrampresents ahigh-levelviewofasystemdesignedtointeractwithusers, processcomplexdata,andreturnresultsinanefficientand controlledmanner.Theseparationofconcerns,asshownby thedistinctmodules,suggestsamodulardesignthat could facilitatemaintenanceandscalability.
BelowaretheImplementationsteps:
1. Collect and clean economic data: Gather relevant economic data from reliable sources such as government databases,financialinstitutions,andresearchorganizations. The collected data should then be carefully cleaned and organized to ensure its accuracy and consistency. This processmayinvolveremovingduplicates,handlingmissing values,andstandardizingthedataformat
2. Process and analyze the data: Importthecollected economic data into the workspace and preprocess it. LeveragetheexistinglibrariesandAIcapabilitiestoperform dataanalysistaskssuchasexploratorydataanalysis,data transformation,correlationanalysis,andregressionanalysis.
3. Generate the model: Afterprocessingandanalyzing thedata,thenextstepistogeneratethemodel.Thisinvolves training the AI models on historical data to learn the patternsandrelationshipsspecifictoeachsector.Theinput parameters weconsidered herearedate,population, gold price,oilprice,S&Pindex,GNI,andInflation,thentheoutput parameters are real-estate index and IT index. ML algorithmscanbeusedtodeveloppredictivemodelsthat
International Research Journal of Engineering and Technology (IRJET) e-ISSN: 2395-0056
Volume: 11 Issue: 11 | Nov 2024 www.irjet.net p-ISSN: 2395-0072
canforecastfutureeconomicconditions.Themodelscanbe trained using techniques such as supervised learning, unsupervisedlearning,ortimeseriesanalysis,dependingon thenatureofthedataandtheforecastingrequirements.
4. Develop a MVC web application: Toprovideauserfriendly interface for interacting with the economic data analysis and forecasting models, a Model-View-Controller (MVC) web application can be developed. The MVC architecturalpatternallowsfortheseparationofconcerns, withthemodelrepresentingthedataanditsrelatedlogic, theviewhandlingthepresentationofdatatotheuser,and thecontrolleractingasaninterfacebetweenthemodeland the view components. This separation allows for easier maintenance,scalability,andreusabilityoftheapplication.
5. Integration: The final step is to integrate the developedmodelsandtheMVCwebapplication.Themodels canbeintegratedintotheapplicationtoprovidereal-timeor on-demandforecastingcapabilities.Theapplicationcanbe designed to allow users to input specific parameters or criteriaforgeneratingsector-wiseforecasts.Theintegration should ensure seamless communication between the user interface, the data analysis models, and the forecasting algorithms, providing users with accurate and up-to-date insights.
For the complete source code, documentation, and further updates on this project, please visit the GitHub repository Thisrepositorycontainsallthenecessaryfiles, includingtheapplicationcode,installationinstructions,and userguidestohelpyougetstartedwiththeEconomicData AnalysisusingFlaskApp.
https://github.com/austin-indrapaul/ResearchProjects
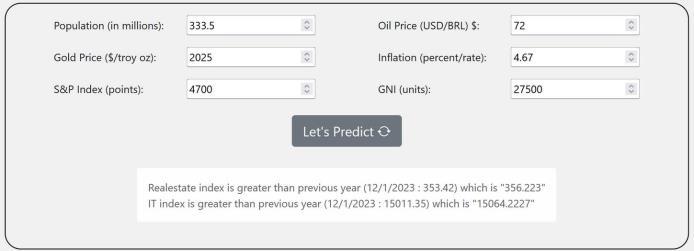
Fig-3:OutputorthepredictedvaluefromthemodelinUI
The Fig-3, involves the initialization of the input parameterssystem,alltheinputsareobtainedfromtheUI andsenttothebackendsystemfortheanalysis.Theseinputs will be sent in a JSON format and the validation steps are performed.Aftersuccessful validationtheinputarefedto the model for the prediction. The predicted values are correlated with the last set of records and it generates a meaningfulresult.
• Multi-modal Data Integration:
Incorporate additional modalities of data, such as employmentrate,crimerateandconsumerpriceindex(CPI) whichcreatesacomprehensiveandmoreaccuratemodel. Thiscouldenhancetheaccuracyandreliabilityofpredicted values.
• Real-time information and Intervention:
Develop capabilities for real-time feedback and data intervention, where the system can provide a facility to regenerate the model after add the new data, henceforth providing the model with latest data which improves its reliability.
• Personalized Recommendations:
Insteadofusingafixeddataset,wecanmakeanoption to usethecompletelydifferentcountry’sdataset,whichcanbe morehelpfultoenduser.Also,alltheanalysisperformedina sessioncanbesentviamailorsavedforfutureuse.
• User Interface and Accessibility:
Improve the user interface of the system to make it more intuitiveanduser-friendly.Consideraccessibilityfeaturesto ensurethatindividualswithdiverseneedscaneasilyinteract withandbenefitfromthesystem.
• Continuous Model Training:
Implementa mechanism for continuousmodel training to keep the system updated with evolving data using a table editorfromtheUI.Thiscouldinvolveperiodicallyretraining themodelwithnewdatasetstoimproveitsadaptabilityover time.
Byunderstandingeconomicstatisticsandusingstatistical methods, economic data analysis helps in interpreting trends,patterns,andrelationships.Overall,economicdata analysisisessentialforinformeddecision-making,resource allocation,andunderstandingtheeconomy.Auser-friendly UI based application for economic data analysis can contributetoimproveduserexperience,thereforeitmakes dataanalysismoreefficientandeffective.
[1] H.WilliamsandP.Davis,“Data-DrivenDecisionMaking in Economics: Techniques and Tools,” Review of EconomicStudies,vol.90,no.4,October2024,pp.789803,doi:10.1093
International Research Journal of Engineering and Technology (IRJET) e-ISSN: 2395-0056
Volume: 11 Issue: 11 | Nov 2024 www.irjet.net p-ISSN: 2395-0072
[2] J. Smith and A. Johnson, “Economic Data Analysis: Techniques and Applications,” Journal of Economic Perspectives, vol. 35, no. 4, Fall 2021, pp. 45-67, doi:10.1257
[3] K. Thompson and J. Green, “Exploring the Impact of EconomicIndicatorsthroughDataAnalytics,”Journalof Economic Research, vol. 15, no. 1, February 2024, pp. 33-51,doi:10.2307
[4] M.LeeandT.Zhao,“TheRoleofEconomicDataAnalysis in Policy Making: Lessons from Recent Trends,” EconomicPolicyAnalysis,vol.8,no.3,September2024, pp.205-220,doi:10.1080
[5] R. Patel and S. Thompson, “Flask for Economic Data Visualization: Techniques and Case Studies,” InternationalJournalofEconomicAnalysis,vol.15,no. 2,April2024,pp.120-135,doi:10.1080