
International Research Journal of Engineering and Technology (IRJET) e-ISSN: 2395-0056
Volume: 11 Issue: 12 | Dec 2024 www.irjet.net p-ISSN: 2395-0072


International Research Journal of Engineering and Technology (IRJET) e-ISSN: 2395-0056
Volume: 11 Issue: 12 | Dec 2024 www.irjet.net p-ISSN: 2395-0072
Neha Nandkeolyar1*, Anurag Kandya2, Viral Patel2, Shubham Kela2
1 Government Arts and Science college, Harij, Patan 2Department of Civil Engineering, Pandit Deendayal Energy University, Gandhinagar
Abstract - This studyinvestigates the temporalandspatial variations of Land Surface Temperature (LST) in Gandhinagar, Gujarat, over an 18-year period (2003–2020) using satellite-based observations to understand the thermal impacts of urbanization. The findings reveal a contrasting trend in LST dynamics, with a decrease in daytime LST at a rate of 0.05°C/year and an increase in nighttime LST at a rateof 0.07°C/year,whichis atypicalcharacteristicofurban heatislandeffects.DaytimeLSTwasobservedtovarybetween 40°C and 43°C, while nighttime LST ranged from 20°C to 22°C during the study period. Spatial analysis revealed a distinctlongitudinalthermalstratificationfordaytimeLSTby 2020, with the lowest temperatures recorded in greencovered areas such as Indroda Park, Punit Van, and Akshardham Temple, emphasizing the significant cooling effect of vegetation. In contrast, industrial zones in the GIDC area on the western side consistently exhibited higher daytime temperatures due to impervious surfaces and urban activity. Nighttime LST, on the other hand, showed a progressive concentration of higher temperatures in the central zone of the city, attributed to the thermal inertia of densely built-up areas with limited vegetation. These results highlight the critical role of urban structures and declining green cover in shaping the city’s thermal environment. The study underscores the need for climate-sensitive urban planning, recommending measures such as expanding green spaces, enhancing vegetation, using reflective building materials, and implementing sustainable urban design practices to mitigate thermal challenges. By providing a detailed understandingof LST dynamics inGandhinagar, this research offers valuable insights for policymakers and urban planners to address urban heat islands and improve urban livability. It also emphasizes the importance of long-term monitoring of urban thermal environments to inform sustainable and adaptive urban development strategies.
Key Words: Land Surface Temperature, MODIS, Gandhinagar, Heat Islands, Urban Planning
1. Introduction
The world is grappling with a continuous rise in globaltemperatures,aphenomenonprimarilyattributedto rapid urbanization (Mathew et al., 2018). Urbanization, characterizedbythetransformationofnaturallandscapes intobuiltenvironments,hasbeenidentifiedasasignificant
contributortoenvironmentalchangesonaglobalscale.This transformationaltersthephysicalandthermalpropertiesof land surface materials, leading to various environmental challenges such as global warming, urban heat islands (UHIs), air pollution, and ecological degradation. These changesadverselyimpactthequalityoflifeandcomfortof urban populations, necessitating urgent attention and intervention(Kandya&Mohan,2018;Mathewetal.,2016; Mohan&Kandya,2015).
Among the myriad consequences of urbanization, changesin land surface temperature (LST) areofcritical concern. LST is a measure of the effective radiating temperatureoftheEarth'ssurface,playingapivotalrolein regulating surface heat and water exchange with the atmosphere.Thephenomenonofurbanheatislands,which describeselevatedtemperaturesinurbanareascomparedto theirruralsurroundings,isintricatelylinkedtochangesin LST.Theincreaseinimpervioussurfaces,suchasconcrete andasphalt,andthedeclineinvegetativecovercontributeto significantalterationsinLSTpatterns(Gohainetal.,2020). The measurement of LST has become a vital tool for understanding urban thermal dynamics and their environmental implications. It can be assessed through ground-based methods, such as handheld radiation thermometers, or via satellite and aircraft-based sensors that measure thermal radiance from the land surface. Satellite-based methods, in particular, have gained prominence due to their ability to provide large-scale, consistent, and long-term observations. Using thermal infrared(TIR)spectralchannels,satellitedata enablesthe derivation of LST values over expansive areas while accountingforatmosphericattenuationeffects(Eleftheriou etal.,2018).
Urbanization is particularly relevant to cities in rapidly developing regions like India, where urban expansionhasbeenoccurringatanunprecedentedpace.In thiscontext,thecapitalcityofGujarat, Gandhinagar,serves as a compelling case study. Gandhinagar, designed as a planned city in the mid-20th century, has experienced significant urban growth over recent decades. The city's transformation,drivenbyinfrastructuraldevelopmentand population growth, has likely impacted its thermal environment, with implications for both the environment andpublichealth.

International Research Journal of Engineering and Technology (IRJET) e-ISSN: 2395-0056
Volume: 11 Issue: 12 | Dec 2024 www.irjet.net p-ISSN: 2395-0072
Theuseofsatellite-derivedLSTdataoffersaunique opportunity to investigate the spatial and temporal dynamics of temperature changes in Gandhinagar. By examining daytime and nighttime LST over an 18-year period (2003–2020), this study seeks to understand how urbanization has influenced the thermal landscape of the city.Thestudywillbringouttheinterplaybetweenurban expansionandthermalpatterns,offeringacomprehensive viewofurbanthermaldynamics.Thefindingsofthisstudy will have significant implications for urban planning and governance. Understanding the changing LST dynamics of Gandhinagar will not only reveal the spatial magnitude of urbanization but also provide actionable insights for policymakers and civic administrators. These insights can guidetheimplementationofmitigationmeasuresaimedat reducing the adverse impacts of rising temperatures and urban heat islands. Moreover, this research aligns with globaleffortstoaddressurbanenvironmentalchallengesin thecontextofclimatechange.TheanalysisofLSTchanges contributes to the broader discourse on sustainable urbanizationbyemphasizingtheneedforclimate-sensitive planning and design. As cities continue to expand, integratingthermalenvironmentconsiderationsintourban developmentplanswillbecrucialforfosteringresilientand livableurbanspaces.
With the background, the present study is undertaken that focuses on the temporal analysis of LST variations in Gandhinagar, Gujarat, using remotely sensed satellitedatafrom2003to2020.Byexploringthedynamics ofdaytimeandnighttimeLST,theresearchaimstouncover the thermal consequences of urbanization in a rapidly growing city. The insights gained from this analysis will inform strategies to mitigate the impacts of rising temperatures and urban heat islands, ultimately contributing to a healthier and more sustainable urban environmentfortheresidentsofGandhinagar.
The present study is done over the ‘Green city Gandhinagar’ which spreads around 61.55 km2 Fig. 1 displaysthesatelliteimageryofthestudyareawhileTable1 containstheprominentlocationsofthecityrepresentingthe differentland-uses/land-covers.
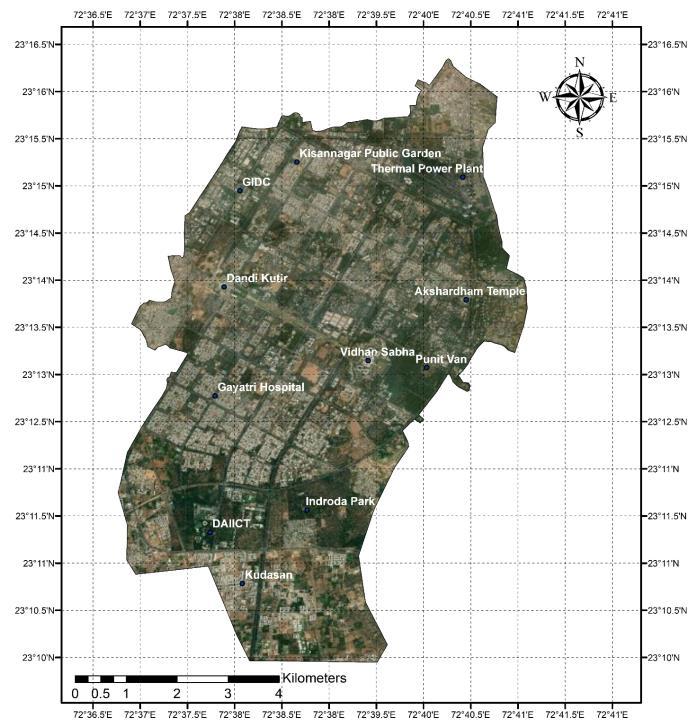
Fig -1:Studyarea–GandhinagarcityMap
Table -1: StudyareawithLand-use/Land-cover
Locations
DandiKutir
Land-use/Land-cover
Mediumbuilt-uparea
ThermalPowerPlant Industrialarea
AkshardhamTemple
Medium built-up area withgreencover
PunitVan Greencover
VidhanSabha
Kudasan
Medium built-up area withgreencover
Mediumbuilt-uparea
IndrodaPark Greencover
GayatriHospital Denselybuilt-uparea
DAIICT Built-upwithgreencover
KisannagarPublicGarden Greencover
GIDC Industrialestate
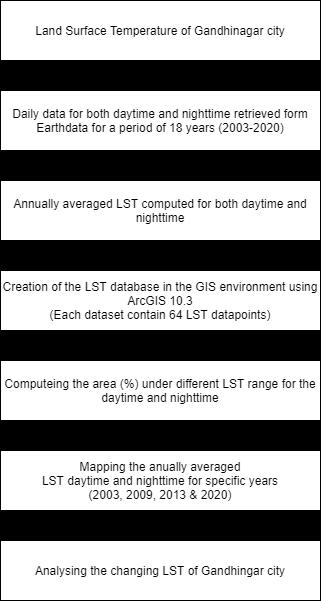
In the present study, Aqua-MODIS LST daytime and nighttimedata(freeavailableatNASA’sEarthDataportal) (National Aeronautics and Space Administration) was retrievedforthecityofGandhinagarforaperiodof18years (2003-2020).Thisdataisavailableataspatialresolutionof 1km×1kmandtemporalresolutionof24hours.

International Research Journal of Engineering and Technology (IRJET) e-ISSN: 2395-0056
Volume: 11 Issue: 12 | Dec 2024 www.irjet.net p-ISSN: 2395-0072
TheLSTdataretrievedfortheavailabledateswas annualaveragedforthespecificyearsandfurtheraveraged forthestudyarea.AnnuallyaveragedLSTmappingwasdone for the specific years (2003, 2009, 2011 and 2020) using ArcGIS10.3.
5. RESULTS AND DISCUSSION
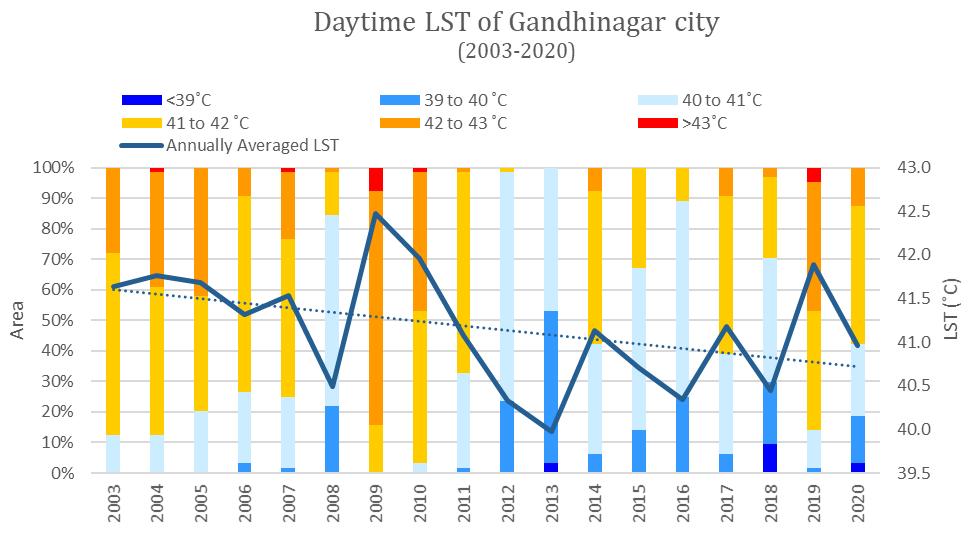
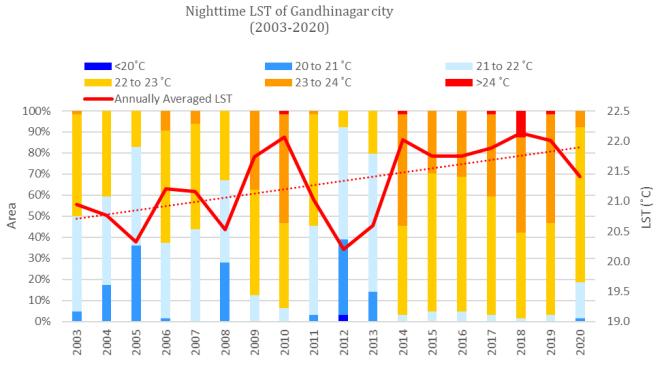
Figures3(a)and3(b)illustratethepercentagearea distribution of annually averaged LST for daytime and nighttime, respectively,accompanied bylineartrendlines over the study period. These figures reveal contrasting trends: a decreasing trend in daytime LST and an increasing trend in nighttime LST. Such patterns align withfindingsfromotherglobalstudies(Colacino&Rovelli, 1983;Karletal.,1988;Mohanetal.,2011),underscoringthe influenceofurbanizationondiurnalthermaldynamics.
ThereductionindaytimeLSTcanbeattributedto urban surfaces absorbing heat during the day, which is subsequentlyre-radiatedatnight,contributingtoelevated nighttime LST. This thermal behavior is exacerbated by a decline in green cover, which limits the cooling effect of vegetation and accelerates heat retention in impervious urbanstructures.
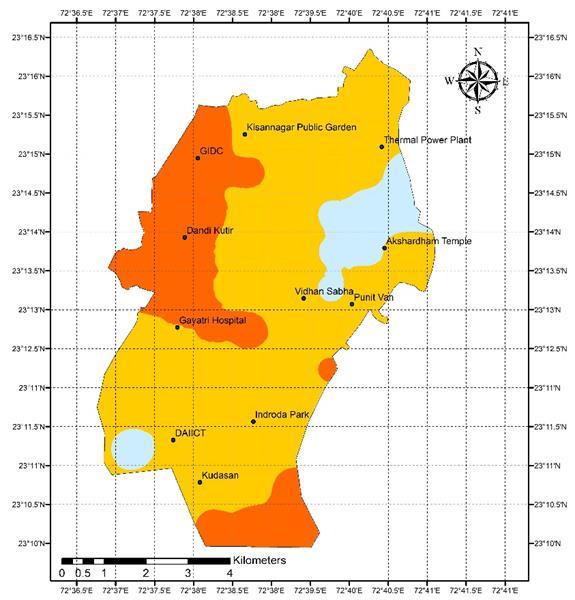
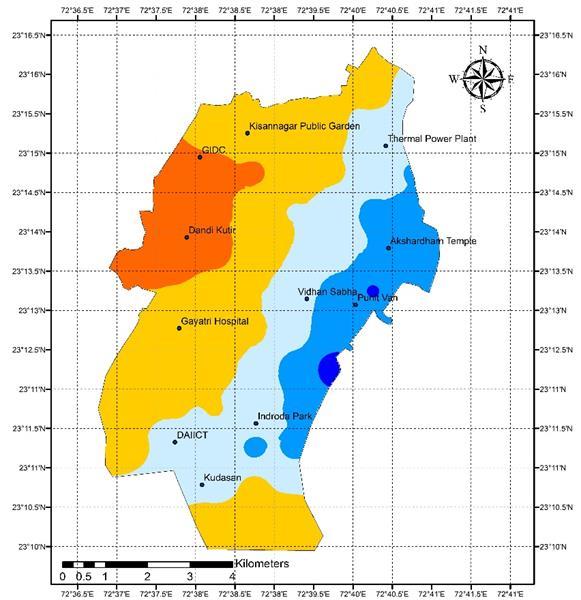
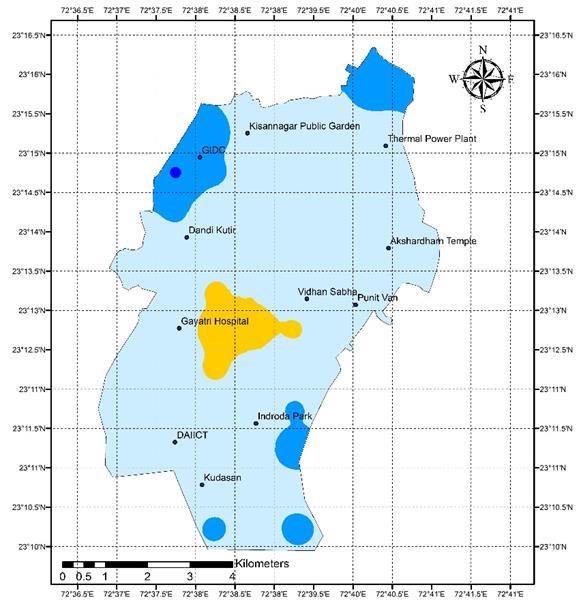
Figure 4 (a-b) illustrates the spatial distribution of annuallyaverageddaytime LSTover Gandhinagarfor two selectedyears:
2003 (startofthestudyperiod),and
2020 (endofthestudyperiod).
During the study period, daytime LST values ranged from 40°C to 43°C,showingadecreasingtrendatarateof 0.05°C/year.Anoticeablelongitudinalthermalstratification developedovertime,withdistinctspatialpatternsemerging by2020.
Eastern regions,dominatedbygreenspacessuch as Indroda Park, Punit Van,andthe Akshardham Temple,consistentlyexhibitedthe lowest daytime LST,reflectingthecoolingeffectofvegetation.
Incontrast,the western regions,particularlythe GIDC industrial area, recorded the highest daytime LST, highlighting the thermal impact of urban-industrialactivityandimpervioussurfaces.
Thisspatialdivergenceunderscorestheroleoflanduse and vegetation cover in influencing daytime thermal patternsinthecity.
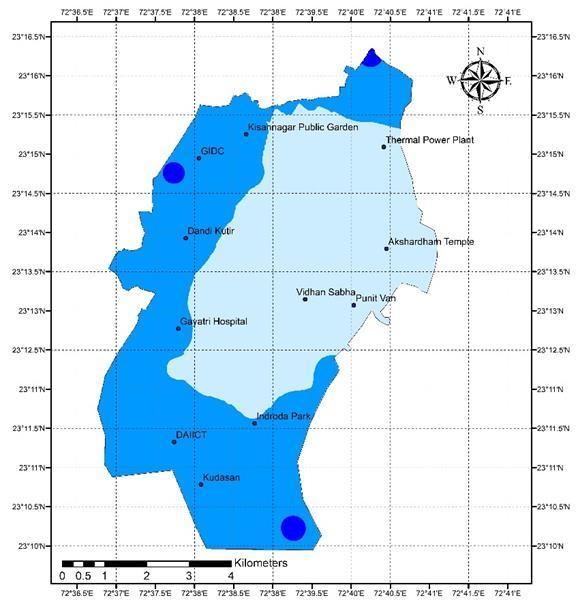
Figure5(a-b)showsthespatialdistributionofannually averagednighttimeLSTforthesameselectedyears(2003 and 2020). Over the study period, nighttime LST values rangedfrom 20°C to 22°C andexhibitedanincreasingtrend atarateof 0.07°C/year.
Fig. - 2: Methodologyflowchart
In the early years of the study period, higher nighttime LST values were concentrated in the central to northeastern regions ofthecity.
Bythe later years,the central zone emergedasthe area with consistently higher nighttime temperatures,indicatingashiftinthermalhotspots.

International Research Journal of Engineering and Technology (IRJET) e-ISSN: 2395-0056
Volume: 11 Issue: 12 | Dec 2024 www.irjet.net p-ISSN: 2395-0072
The rising nighttime LST reflects the cumulative effect of heat retention by urban infrastructure, which re-radiates stored heat during the night. The urban core, with dense built-up areas and reduced vegetation, has become a prominentheatsourceduringnighttime,furtherintensifying theurbanheatislandeffect.




International Research Journal of Engineering and Technology (IRJET) e-ISSN: 2395-0056
Volume: 11 Issue: 12 | Dec 2024 www.irjet.net p-ISSN: 2395-0072
Thepresentstudyprovidesacomprehensiveassessment of the temporal and spatial dynamics of Land Surface Temperature(LST)inGandhinagarcity,Gujarat,overan18year period (2003–2020), focusing on both daytime and nighttimeLSTvariations.Thefindingsrevealcriticalinsights intothethermalbehaviorofthecityanditsevolutionunder theinfluenceofurbanization,withseveralkeyconclusions outlinedbelow:
AdecreaseindaytimeLSTandanincreaseinnighttime LSTwereobserved,apatterncharacteristicofurbanization Thisreflectstheabsorptionofsolarradiationbyimpervious surfacesduringthedayandthesubsequentre-radiationof stored heat at night, commonly associated with the urban heat island effect. The daytime LST declined at a rate of 0.05°C/year, while the nighttime LST rose at a rate of 0.07°C/year,indicatingamorepronouncedwarmingtrend duringthenightcomparedtothecoolingtrendduringthe day.
Over the study period, the daytime LST exhibited a longitudinalthermalstratification,withdistincttemperature variationsacrossdifferentregionsofthecityby2020.Areas withsignificantgreencover,suchasIndrodaPark,PunitVan, and the Akshardham Temple, consistently recorded the lowest daytime LST, underscoring the cooling effects of vegetation.Conversely,industrialzones,particularlyinthe GIDCareaonthewesternside,emergedasdaytimethermal hotspotsduetotheprevalenceofimpervioussurfacesand urbanactivities.Duringthenighttime,thecentralzoneofthe cityexperiencedaprogressiveincreaseinLST,highlighting thethermalinertiaofdenselybuilt-upareas.
The trends observed align with broader global studies, reaffirmingthaturbanizationsignificantlyaltersthethermal landscape of cities. The expansion of impervious surfaces, coupledwitha declineinvegetativecover,intensifiesheat retentionandre-radiationprocesses,exacerbatingnighttime warming.Thefindingshighlighthowtheinterplaybetween natural features and urban structures shapes the thermal environment.Greenspaceseffectivelymitigatedaytimeheat, whiledenselyurbanizedareaswithlimitedvegetationexhibit highernighttimetemperatures.
The increasing nighttime LST and localized thermal hotspotsraiseconcernsregardingtheintensificationofurban heatislands,withpotentialimpactsonpublichealth,energy consumption,andoverallurbanlivability.
Thesefindingsunderscoretheneedforclimate-sensitive urban planning. Strategies such as expanding urban green spaces, increasing tree cover, using reflective building materials,andadoptingsustainableurbandesignscanhelp mitigateLSTchangesandimprovethermalcomfort.
The study highlights the importance of continuous monitoringofLSTtounderstandthelong-termimplications ofurbanizationonthethermalenvironment.Futurestudies could expand on this work by incorporating additional variablessuchaspopulationdensity,landusechanges,and socio-economic factors to provide a more holistic understandingofurbanthermaldynamics.Theintegrationof advanced modeling approaches and higher-resolution satellite data can enhance the accuracy of LST predictions andinformmoretargetedurbaninterventions.
Inconclusion,thestudyestablishesthaturbanizationin Gandhinagar has led to discernible changes in its thermal environment, with decreasing daytime temperatures and increasing nighttime temperatures. The spatial patterns emphasize the critical role of green infrastructure in moderatingurbanheat.Addressingthesethermalchallenges throughinformedurbanplanningandadaptivestrategieswill be crucial for ensuring the sustainability and resilience of Gandhinagarasitcontinuestodevelop.
The authors express their sincere gratitude to GovernmentArtsandScienceCollege,Harij,Patan,andPandit Deendayal Energy University, Gandhinagar, for their invaluable support and encouragement throughout this study.SpecialthanksareextendedtoNASAforprovidingthe freely accessible satellite data, which was instrumental in conductingthisresearch.
[1] Mathew, A., Khandelwal, S., & Kaul, N. (2018). Analysisofdiurnalsurfacetemperaturevariations for the assessment of surface urban heat island effectoverIndiancities.EnergyandBuildings,159, 271–295. https://doi.org/10.1016/j.enbuild.2017.10.062
[2] Kandya, A., & Mohan, M. (2018). Mitigating the UrbanHeatIslandeffectthroughbuildingenvelope modifications.EnergyandBuildings,164,266–277. https://doi.org/10.1016/j.enbuild.2018.01.014
[3] Mathew,A.,Sreekumar,S.,Khandelwal,S.,Kaul,N., & Kumar, R. (2016). Prediction of surface temperatures for the assessment of urban heat islandeffectoverAhmedabadcityusinglineartime

International Research Journal of Engineering and Technology (IRJET) e-ISSN: 2395-0056
Volume: 11 Issue: 12 | Dec 2024 www.irjet.net p-ISSN: 2395-0072
seriesmodel.EnergyandBuildings,128,605–616. https://doi.org/10.1016/j.enbuild.2016.07.004
[4] Mohan, M., & Kandya, A. (2015). Impact of urbanization and land-use/land-cover change on diurnaltemperaturerange:Acasestudyoftropical urbanairshedofIndiausingremotesensingdata. Science of the Total Environment, 506–507, 453–465. https://doi.org/10.1016/j.scitotenv.2014.11.006
[5] Gohain,K.J.,Mohammad,P.,&Goswami,A.(2020). Assessingtheimpactoflanduselandcoverchanges onlandsurfacetemperatureoverPunecity,India. Quaternary International. https://doi.org/10.1016/j.quaint.2020.04.052
[6] Eleftheriou,D.,Kiachidis,K.,Kalmintzis,G.,Kalea,A., Bantasis, C., Koumadoraki, P., Spathara, M. E., Tsolaki,A.,Tzampazidou,M.I.,&Gemitzi,A.(2018). Determinationofannualandseasonaldaytimeand nighttime trends of MODIS LST over Greececlimate change implications. Science of the Total Environment, 616–617, 937–947. https://doi.org/10.1016/j.scitotenv.2017.10.226
[7] Nationalaeronauticsandspaceadministration. (n.d.).EarthData:OpenAccessforopenscience. https://earthdata.nasa.gov/
[8] Colacino, M., & Rovelli, A. (1983). The yearly averaged air temperature in Rome from 1782 to 1975. Tellus A, 35 A(5), 389–397. https://doi.org/10.1111/j.16000870.1983.tb00214.x
[9] Karl,T.,Diaz,H.,&Kukla,G.(1988).Urbanization: ItsDetectionandEffectintheUnitedStatesClimate Record.AmericanMeteorologicalSociety,148,148–162.
[10] Mohan, M., Kandya, A., & Battiprolu, A. (2011). Urban Heat Island Effect over National Capital Region of India: A Study using the Temperature Trends. Journal of Environmental Protection, 02(04), 465–472. https://doi.org/10.4236/jep.2011.24054
[11] Kandya,A.,&Mohan,M.(2018).Mitigating the Urban Heat Island effect through building envelopemodifications.EnergyandBuildings,164, 266–277.
https://doi.org/10.1016/j.enbuild.2018.01.014
2024, IRJET | Impact Factor value: 8.315 |