
International Research Journal of Engineering and Technology (IRJET) e-ISSN: 2395-0056
Volume: 11 Issue: 12 | Dec 2024 www.irjet.net p-ISSN: 2395-0072

International Research Journal of Engineering and Technology (IRJET) e-ISSN: 2395-0056
Volume: 11 Issue: 12 | Dec 2024 www.irjet.net p-ISSN: 2395-0072
Anantbhat Sachin Narayan1, Akilesh Revankar2, Enriq Dsouza3 , Gourish Katti4 Mahesh Sattigeri5 , Rajeev. B. Nerlagunte6
1234Undergraduate Students B.E(Mechanical Engineering) K.L.S Gogte Institute of Technology, Belagavi, Karnataka 5Assistant Professor Dept of Mechanical Engineering K.L.S Gogte Institute of Technology, Belagavi, Karnataka 6Partner, Rajeev and Company, Devarwadi, Maharashtra
Abstract - This research paper summarizes the design and fabrication of the experimental setup used to determine the characteristics curve of the three-way ball valve for varying sizes of valves using a digital ultrasonic flow meter and differential pressure gauge. An attempt has been made to explain the design thinking involved in the designing of the entire setup to achieve the results. Humble efforts have been made to showcase the entire methodology, which helps to obtain a clear understanding of the concept and thus contribute to the growth of the reader’s knowledge.
Key Words: Fluid Mechanics, Ball Valve, Characteristic Curve, Mechanical Engineering, Instrumentation Engineering, Digital Electronics, Design Thinking
1. INTRODUCTION
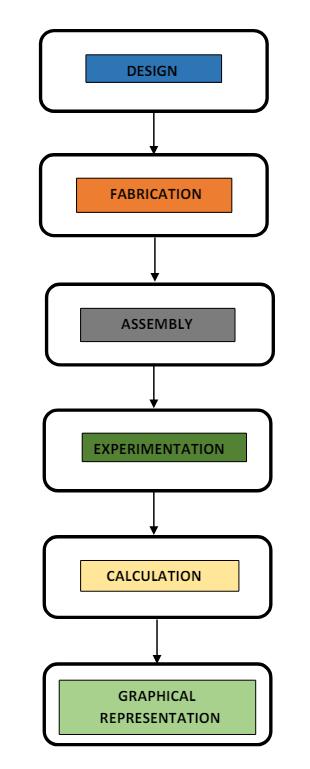
In this research paper, the reader will get to know the methodology followed, the technology used, designing, fabrication,andexperimentationthatwillenabletoobtain thecharacteristicscurveofathree-wayballofvaryingsizes. It is a composition of various elements of the start-to-end procedure implemented, which are key factors to successfullyobtainthedesiredresults.Thesetupwasmade toobtainthecharacteristicscurveandisacontributionto academia and industry in the fields of fluid mechanics, mechanicalengineering,andcontrolengineering.
The word valve is derived from the Latin word ‘Valva’, whichmeansamovingpartofadoor.Avalveisadeviceused forcontrollingthepassageoffluidalongthelengthofatube, pipe,orductbytheactionofopeningandclosingthepassage.
Athree-wayballvalveisatypeofvalvethatstartsorstops andregulatestheflowoffluidbyusingahollow,perforated ballthatismountedinsidethemainbody Theregulationis done by the movement of the ball which is done with the helpofaleverconnectedtoit.
If the hole inside the ball is in line with the flow, it determines whether the valve is open, and if it is
perpendiculartotheflowthatdetermineswhethertheflow isobstructedbytheball.
A three-way ball valve is a multiport valve with three openingstowhichthepipesareconnected.Theseportsare describedasoneinletandtwooutlets,oroneoutletandtwo inletsdependingontherequiredapplication.
Theseportsintheballhelpthefluids,gases,andslurriesmix anddivertfrom
Completelyshutofftheflow.
Flow coming from one inlet can be split into two differentoutlets
The flow can be made to continuously flow in one directionwhileblockingtheoutlet.
Themainreasonforusing3-wayballvalvesforindustrial purposes is that3-way ball valves canmixanddiverttwo different fluids, which helps in changing physical and chemicalproperties.
Therearemainlytwopatternsinwhichthefluidina3-way ballvalvecanbemadetoflow.
L-type3-wayballvalve:Itisalsoknownasadivertervalve, astheflowtakesplacefromoneinletport whichisfixed, astheoutputofflowtakesplacefromeitheroftwooutlet ports located at 90° from the inlet on both the left and rightsides.So,inL-typeflow,theinletsideisfixed,butthe outputdirectiondependsonthepositionofthelever.The outward flow of water can be altered by adjusting the lever.
T-Type:ItisatypeofflowthatissimilartotheL-type,but heretheflowtakesplaceineithertype
1)Twoinlets,singleoutlet
2)Twooutlets,singleinlet
Two inlets, single outlet: In this type of flow, the water entersfromboththeinletswhichareinastraightlineand
International Research Journal of Engineering and Technology (IRJET) e-ISSN: 2395-0056
Volume: 11 Issue: 12 | Dec 2024 www.irjet.net p-ISSN: 2395-0072
theoutlet occurs attherightangle of both the inlets.This typeofflowiscalledamixerflow,wheretwoliquidscanalso bemixed,ortheirpropertiescanbecontrolled.
TwoOutlets,singleoutlet:Heretheflowofwaterisopposite totheabove-mentionedwherewater entersfroma single inletwhereasitexitsfrombothsides.So,thewaterenters andlaterturns 90° anddivergesonbothrightandleftsides, andthusthewaterexitsfromtwoports.Thisisusedwhena single source of liquid must be divided into two storage tanks.
MaterialComposition:Thebodyofa3-wayballismadeof materialslikestainlesssteel,brass,andbronzeorpolyvinyl chloride(PVC);itprovidesresistancefromcorrosion
Therearemanymaterialswithwhich3-wayballvalvesare made,butthemostusedmaterialsfor3-wayballvalvesare stainless steel and brass. Both materials have the same performance, but for high temperatures and pressures, stainlesssteelisarobustmaterialthatcanwithstandhigh temperatures and pressure. There are many grades and microstructures of stainless steel that can be used to manufacturea3-wayballvalve.Themostusedgradesare 304, 310, and 316. The most used microstructures are austenite,martensite,andduplexstructures.
310-grade stainless steel is compressed with a low concentrationofcarbon; itismadeupof25%chromiumand 20%nickel,whichhelpstoprovideresistancetocorrosion. 303-grade stainless steel is compressed with a low concentration of carbon; it is an alloy made up of 18% chromiumand8%nickel.
It is a graph, which is the representation of the relation between the two independent variables expressed in the Cartesiancoordinates.
In fluid machinery, the characteristics curve can be determined for turbines, pumps, and valves by using the parameters such as power (P), head (H), discharge (Q), percentage opening (%), and efficiency (η). It is a twodimensionalgraphthathasthepercentageofflowontheXaxis(abscissa)andhasefficiencypercentageontheY-axis (ordinate).
Inourcase,thecharacteristiccurveshowsusthebehavior and performance of the 3-way ball valve operated at differentratesofopeningsoftheisolationvalve(ie.,25%, 50%,75%,100%),whichinothertermsmeansthebehavior of the 3-way ball valve at different flow rates. To derive a simpleunderstanding,onecanpredict thebehaviorofthe valveatacertainflowifthecharacteristiccurveisknown.
Similarly, we can formulate the characteristic curve of different sizes of valves (ie., 2”, 2.5”, 3”, 4”) and obtain a
single combined graph that will exhibit the behavior and performanceofdifferentsizesofvalvesinasinglegraph.
With the help of the curve, we can also diagnose the deviations by comparing the ideal curve and the actual curve,whichhelpsustodeterminetheinefficiencies.Also,it indicatestherelationshipbetweentheoperatingconditions andperformanceparameters.[3]
UsesofCharacteristicCurve
1. To obtain a graphical representation of the performancecharacteristics.
2. To determine the ideal efficiency using the percentageofflow.
a. To analyze the flow and obtain an understanding of the ideal working conditions.
3. To compare the behavior of different sizes of valvesinasinglegraph.
4. Ithelpsin theselection of products depending onthedesiredperformancecharacteristics.
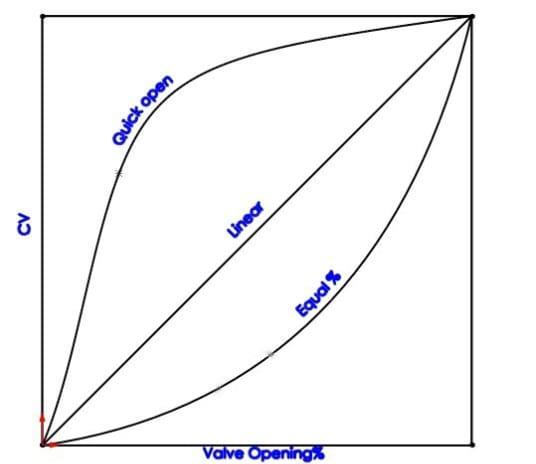
ClassificationofCharacteristiccurve
1. EqualPercentage
2. Linear
3. QuickOpening
Equal Percentage: It is a type of characteristic curve that represents the change of flow rate of a turbine, pump, or valveforthepercentageopeningorclosingoftheinputflow. Inotherwords,foranequalpercentageincreaseordecrease intheflowcontrolparameter,thereisanequalchangeinthe flowrateasexhibitedonthegraph
Linear: In this type of curve, the change occurs linearly (straightline)foreveryequalincrementordecrementinthe change of flow control; the change of flow rate is equal in amount.
Quick open: Here in this type of curve the valve, when opened is a significant surge in the flow rate which moderatesandlevelsoff,Herethevalveisopened,anditis observedthatthereisanimmediateriseinflowlevelsafter whichtheflowreturnstothenormallevel.[4]
International Research Journal of Engineering and Technology (IRJET) e-ISSN: 2395-0056
Volume: 11 Issue: 12 | Dec 2024 www.irjet.net p-ISSN: 2395-0072
2.2 Flow Coefficient (Cv) and Flow Factor (Kv)
FlowCoefficient(Cv): Itisa flowmeasurement parameter thatisusedtomeasuretheflowratethroughavalve.Itis definedastheamountofflowratetakingplaceinavalvein gallons per minute (GPM) with a pressure drop of 1PSI (PoundPerSquareInch).ItisrepresentedasCv.
Cv =Q*√(SG/ΔP)(unitsinUSGPM,psi).
FlowFactor(Kv):Itissimilartotheflowcoefficientbutin termsofmetricunits.Itisdefinedastheflowrateofwater through a valve in cubic meters per hour(m3/hr.) at a pressuredropof1bar.ItisrepresentedasKv.
Kv =Q*√(SG/ΔP)(unitsinm3/hr.,bar).
Both Cv and Kv are used for the selection of the valve dependingontheirflowcapacity.Thecharacteristicscurveis atoolforengineerstoselectavalvebasedontheirdesired requirements.
Usually,inthecaseofvalves,theCv isrepresentedontheY axisandtheKv isrepresentedontheXaxisandacurvecan be traced to the actual performance; this curve is a representationofthebehaviorcharacteristicsofthevalve. [4]
1) UltrasonicFlowMeterSpecificationsfora4-inchPipe: 1. PipeSize:4inches(100mm)diameter.
2. FlowRateRange:Appropriatefortheexpectedflow rates in the 4-inch pipe, e.g., 0 to 500 gallons per minute(GPM)or0to100cubicmetersperhour.
3. Accuracy: High accuracy, typically specified as a percentageofthemeasuredvalue,suchas±1%.
4. Fluid Type: Designed for the specific fluid in your application(e.g.,liquids,gases,oil).
5. Temperature Range: Suitable for the expected temperaturerangeofthefluidinthepipe,e.g.,-20°C to120°C(-4°Fto248°F).
6. Pressure Rating: Compatible with the pressure conditionsoftheapplication,specifiedinpoundsper squareinch(psi)orbars.
7. TransducerType: Dependingonthedesign,itmay useeitherclamp-onorinlinetransducers.
8. Power Supply: Specify voltage and frequency requirements.
9. CommunicationProtocol:Ifpartofalargersystem, specify the supported communication protocols (e.g.,Modbus,HART).
10.Environmental Conditions: Consider factors like ambient temperature, humidity, and protection againstdust/water(e.g.,IP65-rated).
WorkingPrinciple:
Ultrasonic flow meters use the transit-time or Doppler effect to measure the velocity of the fluid. The two main workingprinciplesare:
1. Transit-Time Principle: This method measures the time it takes for an ultrasonic signal to travel upstreamanddownstreambetweentransducers.The flow velocity can be determined by comparing the transittimes.
2. Doppler Principle: This method relies on the frequencyshift(Dopplershift)betweentheemitted andreceivedultrasonicsignals.Thefrequencyshift isproportionaltothefluidvelocity,allowingforthe calculationoftheflowrate.
Types:
1. Clamp-OnUltrasonicFlowMeter: External sensors clamp onto the outer side of the pipe, making installation and maintenance easy without disruptingtheflow.
2. Inline Ultrasonic Flow Meter: The transducers are inserteddirectlyintothepipe,providingcontinuous directmeasurements.
Technology/SensorUsed:
1. Transducers: Piezoelectric sensors are commonly used. They generate ultrasonic signals and receive reflectedsignals.
International Research Journal of Engineering and Technology (IRJET) e-ISSN: 2395-0056
Volume: 11 Issue: 12 | Dec 2024 www.irjet.net p-ISSN: 2395-0072
2. Signal Processing: Advanced signal processing techniques,suchasdigitalsignalprocessing(DSP), areemployedtoanalyzeandinterprettheultrasonic signals.
DerivedCalculationFormulas:
1. Transit-TimeMethod:
• Velocity of fluid (V) = Distance between transducers (D) / (Time for downstream travel+Timeforupstreamtravel)
• Flowrate(Q)=Cross-sectionalareaofthe pipe(A)*Velocity(V)
2. DopplerMethod:
• Doppler frequency shift (Δf) is related to fluidvelocity.
• Flowrate(Q)=Cross-sectionalareaofthe pipe(A)*Velocity(V)
These formulas provide the basis for calculating flow rates based on the measured parameters. Specific devices and manufacturersmayhavevariationsintheiralgorithmsand formulas.Alwaysrefertothemanufacturer'sdocumentation foraccurateandmodel-specificcalculationmethods.
2) DifferentialPressureGaugeSpecificationsfora4-inch Pipe:
1. PipeSize:4inches(100mm)diameter.
2. PressureRange:Suitablefortheexpecteddifferential pressureinthe4-inchpipe(e.g.,0to100psi)
3. Accuracy: High accuracy, often specified as a percentageofthemeasuredvalue,suchas±1%.
4. Fluid Type: Designed for the specific fluid in your application(e.g.,liquids,gases).
5. Temperature Range: Suitable for the expected temperaturerangeofthefluidinthepipe,e.g.,-20°C to120°C(-4°Fto248°F).
6. PressureConnectionTypeandSize:Compatiblewith thepipe'sconnectiontype(e.g.,NPT,BSP)andsize.
7. MountingType:Choosebetweenthebottommount, back mount, or panel mount based on installation requirements.
8. Material Construction: Constructed from materials compatible with the fluid and suitable for the environmentalconditions.
9. Environmental Protection: Consider factors like weatherproof or hermetically sealed cases if the gaugewillbeexposedtoharshconditions.
WorkingPrinciple:
Differentialpressuregaugesmeasurethedifferencein pressurebetweentwopointsinasystem.Thebasicworking principle involves a sensing element that responds to the pressuredifference,causingadisplacementordeformation thatisthentranslatedintoareadablepressurevalue.
Types:
1. Diaphragm-typeDifferentialPressureGauge:Usesa diaphragm as the sensing element. The pressure difference causes deflection, and this deflection is translatedintoapressurereading.
2. Bourdon Tube-type Differential Pressure Gauge: Utilizes a Bourdon tube as the sensing element. Differentialpressurecausesthetubetodeform,and themovementisconvertedintoapressurereading.
Technology/SensorUsed:
1. Diaphragm-typeSensors:Madefrommaterialssuch asstainlesssteelorotheralloys.
2. Bourdon Tube Sensors: Typically made from materialslikebronzeorstainlesssteel.
DerivedCalculationFormulas:
The formula to calculate differential pressure (ΔP) is straightforward:
ΔP=P1−P2
Where:
• ΔPisthedifferentialpressure.
• P1isthepressureatthefirstpoint.
• P2isthepressureatthesecondpoint.
Thisbasicformularepresentsthepressuredifferencethatthe differentialpressuregaugemeasures.Thegaugeiscalibrated to provide a direct reading of this differential pressure. Alwaysrefertothespecific productdocumentationforany correctionsoradjustmentsneededforaccuratereadings.
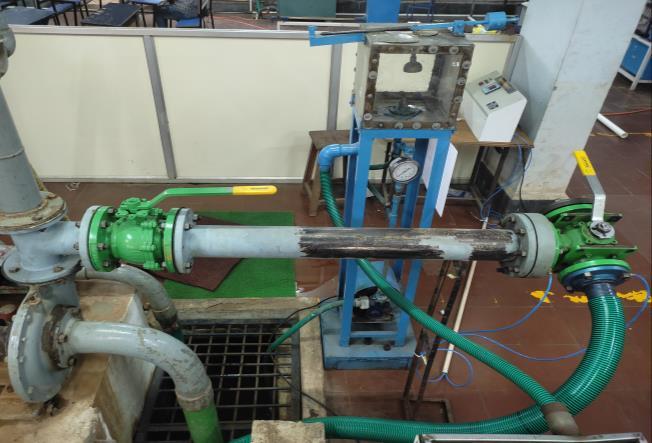
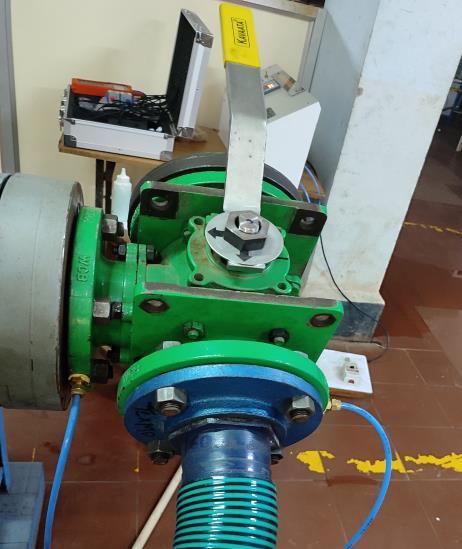
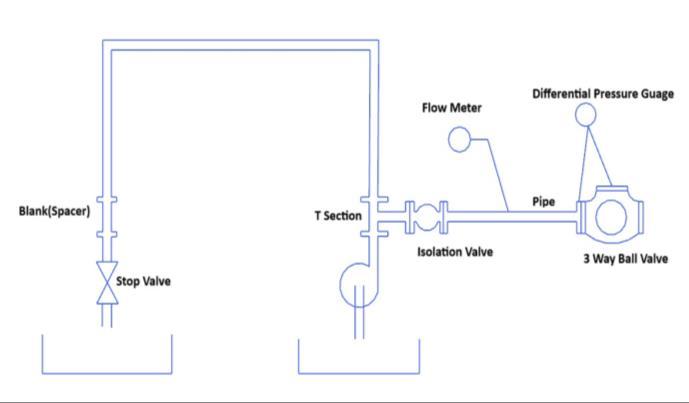
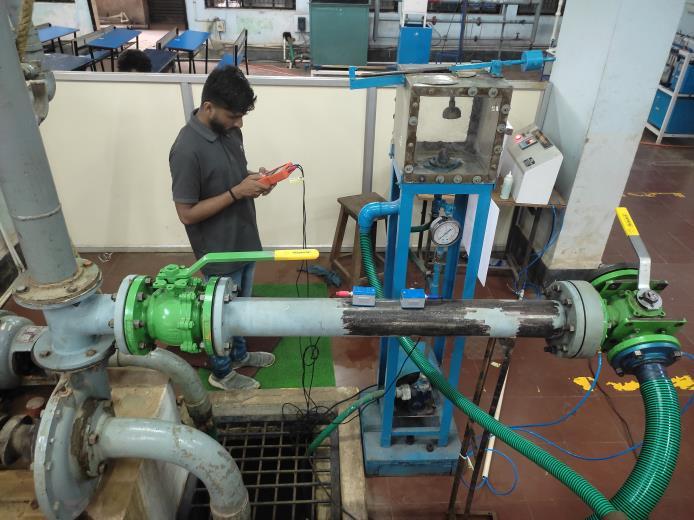
To test the performance of the 3-way ball valve and determinethecharacteristicscurve,wefabricateasetupthat canservethispurpose.BelowisFigure3.1.7,oftheexisting Francis turbine setup in which we make alterations and introduceablank(spacer)andaTeesectiontodiverttheflow. Also,showninthefigureweseeatwo-wayballvalvewhich servesasacontrolvalvetoopenandclosetheflowofwater tothefurthersetup.
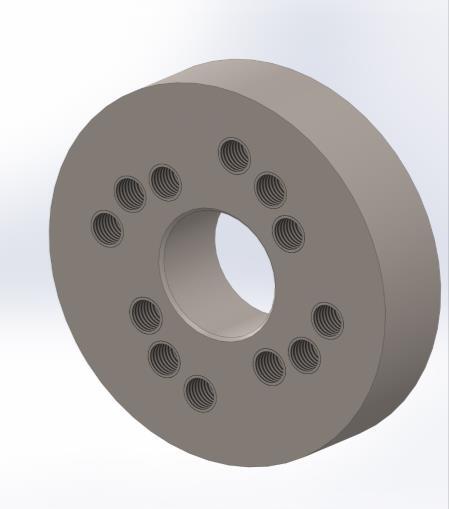
Later,apipeismountedtothetwo-wayvalvewhichislater connectedtoahubandthentothethree-wayballvalve(test valve).Herethehubisintroducedbetweenthepipeandthe valvetofacilitatetestingofmultiplesizesofvalveinthesame setup.
International Research Journal of Engineering and Technology (IRJET) e-ISSN: 2395-0056
Volume: 11 Issue: 12 | Dec 2024 www.irjet.net p-ISSN: 2395-0072
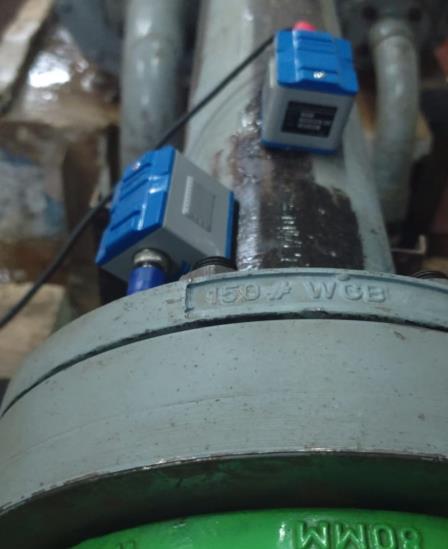
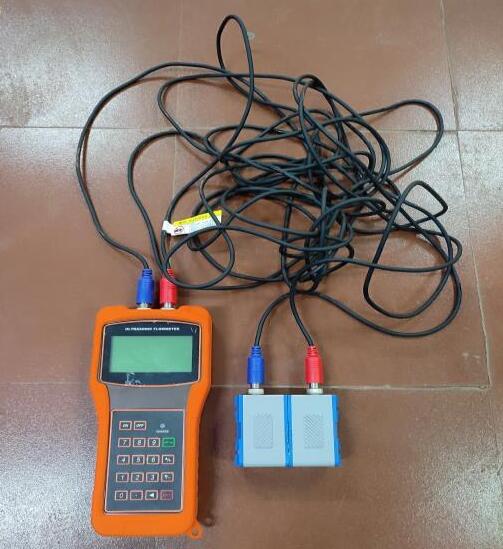
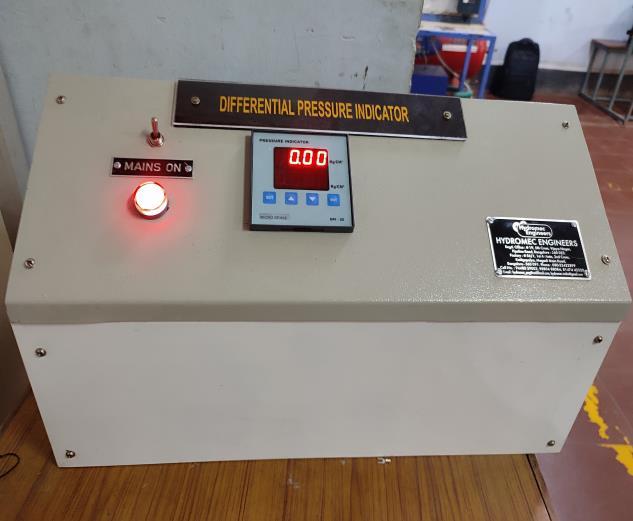
Theultrasonicflowmetersensorismountedonthelongpipe asshowninFigure3.1.2,whichisconnectedtothemeteras showninFigure 3.1.5. The differential pressure gauge has twoports(inletandoutlet),whicharemountedontheinlet andoutletflangesofthethree-wayballvalveshowninFigure 3.1.4,whichisusedtofindthepressuredropandindividual pressurereadings,whicharedisplayedonthemetershown infigure3.1.6 [1]
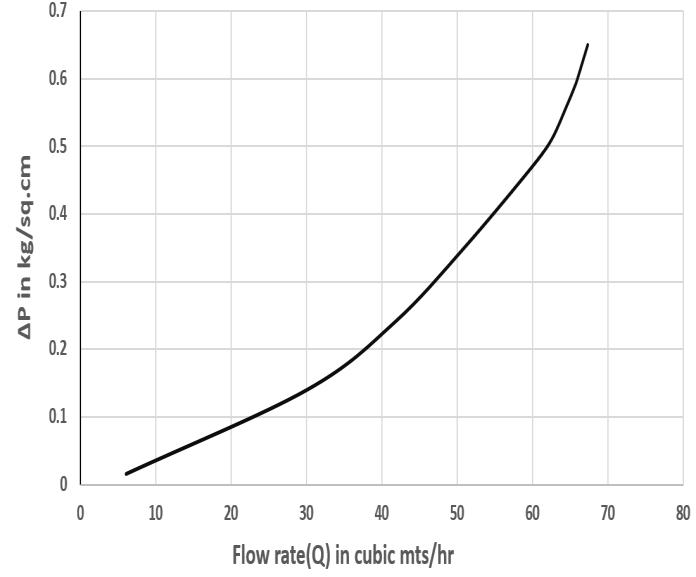
Afterthearrangementofthesame,thesetupisrunfor10 minutestoachieveasteadyflowcondition,afterwhichthe readingsaretaken.Thethree-wayballvalveisthenopened at different rates of openings, such as 10, 20, and 30 until 100%,forwhichwenotetheflowrateandthepressuredrop from both meters respectively. A tabular column is plotted using the following parameters: Percentage valve opening, Flow rate, and Pressure drop. Using this we plot the characteristicscurveinwhichthex-axisofthegraphisFlow Rate(Q)inmt^3/hr.andthey-axisisPressureDrop(ΔP)in kg/mt^3[2].
International Research Journal of Engineering and Technology (IRJET) e-ISSN: 2395-0056
Volume: 11 Issue: 12 | Dec 2024 www.irjet.net p-ISSN: 2395-0072
International Research Journal of Engineering and Technology (IRJET) e-ISSN: 2395-0056
Volume: 11 Issue: 12 | Dec 2024 www.irjet.net p-ISSN: 2395-0072
Table -1: Observation table for 2inch L-port Hollow ball
Observation Table
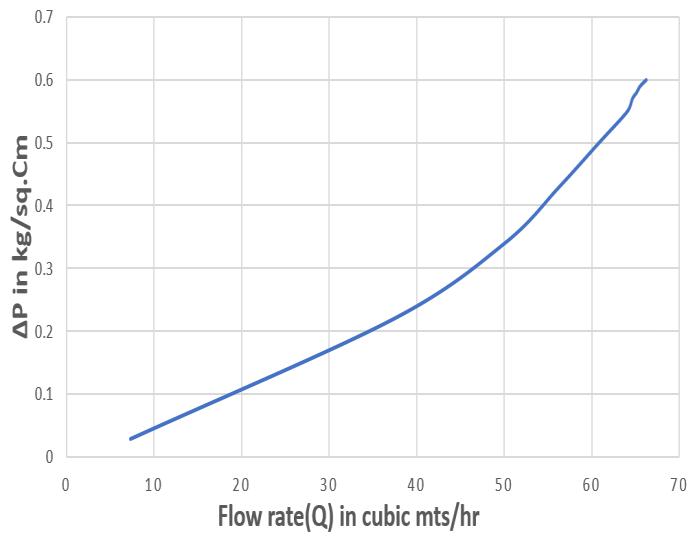
4.1 Characteristics Curve of 2" 3way L-port Ball Valve (Hallow)
Table -2: Observation table for 2inch L-port Solid ball
Observation Table
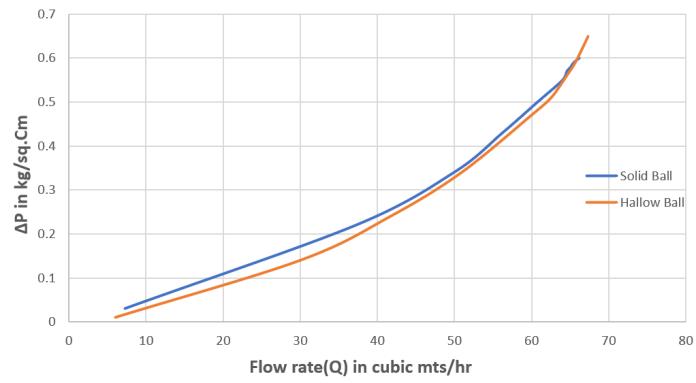
Table -3: Observation table for 3inch L-port ball valve
Observation Table
International Research Journal of Engineering and Technology (IRJET) e-ISSN: 2395-0056
Volume: 11 Issue: 12 | Dec 2024 www.irjet.net p-ISSN: 2395-0072
[4] Hyo-Lim Kang, Hyung-Joon Park and Seung-Ho Han, “InvestigationoftheFlowCharacteristicsforCylinderin-BallValveDuetoaChangeintheOpeningRate”,2022
BIOGRAPHIES

5. CONCLUSION
Wederivetheconclusionfromtheaboveentirepaperand throughtheexperimentationsetupthatastheopeningrate of the valve increases, the flow rate (Q) and the pressure drop(ΔP)increase.
ACKNOWLEDGEMENT
The authors express their gratitude to the Management, Principal, and Head of Department (H.O.D) Mechanical EngineeringofK.L.S GogteInstituteofTechnology,Belagavi, Karnataka, and Rajeev and Company Devarwadi, Maharashtra, for their immense support and motivation. SpecialgratitudetoProf MaheshSattigeriandMr.Rajeev.B. Nerlagunte for their expertise, guidance, and supervision throughout the entire process. We are thankful to Mr. Rajeev.B. Nerlagunte for his constant motivation and enthusiasm in imparting us knowledge through practical application. We would also like to thank the staff of both organizations.
[1] Jian-Xin Wnag & Feng-Xun Li,” Flow analysis and performanceoptimizationofafour-wayballvalve”,2020
[2] VishalAndhale&Deshmukh,“InvestigationofBallValve DesignforPerformanceEnhancement”,2016.
[3] AnthonyLeeJatcko,“Analysisoftheflowcharacteristics throughawaterpressureregulator”,1965


AnantbhatSachinNarayan
AkileshUmeshRevankar
EnriqDsouza
GourishKatti
MaheshSattigeri
Rajeev.B Nerlagunte