
International Research Journal of Engineering and Technology (IRJET) e-ISSN: 2395-0056
Volume: 11 Issue: 06 | Jun 2024 www.irjet.net
p-ISSN: 2395-0072


International Research Journal of Engineering and Technology (IRJET) e-ISSN: 2395-0056
Volume: 11 Issue: 06 | Jun 2024 www.irjet.net
p-ISSN: 2395-0072
Diya Sundar1 , Yashaswini K1 , Parimal Kumar K R2
1Student, Department Of Masters Of Computer Application, Vidya Vikas Institute Of Engineering & Technology Mysore, Mysuru, Karnataka, India.
2Assistant Professor, Department Of Masters Of Computer Application, Vidya Vikas Institute Of Engineering &
Abstract - Understanding the relationship between relative humidity, temperature, and rainfall patterns is essential for effective climate analysis and prediction in Mysuru, a region characterized by its subtropical climate. This study aims to investigate the intricate interplay between these meteorological variables and their influence on rain patterns in Mysuru.
Utilizing historical data sourced from meteorological stations and agencies, we conducted a comprehensive analysis of temperature, relative humidity, and rainfall records spanning multiple years. The dataset was subjected to rigorous preprocessing techniques to ensure data quality and consistency.
Our analysis revealed significant correlations between relative humidity, temperature, and rainfall in Mysuru. We observed that higher relative humidity levels, coupled with lower temperatures, were associated with increased likelihoods of rainfall occurrences. Conversely, periods of low relative humidity and high temperatures corresponded to drier conditions with reduced rainfall activity.
Key Words: Temperature, Relative Humidity, Rainfall pattern
Mysuru, a city nestled in the southern region of India, experiences a diverse climate characterized by distinct seasons. The monsoon season, typically from June to September,bringsthemajorityofthecity'sannualrainfall. Understanding the intricate relationship between temperature, relative humidity, and rainfall patterns is crucialforeffectiveweatherpredictionandwaterresource managementinMysuru.
Temperature and relative humidity are fundamental meteorological variables influencing atmospheric dynamics andprecipitationprocesses.Inthisanalysis,wedelveinto thehistoricaldataoftemperatureandrelativehumidityto developapredictivemodelforrainfallinMysuru.
Byexaminingthepatternsandfluctuationsintemperature and relative humidity data over time, we aim to uncover correlations and trends that can provide insights into the onset,intensity,anddurationof rainfallevents.Additionally, we seek to identify potential leading indicators in
temperature and humidity variations that precede significantrainfalleventsintheregion.
The findingsof thisanalysishold significantimplicationsfor varioussectors,includingagriculture,urbanplanning,and disaster preparedness. Accurate rainfall predictions can aid farmers in crop planning and irrigation scheduling, help urbanplannersmanagedrainagesystemsandfloodrisk,and enable authorities to implement timely measures for mitigatingtheimpactofextremeweatherevents.
Inthesubsequentsectionsofthisstudy,wewilldiscussthe methodology employed for data collection and analysis, presenttheresultsofourfindings.
Utilizing advanced meteorological models, our aim is to analyzetemperatureandrelativehumiditydataforMysuru region. By correlating these variables with historical rainfall patterns,weseektodevelopapredictivemodelforrainfall occurrencesinthearea.Throughmeticulousdataanalysis and machine learning algorithms,we aimto forecastrainfall with increased accuracy, aiding local authorities and residents in preparedness and planning. This endeavor is crucialforenhancingearlywarningsystemsandmitigating potentialrisksassociatedwithvaryingprecipitationlevelsin Mysuru.Ultimately,ourgoalistocontributetomoreeffective waterresourcemanagementandsustainabledevelopment practicesintheregion.
Sample To collect daily data on temperature and relative humidity in Mysuru for the year 2023 and analyze the relationship between relative humidity and temperature, identifyingconditionsofhighandlowtemperaturebased on relative humidity levels.Ensure the systematic collection of daily data throughout the year 2023, coveringdifferentseasonsandclimaticvariations.
Conductthoroughqualitychecksandvalidation procedures to ensure the reliability and consistencyofthecollecteddata.
Utilize statistical analysis techniques to examine the correlation between relative humidity and temperature,identifyingpatternsandtrends.

Volume: 11 Issue: 06 | Jun 2024 www.irjet.net
International Research Journal of Engineering and Technology (IRJET) e-ISSN: 2395-0056 p-ISSN: 2395-0072
Determinetherelativehumiditylevelsatwhich temperatures tend to be high, indicating conditionsofheatstressordiscomfort.
Identify the threshold relative humidity levels associatedwithlowertemperatures,indicativeof morecomfortableorcoolerclimaticconditions.
Provide insights and recommendations for policymakers, urban planners, and stakeholders to enhance climate resilience and adaptability in Mysuru.
Theexistingsystemfortemperatureandrelativehumidity analysis in Mysuru to predict rainfall relies heavily on traditional meteorological methods. It involves the use of weather stations equipped with sensors to measure temperature and humidity levels at specific locations across thecity.Theseweatherstationstransmitreal-timedatato centralized meteorological centers for analysis and forecasting. Historical weather data collected over time is utilized to identify patterns and correlations between temperature, humidity, and rainfall. Meteorologists employ statistical models and algorithms to extrapolate future weatherconditionsbasedon thesepatternsandhistorical trends.However,the accuracy of predictionsmay be limited byfactorssuchasthespatialdistributionofweatherstations andthecomplexityoflocalweatherphenomena.
AproposedsystemforTemperatureandrelativehumidityin Mysuruusingdataanalyticswouldaimtoaddresssomeof the limitations of the existing system. Here are some potentialfeaturesofsuchasystem:
•Integrated Workflow: Matplotlib, Seaborn, and Pandas provide a comprehensive set of tools for data analysis, visualization, and modeling. Their seamless integration allows for a streamlined workflow from data preprocessing tomodelevaluationandvisualization.
•Flexible Data Manipulation: Pandas offers powerful data manipulation capabilities, enabling easy handling of timeseries data, missing values, and feature engineering. This flexibility allows researchers to prepare the data effectively foranalysisandmodeling.
•Rich Visualization Options: MatplotlibandSeabornoffera wide range of visualization techniques for exploring relationships between variables, identifying patterns, and communicating insights. These libraries allow for the creation of visually appealing and informative plots, facilitatingbetterunderstandingofthedata.
•Statistical Insights: Seaborn provides built-in statistical functions and visualization tools that aid in exploring the relationshipsbetweentemperature,relativehumidity,and rainfall. These functions help uncover patterns, correlations, and trends in the data, providing valuable insights for analysisandinterpretation.
•Efficient Model Evaluation: WiththehelpofScikit-learn, researchers can easily evaluate the performance of predictivemodels using various metrics suchas accuracy, precision, recall, and F1-score. This enables objective assessmentofthemodel'seffectivenessinpredicting rainfall occurrence.
•Scalability and Reproducibility: Theproposedsystemis scalableandcanbeadaptedtoanalyzedatafromdifferent locationsandtimeperiods.Additionally,usingPython-based libraries ensures reproducibility, allowing researchers to share their code and analyseswithothersfor validation and furtherexploration.
•Data Collection: Gather data from various sources such as databases, files (CSV, Excel, JSON), APIs, web scraping, or streaming services. Use libraries like pandas, NumPy, or requeststoimportandloadthedataintoPython.
•Data Cleaning and Preprocessing: Handle missing values by imputation, deletion, or interpolation. Remove duplicates and irrelevant columns. Convert data types, standardize formats,andhandleoutliers.Normalizeorscalenumerical featuresifneeded.
•Exploratory Data Analysis (EDA): Explorethedatasetto understand its structure, distribution, and relationships betweenvariables.Usedescriptivestatistics,histograms,box plots,andcorrelationmatricestosummarizeandvisualize thedata.
•Feature Selection and Dimensionality Reduction: Select relevantfeaturesthathaveasignificantimpactonthetarget variable.
•Visualization: Visualizetheresultsofdataanalysisusing libraries like matplotlib, seaborn, or plot. Create plots, charts, histograms, heatmaps, and interactive visualizations tocommunicateinsightseffectively.
5.1 Dataset
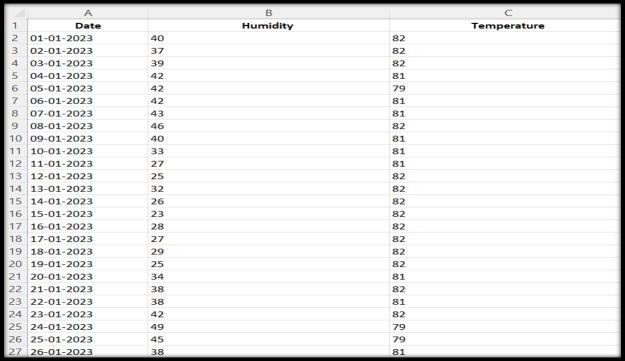
Datasetisincsvformattakenfromworld-weather.info website.

International Research Journal of Engineering and Technology (IRJET) e-ISSN: 2395-0056
Volume: 11 Issue: 06 | Jun 2024 www.irjet.net
Plotting Line Graph to show the Temperature and Relative Humidity Distribution
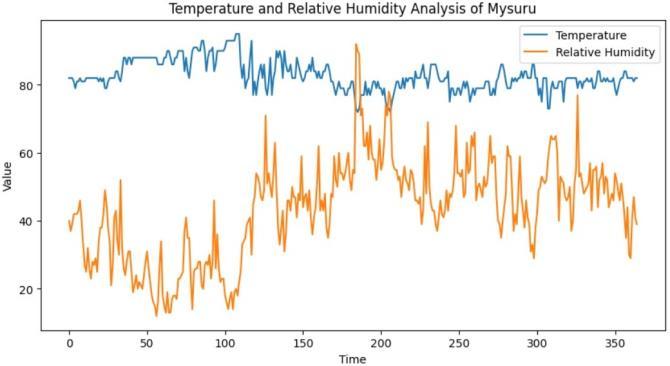
Fig -2:LinePlot
PlottingthescatterplotforTemperaturevsRelativehumidity ofMysuru.
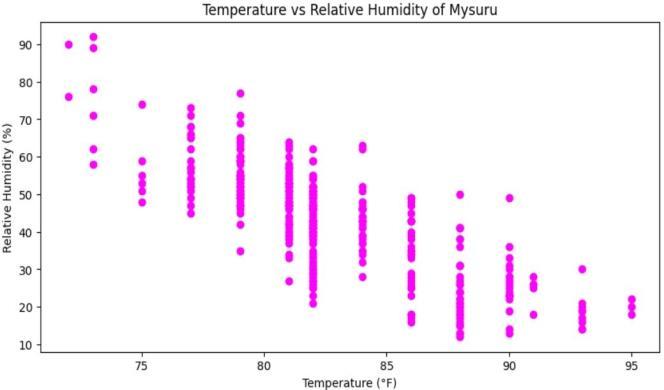
Fig -3:ScatterPlot
Plotting linegraph to compare Temperature and Relative HumidityoverTime
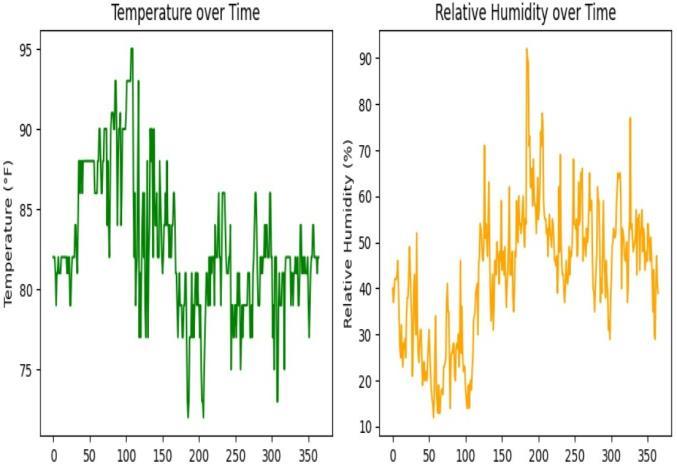
Fig -4:LinePlot
p-ISSN: 2395-0072
HistogramPlotoftemperatureandRelativeHumiditytofind outdistributionoverfrequency.
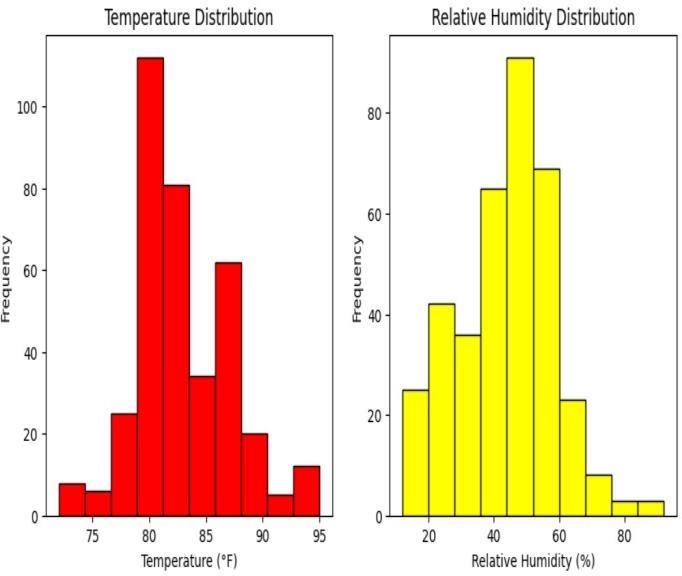
Fig -5:Histogram
LinePlotofTemperatureandRelativeHumidityvsmean TemperatureandRelativeHumidityvaluesofMysuru.
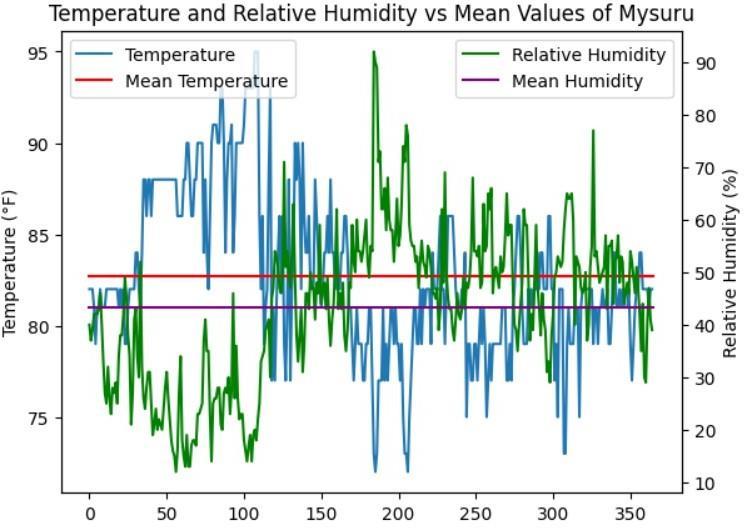
Fig -6:LinePlot
Line Plot of Temperature Vs Maximum & Minimum Temperature and Relative Humidity Vs Maximum & MinimumRelativeHumidityofMysuru.
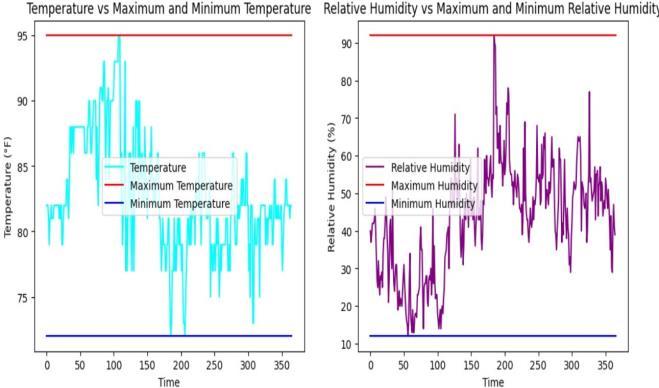
Fig -7:LinePlot

Volume: 11 Issue: 06 | Jun 2024 www.irjet.net
International Research Journal of Engineering and Technology (IRJET) e-ISSN: 2395-0056 p-ISSN: 2395-0072
Box Plot forComparison of Temperature and Relative HumidityofMysuru.
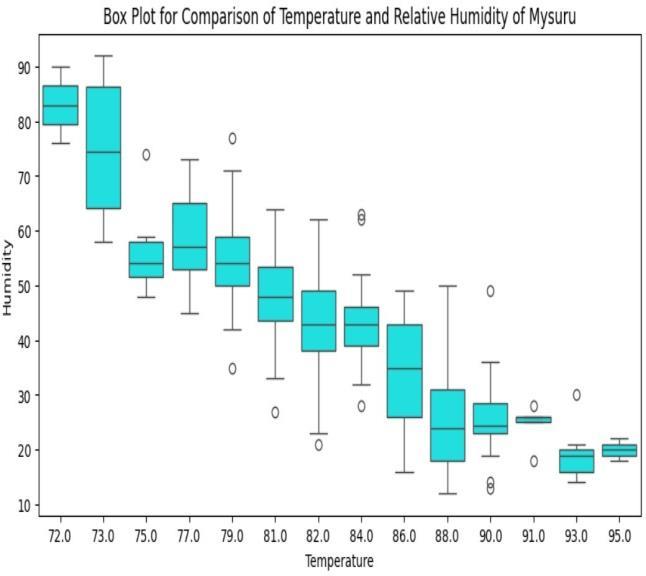
Fig -8:BoxPlot
Violin Plot for Comparison of Temperature and Relative HumidityofMysuru.
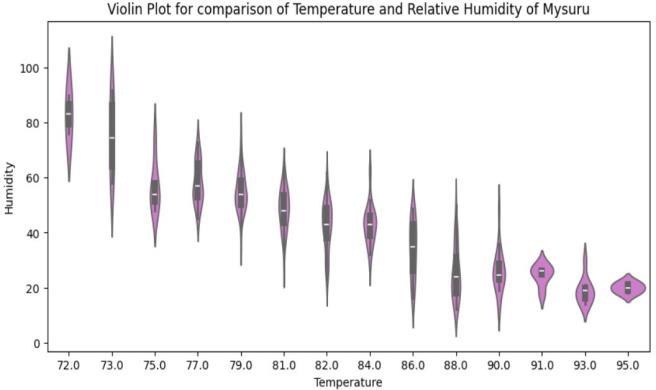
Fig -9:ViolinPlot
In Mysuru city, the correlation between higher relative humidity and lower temperature often leads to rainfall events. As relative humidity rises, indicating increased moisture in the air, and temperatures decrease, the atmospheric conditions become conducive to the formation of cloudsand precipitation.Thisphenomenonisparticularly pronounced during the monsoon season when elevated humiditylevels,coupledwithcoolertemperatures,createan environment primed for rainfall. Understanding this relationship is essential for predicting rain patterns and preparing for the impacts of precipitation in Mysuru, influencing various aspects of daily life, including agriculture, water resource management, and urban planning.
1. Dataset-https://world-weather.info/
2. Tiwari, I. et al.- Climate change impacts on the health of South Asian children and women subpopulations: A scopingreview. Heliyon 8,e10811(2022).
3. Jain, S. K. & Kumar, V. -Trend analysis of rainfall and temperaturedataforIndia. Curr. Sci. 102,37–49(2012).
4. Zhou, Y. et al. -The role of extreme high humidex in depression in chongqing, China: A time seriesanalysis. Environ. Res. 222,115400(2023).