
International Research Journal of Engineering and Technology (IRJET) e-ISSN:2395-0056


International Research Journal of Engineering and Technology (IRJET) e-ISSN:2395-0056
Prof. Jawalkar G.C., Yogesh Sanjay Pawar, Prof. Badeghar R.R.
Department of civil Engineering, N.B. Navale sinhgad College of Engineering, Solapur, India.
ABSTRACT: Nowadays The repair of a structure or its element has always been very difficult, and adequate solutions have often entailed extensive works. Specialized techniques of strengthening, stiffingandrepair are needed to deal with damaged structural elements due to fire, earthquake, foundation movement, impact and overload. Many existing bridges, industrial structures, urban transport structures, marine structures and earth retaining structures are in need of repair or upgrade. During the service life due to many reasons the reinforced concrete structures have to face some modifications and improvements. In such case there are two possible solutions: replacing or retrofitting. Replacing of whole structures causes disadvantages like high costs for labor and material. So, without replacing the complete structure, if is desirable to repair it or upgrade it by using retrofittingtechniquesifpossibleandfeasible.
In this study a G+20 storey building model of Existing building structure without retrofitting, Deteriorated building structure and Retrofitted building structure by considering percentage variation in deterioration and retrofication of overall building structure is taken into account and the analysis is carried out by using response spectrumanalysis.
The analysis and comparison of Existing building without retrofitting with Deteriorated building structure and Retrofitted building structure by considering percentage variation in deterioration and retrofication at different locations of overall building structure by applying various methods of retrofitting are studied to investigate the seismicbehaviorofhigh-risebuilding.
Codesreferred: IS456:2000,IS1893:2016
Keywords: Retrofitting, Displacement, Response SpectrumAnalysis,ShearWall,Jacketing,
Thisproposedworkisfocusedon:
StudyofRetrofittingofBuilding.
Analysis of multistoried building without Retrofitting.
Analysis of multistoried building with various methodsofRetrofitting.
Study of structural behavior of building by applying various methods of Retrofitting at different location ofbuilding.
Volume: 11 Issue: 06 | Jun 2024 www.irjet.net p-ISSN:2395-0072 © 2024, IRJET | Impact Factor value: 8.226 | ISO 9001:2008 Certified Journal | Page1153
Comparison of results for various methods of Retrofitting.
Deterioration of concrete structure is a worldwide problem. The reasons behind this are many, likeoccurrence of natural hazards like earthquakes, lack of awareness of several important codal provisions in construction, poor quality of supervision etc... These factors lead to strength deficient structures. Sometimes, overloading of structures leads to excessive deformations and corrosion which need considerable attentiontoday.
Toovercomealltheseeffectsonreinforcedconcrete structures: repair, retrofitting or strengthening are regularly required activities in construction field today. The damages caused by all of these possible ways will requirevarietyofpossiblerepairtechniques,fromwhich mosteffectiveonewillbechosenineachparticularcase. Insomecases,evennewlybuiltstructuresrequire,repair and strengthening so as to eliminate defects due to mistakesindesignorconstruction.
The repair of concrete structure or its element has always been very difficult, and adequate solutions have oftenentailedextensiveworks.Specializedtechniquesof strengthening,stiffingandrepairareneededtodealwith damaged structural elements due to unusual event such as fire, earthquake, foundation movement, impact and overload. Many existing bridges, industrial structures, urban transport structures, marine structures and earth retaining structures are in need of repair or upgrade. During the service life due to many reasons the reinforced concrete structures have to face some modificationsandimprovements. Insuchcasethereare two possible solutions: replacing or retrofitting. Replacing of whole structures causes disadvantages like high costs for labor and material. So, without replacing thewholestructure,ifisdesirabletorepairitorupgrade itbyretrofittingifpossibleandfeasible.
“Retrofit” means the use of new innovations to a more seasoned system. Retrofitting is the process of adding some new elements to a structure that were not there previously. It is the method of changing or repairing something after it has been made. There are different retrofitting techniques for RCC buildings. The

International Research Journal of Engineering and Technology (IRJET) e-ISSN:2395-0056
Volume: 11 Issue: 06 | Jun 2024 www.irjet.net p-ISSN:2395-0072
retrofitting techniques for RCC buildings are generally classifiedintotwocategories,suchas,Globalretrofitting techniquesandLocalretrofittingtechniques.
It is the method of changing or repairing and modifyingsomethingafterithasbeenmade.Retrofitting ofbuildingsisneededforthehousesthatareinfluenced by disappointments and harmed by seismic forces. Retrofitting of structures implies making changes to an existing structure so as to protect it from flooding or differenthazardslikeearthquakes,highwinds,etc.
Retrofittingabuildingincludeschangingitsstructures or systems after its initial construction. This work can further develop conveniences for the building’s occupantsandwork onthe performanceofthe building. As technology develops, the retrofitting of buildings can essentiallydecreaseenergyandwaterutilization.
Methods of Retrofitting
AddingSteelBracing
Jacketing Method
ExternalPlateBonding
BaseIsolationTechnique
MassReductionTechnique
WallThickeningTechnique
FiberReinforcedPolymer(FRP)
Adding Shear Wall
EpoxyInjectionMethod
SectionEnlargingReinforcingMethod

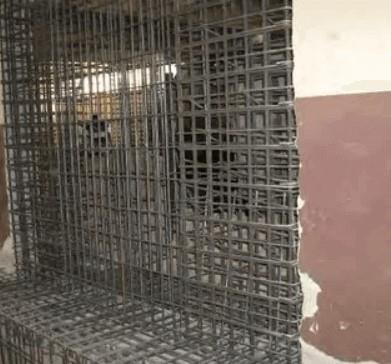
2.1
Some of the need for retrofitting are as mentioned below:
1) It is necessary for maintenance of structural cracksandstructuralmembersdamages.
2) Itisused to correct the errorinconstruction or design.
3) It assures the safety and security of a building, structure functionality, employees, inventory andmachinery.
4) To reconstruct the structure by using various retrofitting techniques for the advantages of excessiveloading.
5) To reconstruct and provide stability to the structure against the damages caused by the seismichazard.
The retrofitting of concrete structures has become increasingly important in view aging and more deterioration of infrastructure. The problem is more severe due to optimized technologies for construction. Many expansive methods are available for retrofit ting structures and choice of suitable method/material is a challenge to a structural engineer. Retrofitting is the Science and Technology of strengthening the existing structures or structural elements to enhance their performance with new technology, features and components. Retrofitting of an existing reinforced concrete structure includes either repair, rehabilitation (or)strengtheningterms.Thetermretrofitisusedif the damaged structure performance was satisfying than before with some additional resistance then the term retrofit will berepresentative.

International Research Journal of Engineering and Technology (IRJET) e-ISSN:2395-0056
Volume: 11 Issue: 06 | Jun 2024 www.irjet.net p-ISSN:2395-0072
The goals of seismic retrofit refer to the actions to be takenwith reference to the attributes forseismic design, inqualitativeterms.Theycanbesummarizedasfollows:
1) To increase the lateral strength and stiffness of thestructure.
2) To increase the ductility in the behavior of the structure,thisaimstoavoidthebrittlemodesof failure.
3) To increase the integral action and continuity of themembersinastructure.
4) To eliminate or reduce the effects of irregularitiesinthestructure.
5) To enhance redundancy in the lateral load resisting system, this aims to eliminate the possibility of progressive collapse of the structure.
6) Toensureadequatestabilityagainstoverturning andslidingcausedduetoseismicforces.
Taking into the consideration the need and objectives of dissertation,
1) A G+20 storey building model of Existing building structure without retrofitting, Deteriorated building structure and Retrofitted building structure by considering percentage variation in deterioration and retrofication of overall building structure is taken into account andtheanalysisiscarriedoutbyusingresponse spectrumanalysis.
2) Considering earthquakeloadsasloadingfor the structure according to Indian standards, IS 1893:2016byusingstructuralanalysissoftware.
3) TheanalysisofdisplacementevaluatedforG+20 storey building model of Existing building structure without retrofitting, Deteriorated building structure and Retrofitted building structurebyconsideringpercentagevariationin deterioration and retrofication of overall buildingstructureisinvestigated.
4) The analysis and comparison of Existing building without retrofitting with Deteriorated building structure and Retrofitted building structurebyconsideringpercentagevariationin deterioration and retrofication at different locations of overall building structure by applying various methods of retrofitting are studied to investigate the seismic behavior of high-risebuilding.
5) For the analysis and comparison of Existing building without retrofitting with Deteriorated building structure and Retrofitted building structurebyconsideringpercentagevariationin deterioration and retrofication at different locations of overall building structure by applying various methods of retrofitting the seismicresponsedisplacement,drift,andStorey shearareevaluated.
This study based on response spectrum analysis of a G+20 storey building model of Existing building structure without retrofitting. The work presented in this report is seismic analysis of Existing building withoutretrofittingwithDeterioratedbuildingstructure and Retrofitted building structure by considering percentagevariationindeteriorationandretroficationat different locations of overall building structure by applying various methods of retrofitting using seismic analysis software by considering earthquake loads accordingtoIndianstandard,IS1893:2016andresponse spectrum analysis. Computational model for validation casetakenfromreferenceandbuildingismodeledasper IS 456:2000 and IS 1893:2016 in structural analysis software.
Mainly, eleven case studies have been chosen for the seismic retrofittingofhigh-risebuildingusingstructural analysissoftwarearegivenbelow,
Case 1: Model of Existing building
To analyze the high-rise building without retrofitting a G+20 storey building model is selected and analyzed in structural analysis software using response spectrum analysis. The seismic response such as Displacement, DriftandStoreysheararediscussed.
Case 2: Model of 18.36 % Deteriorated building
In this model 18.36 % deterioration is considered of overall existing building model. and analyzed in structural analysis software using response spectrum analysis. The results of analysis of Displacement are discussed.
Case 3: Model of 51.02 % Deteriorated building
In this model 51.02 % deterioration is considered of overall existing building model. and analyzed in structural analysis software using response spectrum analysis. The results of analysis of Displacement are discussed.
Case 4: Model of 100% Deteriorated building
In this model 100 % deterioration is considered of overall existing building model. and analyzed in structural analysis software using response spectrum

International Research Journal of Engineering and Technology (IRJET) e-ISSN:2395-0056
Volume: 11 Issue: 06 | Jun 2024 www.irjet.net p-ISSN:2395-0072
analysis. The results of analysis of Displacement are discussed.
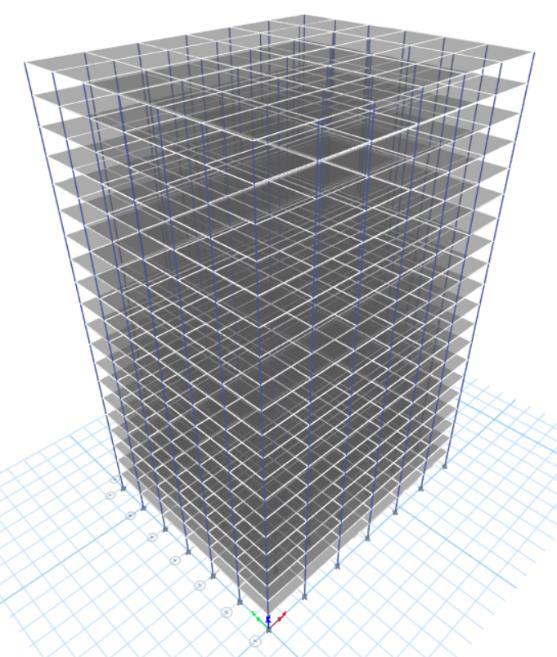
Case 5: Model of 18.36 % Retrofitted building using jacketing
In this model 18.36 % Retrofitting using jacketing is of overall existing building model. and analyzed in structural analysis software using response spectrum analysis. The results of analysis of Displacement are discussed.
Case 6: Model of 51.02 % Retrofitted building using jacketing
In this model 51.02 % Retrofitting using jacketing is of overall existing building model. and analyzed in structural analysis software using response spectrum analysis. The results of analysis of Displacement are discussed.
Case 7: Model of 100 % Retrofitted building using jacketing
In this model 100 % Retrofitting using jacketing is of overall existing building model. and analyzed in structural analysis software using response spectrum analysis. The results of analysis of Displacement are discussed.
Case 8: Model of 18.36 % Retrofitted building using Shear wall
Inthismodel 18.36%Retrofittingusing Shear wall isof overall existing building model. and analyzed in structural analysis software using response spectrum analysis. The results of analysis of Displacement are discussed.
Case 9: Model of 51.02 % Retrofitted building using Shear wall
Inthismodel 51.02%Retrofittingusing Shear wall isof overall existing building model. and analyzed in structural analysis software using response spectrum analysis. The results of analysis of Displacement are discussed.
Case 10: Model of 100 % Retrofitted building using Shear wall
In this model 100 % Retrofitting using Shear wall is of overall existing building model. and analyzed in structural analysis software using response spectrum analysis. The results of analysis of Displacement are discussed.
AcomparativestudybetweenExisting buildingwithout retrofitting with Deteriorated building structure and Retrofittedbuildingstructurebyconsidering percentage variation in deterioration and retrofication at different locations of overall building structure by applying various methods of retrofitting using seismic analysis software. The results of analysis of Displacement are evaluated.
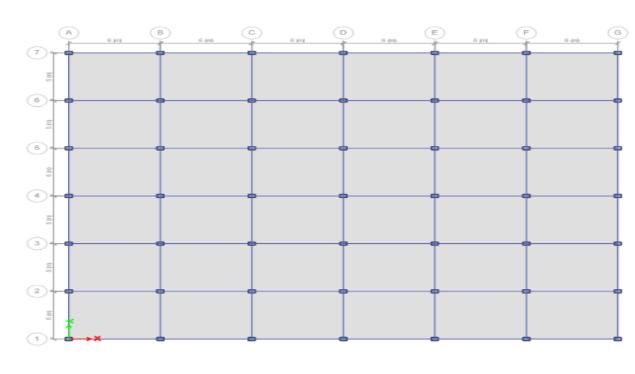
Fig 3.1 PLAN
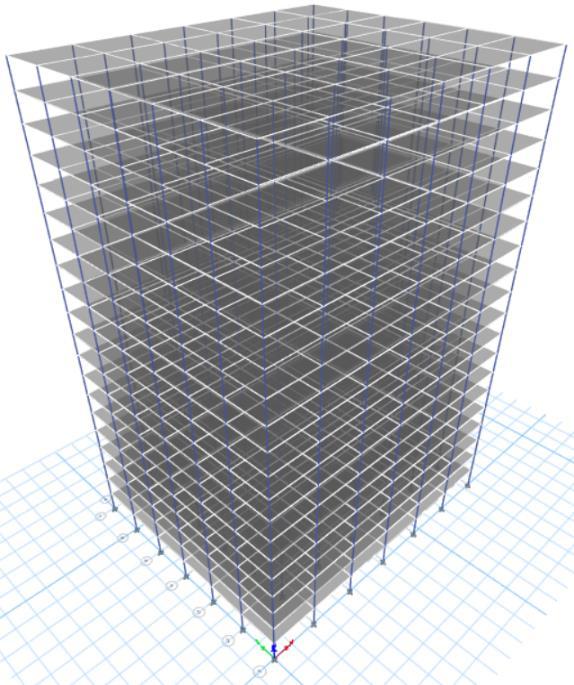
Fig 3 2 3D View

International Research Journal of Engineering and Technology (IRJET) e-ISSN:2395-0056
Case2) MODEL OF 18.36 % DETERIORATED BUILDING
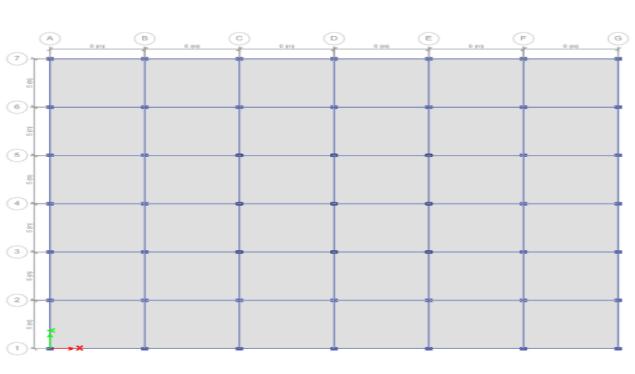
3.3 PLAN
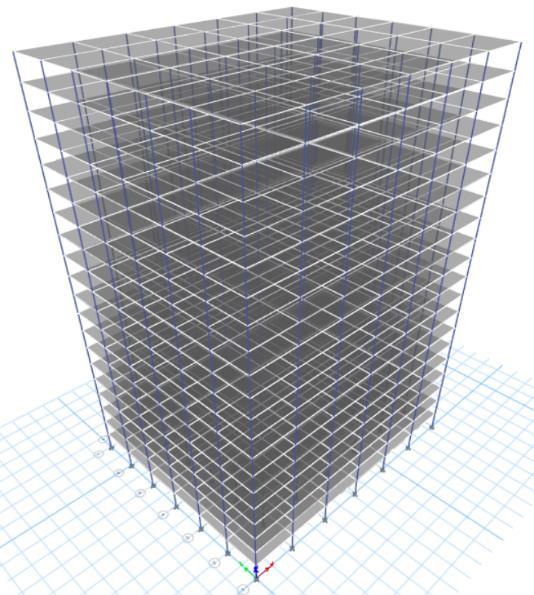
3.4 3D View
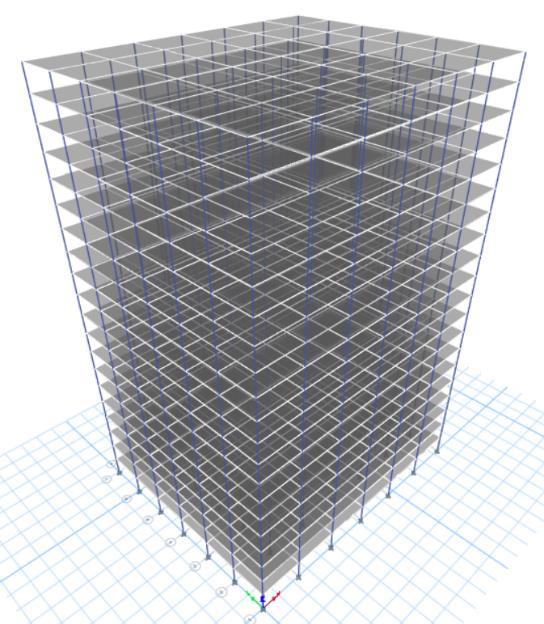
Case 3) MODEL OF 51.02% DETERIORATED BUILDING
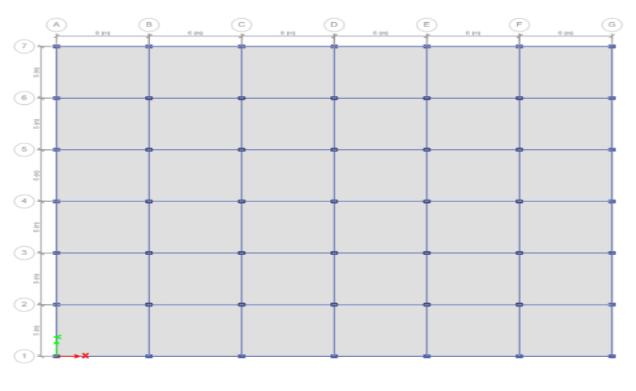
3.5 PLAN
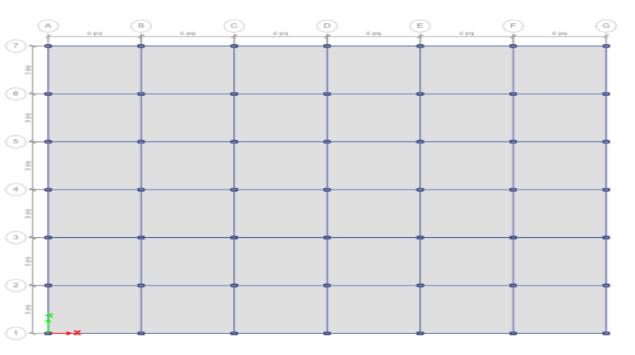
4) MODEL OF 100% DETERIORATED BUILDING
Volume: 11 Issue: 06 | Jun 2024 www.irjet.net p-ISSN:2395-0072 © 2024, IRJET | Impact Factor value: 8.226 | ISO 9001:2008

International Research Journal of Engineering and Technology (IRJET) e-ISSN:2395-0056
Volume: 11 Issue: 06 | Jun 2024 www.irjet.net p-ISSN:2395-0072
Case 5) MODEL OF 18.36% RETROFITTED BUILDING USING JACKETING
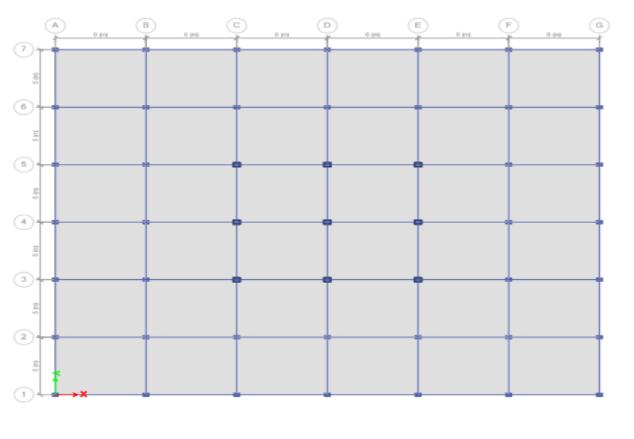
Fig 3.9 PLAN
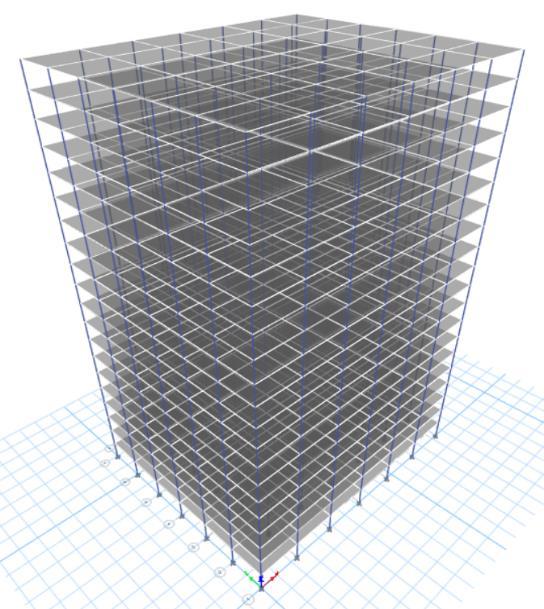
Fig 3.10 3D View
Case 6) MODEL OF 51.02% RETROFITTED BUILDING USING JACKETING
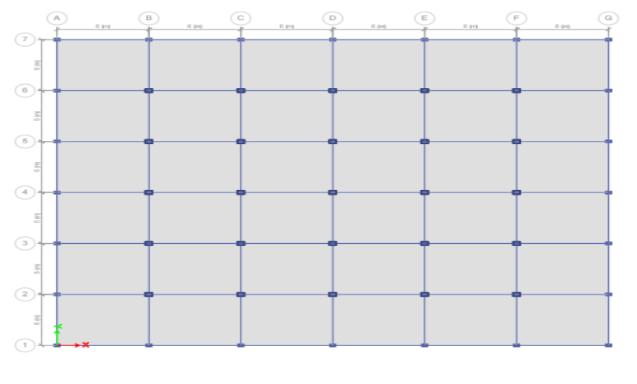
Fig 3.11 PLAN
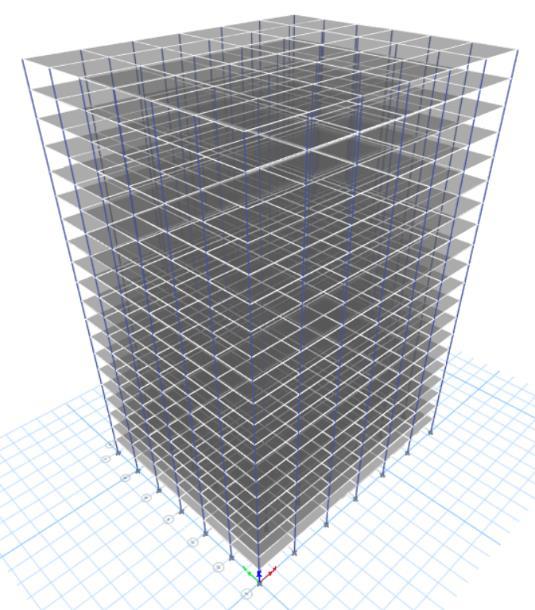
3 12 3D View
Case 7) MODEL OF 100 % RETROFITTED BUILDING USING JACKETING
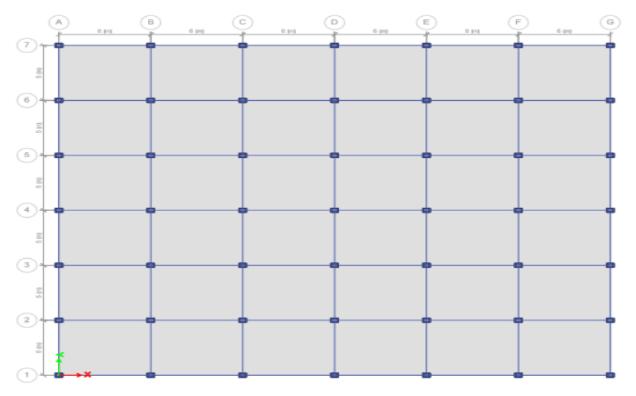
3 13 PLAN
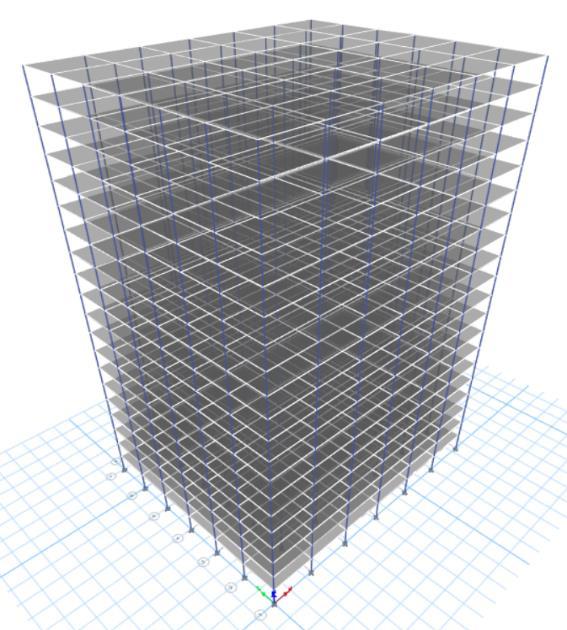
3.14 3D View

International Research Journal of Engineering and Technology (IRJET) e-ISSN:2395-0056
Volume: 11 Issue: 06 | Jun 2024 www.irjet.net p-ISSN:2395-0072
Case 8) MODEL OF 18.36 % RETROFITTED BUILDING USING SHEAR WALL
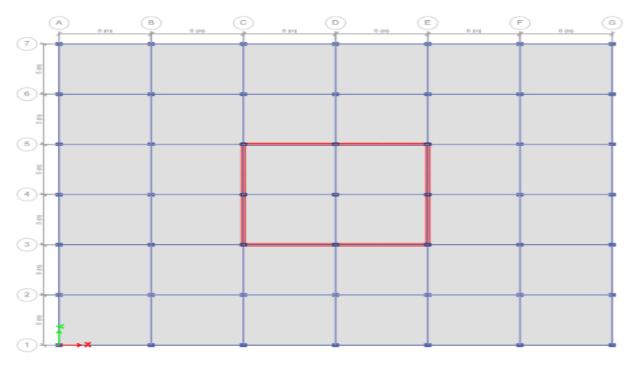
Fig 3 15 PLAN
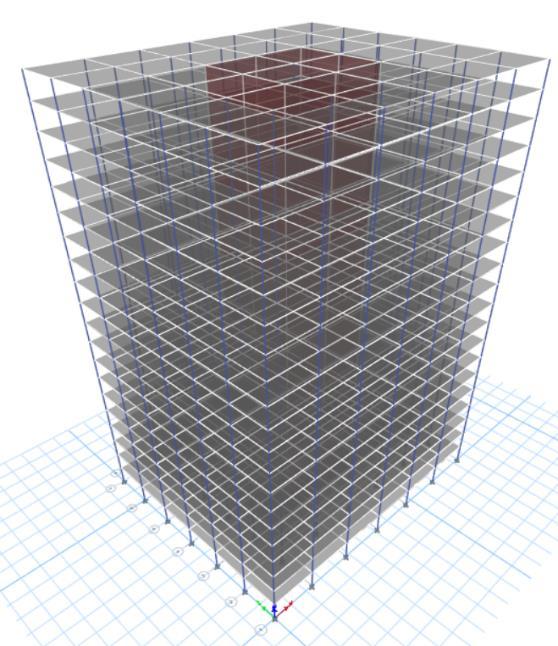
Fig 3.16 3D View
Case 9) MODEL OF 51.02 % RETROFITTED BUILDING USING SHEAR WALL
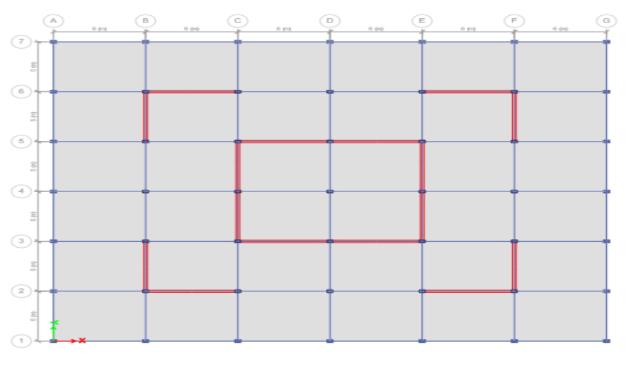
Fig 3.17 PLAN
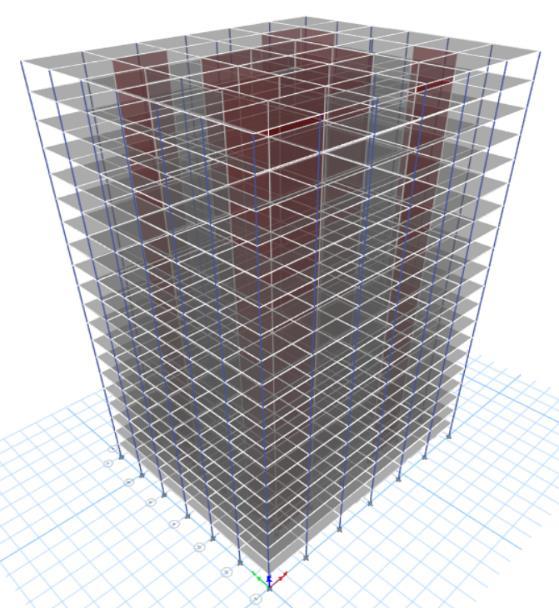
Fig 3 18 3D View
Case 10) MODEL OF 100% RETROFITTED BUILDING USING SHEAR WALL
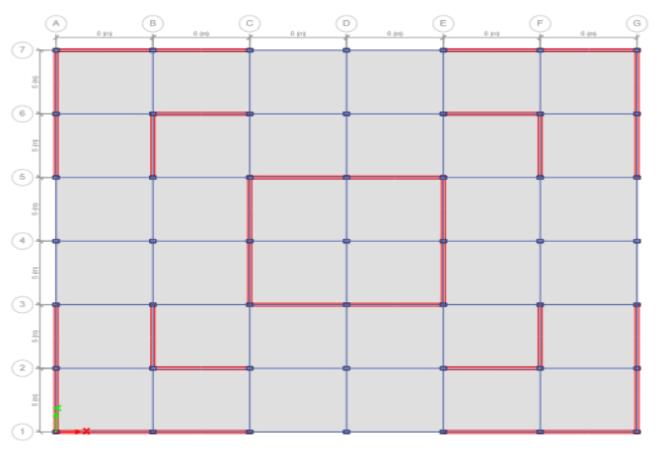
Fig 3.19 PLAN

Fig 3.20 3D View
2024, IRJET | Impact Factor value: 8.226 | ISO 9001:2008

International Research Journal of Engineering and Technology (IRJET) e-ISSN:2395-0056
Volume: 11 Issue: 06 | Jun 2024 www.irjet.net p-ISSN:2395-0072
Specifications: Thefollowingspecificationsareadopted forstudy.
Specifications
A. For Existing building without Retrofitting
PlanDimensions= 36mX30m
1.Gradeofconcrete M30
2.Gradeofsteel HYSD500
3.Columnsize 350mmX450mm
4.Beamsize 250mmX350mm
5.SlabThickness 120mm
B.ForDeterioratedbuilding
1.Gradeofconcrete M30
2.Gradeofsteel HYSD500
3.Columnsize 270mmX370mm
4.Beamsize 150mmX250mm
5.SlabThickness 120mm
C. For Retrofitted building using jacketing
1.Gradeofconcrete M35
2.Gradeofsteel HYSD550
3.Columnsize 400mmX500mm
4.Beamsize 300mmX400mm
5.SlabThickness 120mm
D.For Retrofitted building using Shearwall
1.Gradeofconcrete M35
2.Gradeofsteel HYSD550
3.Shearwallsize 230mm
BasicDataconsidered
a)Storeyheightforallmodels 3m
b)LocationofBuilding Pune
c)Earthquakezone III
d)ZoneFactor 0.16
e)DampingRatio 5%
f)ImportanceFactor 1
g)Responsereductionfactor 5
h)SoilType II(Mediumsoil)
i)Typeofstructure Special moment resistingframe
j)Typeofdiaphragm Rigid
k)Directionoflateralforces X direction and Y direction
l)Loadpatternconsidered DL,LL,EQx,Eqy
1.DL Programmecalculated 2.LL 3kN/m
m)ResponseSpectrumForces RSxandRsy NoofModels 10models
Existing Building without retrofitting 1model
Deteriorated building with percentage variation in deterioration
3 models with percentage variation as (18.36%, 51.02% and 100%)
Retrofitted building using jacketing with percentage variationinretrofication
3 models with percentage variation as (18.36%, 51.02% and 100%)
Retrofitted building using Shear wallwithpercentagevariationin retrofication
3 models with percentage variation as (18.36%, 51.02% and 100%)
LoadCombinations All load combinations asperIS1893:2016
Typeofsupportatbase Fixed
The Flow chart shows Overview the Methodology of projectwork.


Volume: 11 Issue: 06 | Jun 2024 www.irjet.net
Table 2 Evaluation of maximum Displacement for Existing Building Sr no
Table 3. Displacement Comparison due to load combination (1.5 (DL + LL + EQy)) for Case 1, Case 2, Case 5 and Case 8
5 1.5(DL+LL+EQX) 114.99
6 1.5(DL+LLEQX) 114.99
7 1.5(DL+LL+EQY) 118.513
Observations:
InthisExistingBuildingmodelforallloadcombinations the dynamic analysis is carried out to observe the maximumDisplacement
The analysis results for each are shown in above table from that the maximum values of Displacement are obtainedforLoadcombination7
So, the combination 7 is considered for further analysis ofallcases.
The analysis is carried out to study the seismic behavior of the structure under the influence of
1) LoadCombination1.5(DL+LL+EQY)
2) ResponseSpectrumForcesRSxandRSy
3) EarthquakeForcesEQxandEQy
The above Forces are considered to study the seismic behavior of building structure such as Displacement under10casesasmentioned.
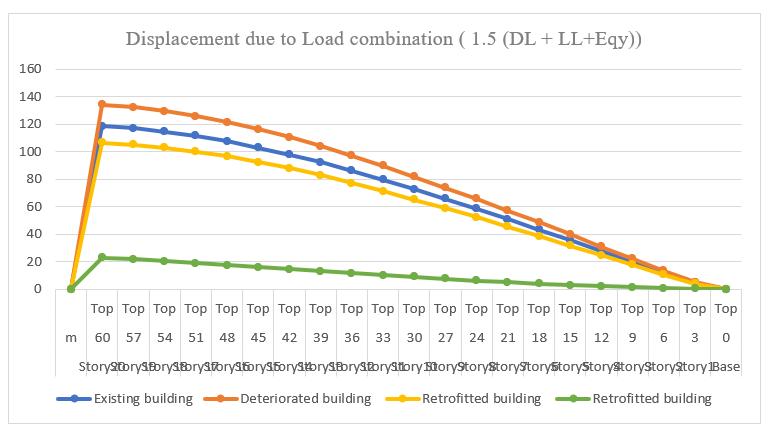
Graph 4.1 Displacement due to load combination (1.5 (DL +

International Research Journal of Engineering and Technology (IRJET) e-ISSN:2395-0056
Volume: 11 Issue: 06 | Jun 2024 www.irjet.net p-ISSN:2395-0072
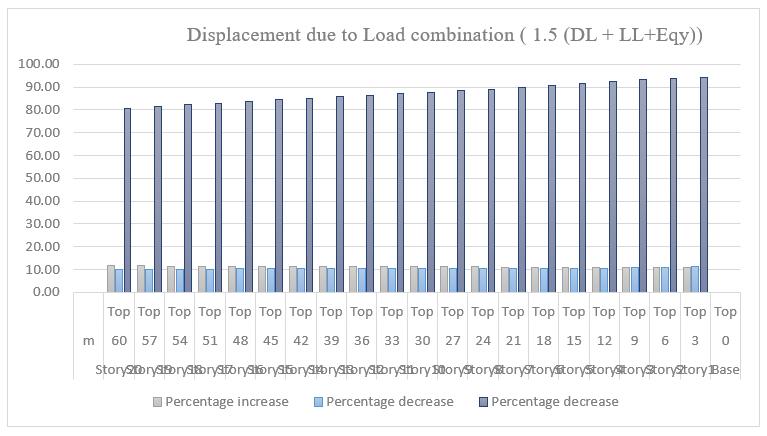
Graph 4.2 Percentage variation due to Displacement
Observations:
The table 3 and graphs 4.1 and 4.2 shows the displacement and percentage variation due to displacementalongstoreyheightofbuilding.
1) By comparing existing building model to 18.36 % deterioratedbuildingmodel.
a) Itisobservedthatthedisplacementfromstorey1 tostorey20isincreasedby10.88%to11.62%
b) The maximum displacement at storey 20 is increased by 11.62 % (i.e. increase from 118.513 mmto134.102mm)
2) By comparing existing building model to 18.36 % Retrofittedbuildingmodelusingjacketing.
a) Itisobservedthatthedisplacementfromstorey1 tostorey20isdecreasedby11.18%to10.20%
b) The maximum displacement at storey 20 is decreased by10.20%(i.e.decreasefrom118.513 mmto106.421mm)
3) By comparing existing building model to 18.36 % RetrofittedbuildingmodelusingShearwall.
a) Itisobservedthatthedisplacementfromstorey1 tostorey20isdecreasedby94.14%to80.54%.
b) The maximum displacement at storey 20 is decreased by80.54%(i.e.decreasefrom118.513 mmto23.067mm)
Table 4. Displacement Comparison
for Case 1, Case 3, Case 6 and Case 9

International Research Journal of Engineering and Technology (IRJET) e-ISSN:2395-0056
Volume: 11 Issue: 06 | Jun 2024 www.irjet.net p-ISSN:2395-0072
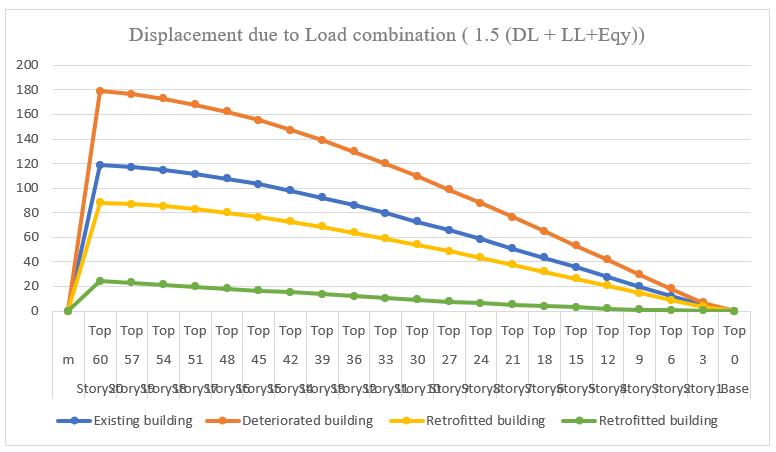
Graph 4.3 Displacement due to load combination (1.5 (DL + LL + Eqy))
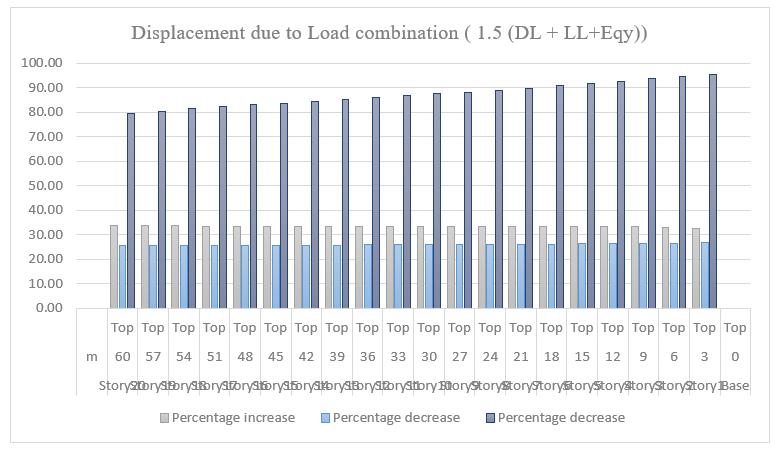
Graph 4.4 Percentage variation due to Displacement
Observations:
The table 4 and graphs 4.3 and 4.4 shows the displacement and percentage variation due to displacementalongstoreyheightofbuilding.
1) By comparing existing building model to 51.02 % deterioratedbuildingmodel.
a) Itisobservedthatthedisplacementfromstorey1 tostorey20isincreasedby32.72%to33.76%
b) The maximum displacement at storey 20 is increased by 33.76 % (i.e. increase from 118.513 mmto178.918mm)
2) By comparing existing building model to 51.02 % Retrofittedbuildingmodelusingjacketing.
a) Itisobservedthatthedisplacementfromstorey1 tostorey20isdecreasedby26.81%to25.66%
b) The maximum displacement at storey 20 is decreased by25.66%(i.e.decreasefrom118.513 mmto88.101mm)
3) By comparing existing building model to 51.02 % RetrofittedbuildingmodelusingShearwall.
a) Itisobservedthatthedisplacementfromstorey1 tostorey20isdecreasedby95.43%to79.41%
b) The maximum displacement at storey 20 is decreased by79.41%(i.e.decreasefrom118.513 mmto24.407mm)
Table 5. Displacement Comparison due to load combination (1.5 (DL + LL + Eqy)) for Case 1, Case 4, Case 7 and Case 10

International Research Journal of Engineering and Technology (IRJET) e-ISSN:2395-0056
Volume: 11 Issue: 06 | Jun 2024 www.irjet.net p-ISSN:2395-0072
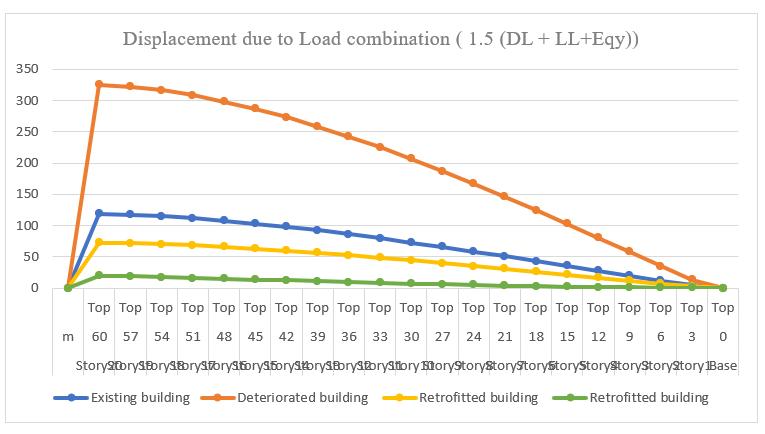
Graph 4.5 Displacement due to load combination (1.5 (DL + LL + Eqy))
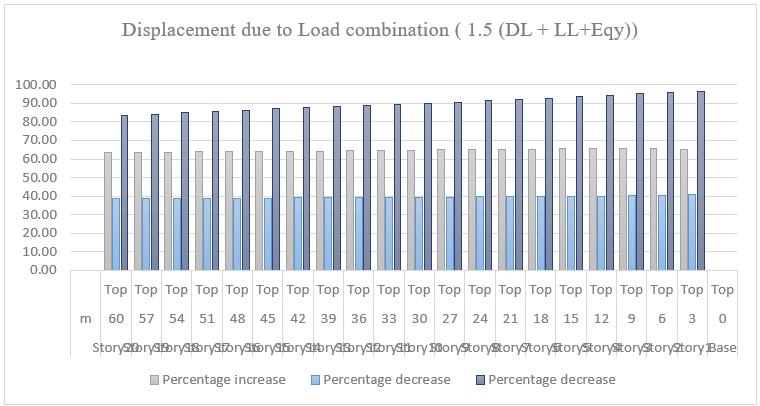
Graph 4.6 Percentage variation due to Displacement
Observations:
The table 5 and graphs 4.5 and 4.6 shows the displacement and percentage variation due to displacementalongstoreyheightofbuilding.
1) By comparing existing building model to 100 % deterioratedbuildingmodel,
a) Itisobservedthatthedisplacementfromstorey1 tostorey20,isincreasedby65.37%to63.60%
b) The maximum displacement at storey 20 is increased by 63.60 % (i.e. increase from 118.513 mmto325.544mm)
2) By comparing existing building model to 100 % Retrofittedbuildingmodelusingjacketing
a) Itisobservedthatthedisplacementfromstorey1 tostorey20isdecreasedby40.70%to38.71%,
b) The maximum displacement at storey 20 is decreased by38.71%(i.e.decreasefrom118.513 mmto72.633mm)
3) By comparing existing building model to 100 % RetrofittedbuildingmodelusingShearwall.
a) Itisobservedthatthedisplacementfromstorey1 tostorey20isdecreasedby96.55%to83.24%.
b) The maximum displacement at storey 20 is decreased by83.24%(i.e.decreasefrom118.513 mmto19.857mm)
Table 6. Displacement Comparison due to force EQx for Case 1, Case 2, Case 5 and Case 8

International Research Journal of Engineering and Technology (IRJET) e-ISSN:2395-0056
Volume: 11 Issue: 06 | Jun 2024 www.irjet.net p-ISSN:2395-0072
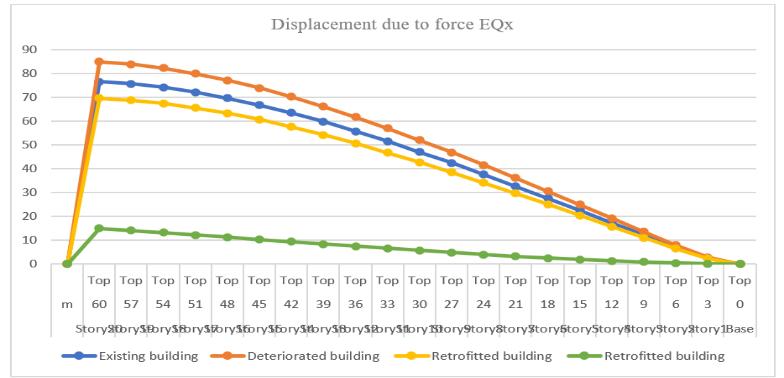
Graph 4.7 Displacement due to force EQx
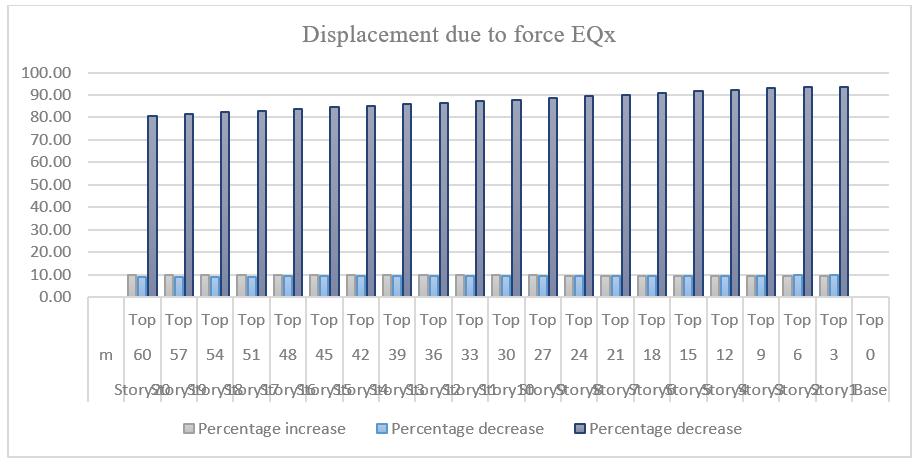
Graph 4.8 Percentage variation due to Displacement
Observations:
The table 6 and graphs 4.7 and 4.8 shows the displacement and percentage variation due to displacementalongstoreyheightofbuilding.
1) By comparing existing building model to 18.36 % deterioratedbuildingmodel.
a) Itisobservedthatthedisplacementfromstorey1 tostorey20isincreasedby9.51%to9.90%
b) The maximum displacement at storey 20 is increasedby9.90%(i.e.increasefrom 76.66mmto85.081mm)
2) By comparing existing building model to 18.36 % Retrofittedbuildingmodelusingjacketing.
a) Itisobservedthatthedisplacementfromstorey1 tostorey20isdecreasedby9.88%to9.10%
b) The maximum displacement at storey 20 is decreasedby9.10%(i.e.decreasefrom76.66mm to69.684mm)
3) By comparing existing building model to 18.36 % RetrofittedbuildingmodelusingShearwall
a) Itisobservedthatthedisplacementfromstorey1 tostorey20isdecreasedby93.54%to80.44%.
b) The maximum displacement at storey 20 is decreased by 80.44 % (i.e. decrease from 76.66 mmto14.993mm)
Table 7. Displacement Comparison due to force EQx for Case 1, Case 3, Case 6 and Case 9

International Research Journal of Engineering and Technology (IRJET) e-ISSN:2395-0056
Volume: 11 Issue: 06 | Jun 2024 www.irjet.net p-ISSN:2395-0072
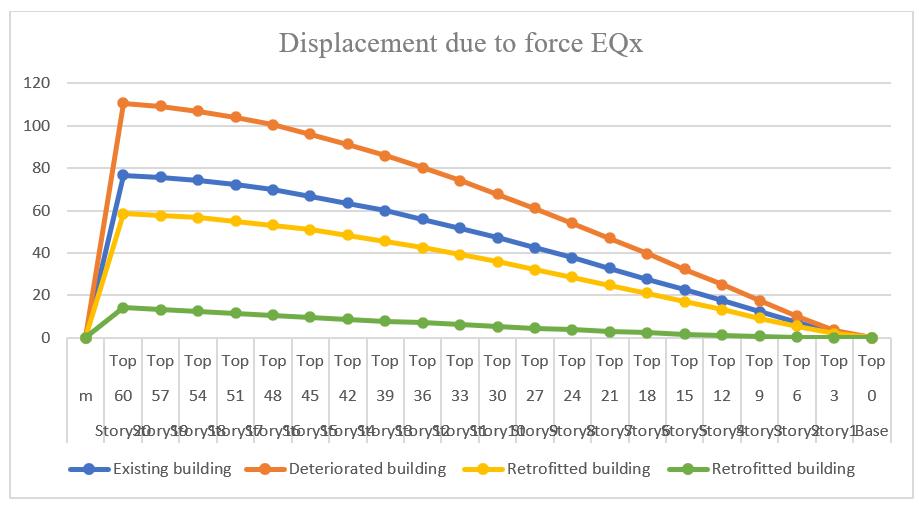
Graph 4.9 Displacement due to force EQx

Graph 4.10 Percentage variation due to Displacement
Observations:
The table 7 and graphs 4.10 and 4.11 shows the displacement and percentage variation due to displacementalongstoreyheightofbuilding.
1) By comparing existing building model to 51.02 % deterioratedbuildingmodel.
a) Itisobservedthatthedisplacementfromstorey1 tostorey20isincreasedby29.47%to30.68%
b) The maximum displacement at storey 20 is increasedby30.68%(i.e.increasefrom76.66mm to110.593mm)
2) By comparing existing building model to 51.02 % Retrofittedbuildingmodelusingjacketing.
a) Itisobservedthatthedisplacementfromstorey1 tostorey20isdecreasedby24.47%to23.85%
b) The maximum displacement at storey 20 is decreased by 23.85 % (i.e. decrease from 76.66 mmto58.376mm)
3) By comparing existing building model to 51.02 % RetrofittedbuildingmodelusingShearwall.
a) Itisobservedthatthedisplacementfrom storey1 tostorey20isdecreasedby95.06%to81.46%.
b) The maximum displacement at storey 20 is decreased by 79.41 % (i.e. decrease from 76.66 mmto14.209mm)
Table 8. Displacement Comparison due to force EQx for Case 1, Case 4, Case 7 and Case 10

International Research Journal of Engineering and Technology (IRJET) e-ISSN:2395-0056
Volume: 11 Issue: 06 | Jun 2024 www.irjet.net p-ISSN:2395-0072
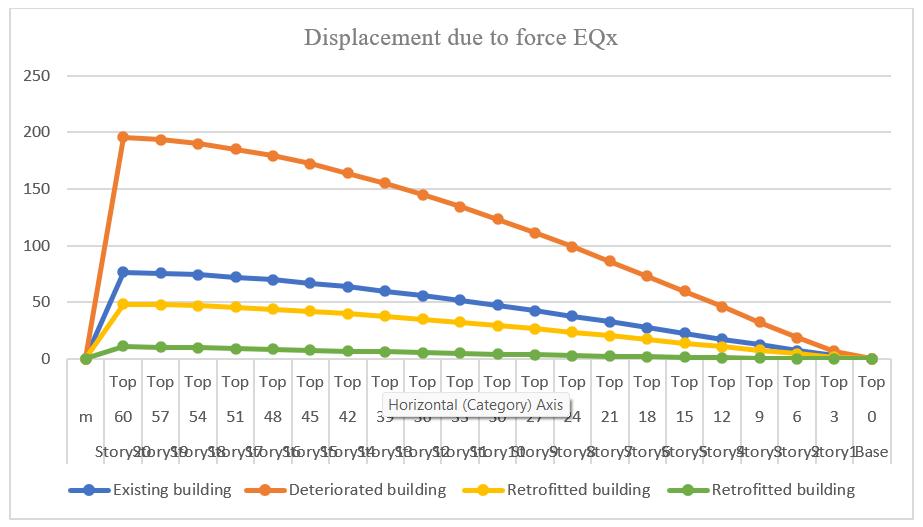
Graph 4.11 Displacement due to force EQx
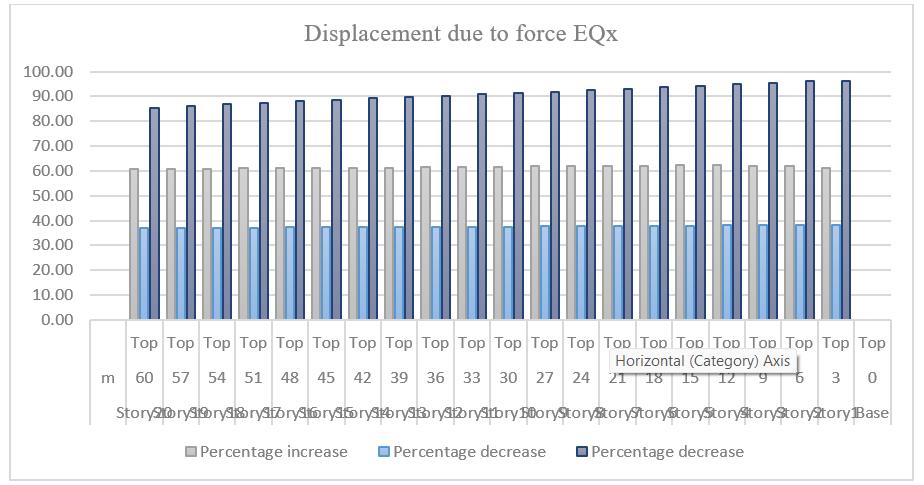
Graph 4.12 Percentage variation due to Displacement
Observations:
The table 8 and graphs 4.11 and 4.12 shows the displacement and percentage variation due to displacementalongstoreyheightofbuilding.
1) By comparing existing building model to 100 % deterioratedbuildingmodel,
a) Itisobservedthatthedisplacementfromstorey 1tostorey20,isincreased by61.18%to 60.81 %
b) The maximum displacement at storey 20 is increased by 60.81 % (i.e. increase from 76.66 mmto195.607mm)
2) By comparing existing building model to 100 % Retrofittedbuildingmodelusingjacketing
a) Itisobservedthatthedisplacementfromstorey 1 to storey 20 is decreased by 38.13% to 37.07 %,
b) The maximum displacement at storey 20 is decreased by 38.71 % (i.e. decrease from 76.66 mmto48.24mm)
3) By comparing existing building model to 100 % RetrofittedbuildingmodelusingShearwall.
a) Itisobservedthatthedisplacementfromstorey 1 to storey 20 is decreased by 96.26% to 85.45 %.
b) The maximum displacement at storey 20 is decreased by 83.24 % (i.e. decrease from 76.66 mmto11.155mm)
Table 9. Displacement Comparison due to force EQy for Case 1, Case 2, Case 5 and Case 8

International Research Journal of Engineering and Technology (IRJET) e-ISSN:2395-0056
Volume: 11 Issue: 06 | Jun 2024 www.irjet.net p-ISSN:2395-0072
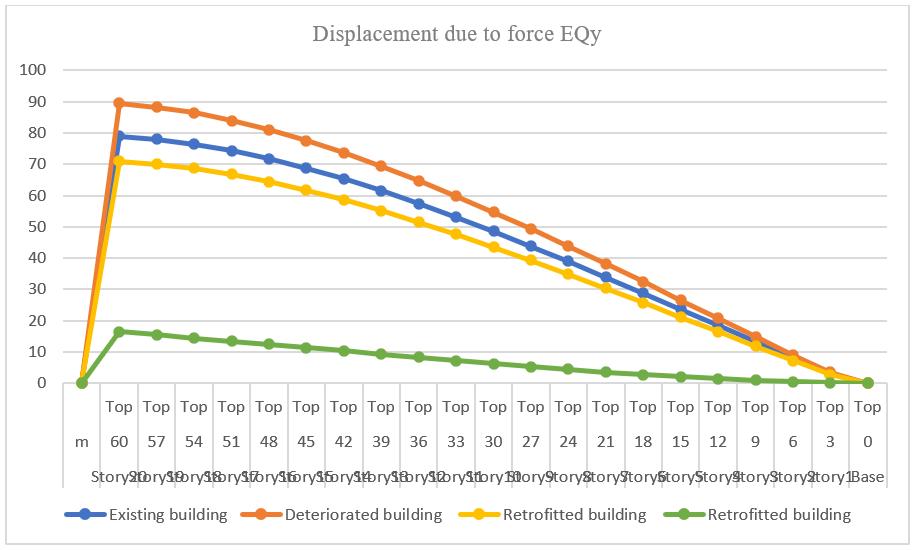
Graph 4.13 Displacement due to force EQy
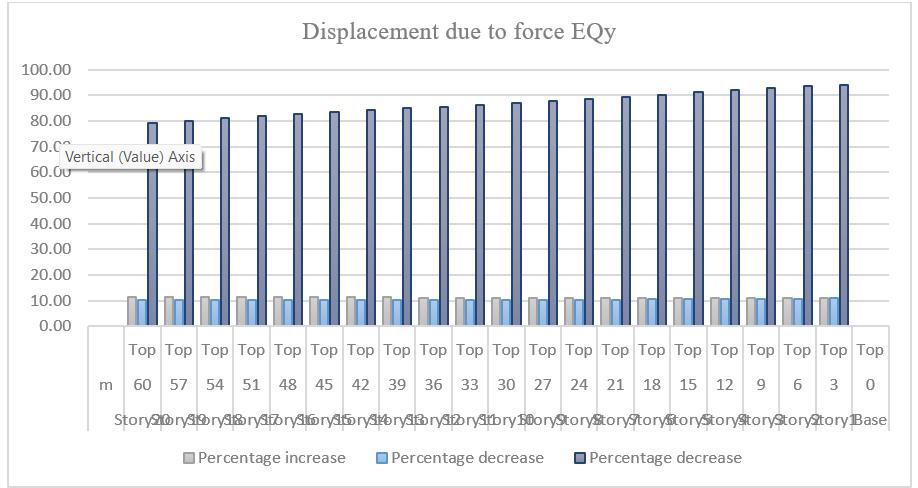
Graph 4.14 Percentage variation due to Displacement
Observations:
The table 9 and graphs 4.13 and 4.14 shows the displacement and percentage variation due to displacementalongstoreyheightofbuilding.
1) By comparing existing building model to 18.36 %deterioratedbuildingmodel.
a) Itisobservedthatthedisplacementfromstorey 1 to storey 20 is increased by 10.88 % to 11.62 %
b) The maximum displacement at storey 20 is increased by 11.62 % (i.e. increase from 79.009 mmto89.401mm)
2) By comparing existing building model to 18.36 %Retrofittedbuildingmodelusingjacketing.
a) Itisobservedthatthedisplacementfromstorey 1tostorey20isdecreased by11.18%to10.20 %
b) The maximum displacement at storey 20 is decreasedby10.20%(i.e.decreasefrom79.009 mmto70.947mm)
3) By comparing existing building model to 18.36 %RetrofittedbuildingmodelusingShearwall.
a) Itisobservedthatthedisplacementfromstorey 1 to storey 20 is decreased by 94.06 % to 79.14%.
b) The maximum displacement at storey 20 is decreasedby80.44%(i.e.decreasefrom79.009 mmto16.483mm)
Table 10. Displacement Comparison due to force EQy for Case 1, Case 3, Case 6 and Case 9

International Research Journal of Engineering and Technology (IRJET) e-ISSN:2395-0056
Volume: 11 Issue: 06 | Jun 2024 www.irjet.net p-ISSN:2395-0072
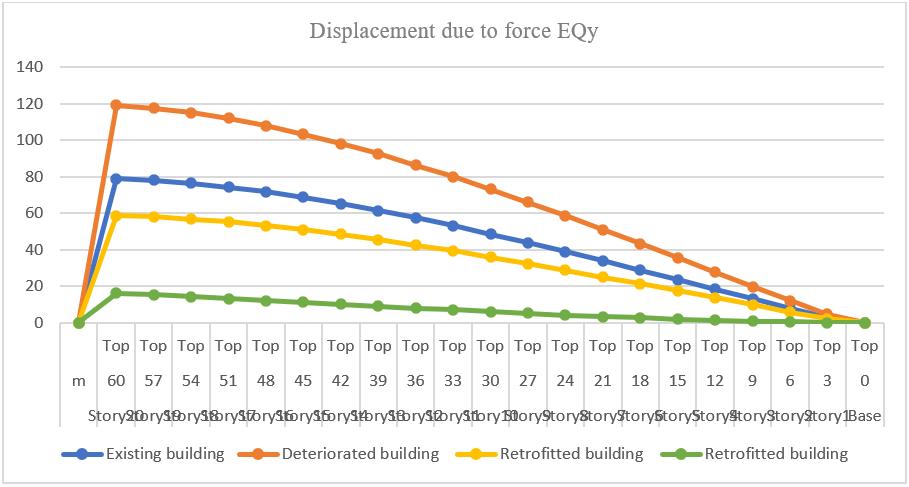
Graph 4.15 Displacement due to force EQy
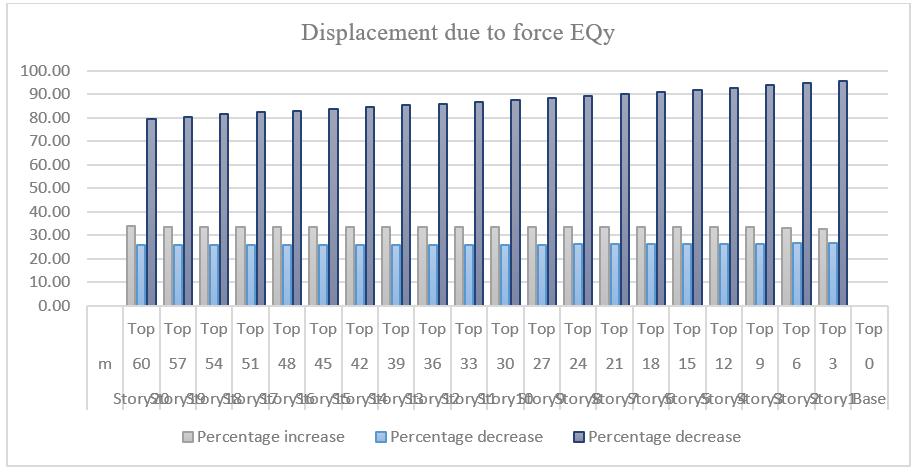
Graph 4.16 Percentage variation due to Displacement
Observations:
The table 10 and graphs 4.15 and 4.16 shows the displacement and percentage variation due to displacementalongstoreyheightofbuilding.
1) Bycomparingexistingbuildingmodelto51.02% deterioratedbuildingmodel.
a) It is observed that the displacement from storey 1tostorey20isincreasedby32.72%to33.76%
b) The maximum displacement at storey 20 is increased by 33.76 % (i.e. increase from 79.009 mmto119.28mm)
2) Bycomparingexistingbuildingmodelto51.02% Retrofittedbuildingmodelusingjacketing.
a) It is observed that the displacement from storey 1 to storey 20 is decreased by 26.81 % to 25.66 %
b) The maximum displacement at storey 20 is decreased by 25.66 % (i.e. decrease from 79.009 mmto58.734mm)
3) Bycomparingexistingbuildingmodelto51.02% RetrofittedbuildingmodelusingShearwall.
a) It is observed that the displacement from storey 1 to storey 20 is decreased by 95.45 % to 79.41 %.
b) The maximum displacement at storey 20 is decreased by 79.41 % (i.e. decrease from 76.66 mmto16.271mm)
Table 11. Displacement Comparison due to force EQy for Case 1, Case 4, Case 7 and Case 10

International Research Journal of Engineering and Technology (IRJET) e-ISSN:2395-0056
Volume: 11 Issue: 06 | Jun 2024 www.irjet.net p-ISSN:2395-0072
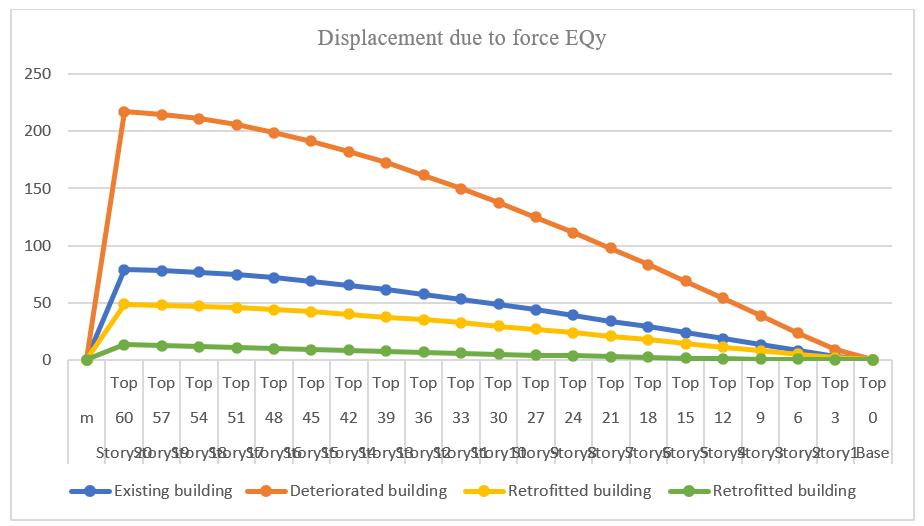
Graph 4.17 Displacement due to force EQy
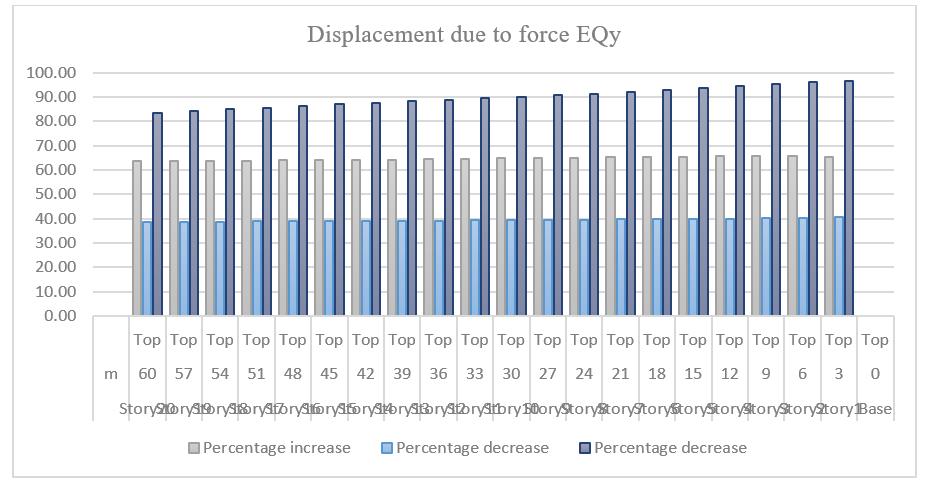
Graph 4.18 Percentage variation due to Displacement
Observations:
The table 11 and graphs 4.17 and 4.18 shows the displacement and percentage variation due to displacementalongstoreyheightofbuilding.
1) By comparing existing building model to 100 % deterioratedbuildingmodel,
a) It is observed that the displacement from storey 1 to storey 20, is increased by 65.37 % to 63.60 %
b) The maximum displacement at storey 20 is increased by 63.60 % (i.e. increase from 79.009 mmto217.03mm)
2) By comparing existing building model to 100 % Retrofittedbuildingmodelusingjacketing
a) It is observed that the displacement from storey 1 to storey 20 is decreased by 40.70 % to 38.71 %,
b) The maximum displacement at storey 20 is decreased by 38.71 % (i.e. decrease from 79.009 mmto48.422mm)
3) By comparing existing building model to 100 % RetrofittedbuildingmodelusingShearwall.
a) It is observed that the displacement from storey 1 to storey 20 is decreased by 96.54 % to 83.24 %.
b) The maximum displacement at storey 20 is decreased by 83.24 % (i.e. decrease from 79.009 mmto13.238mm)
Table 12. Displacement Comparison due to force RSx for Case 1, Case 2, Case 5 and Case 8

International Research Journal of Engineering and Technology (IRJET) e-ISSN:2395-0056
Volume: 11 Issue: 06 | Jun 2024 www.irjet.net p-ISSN:2395-0072
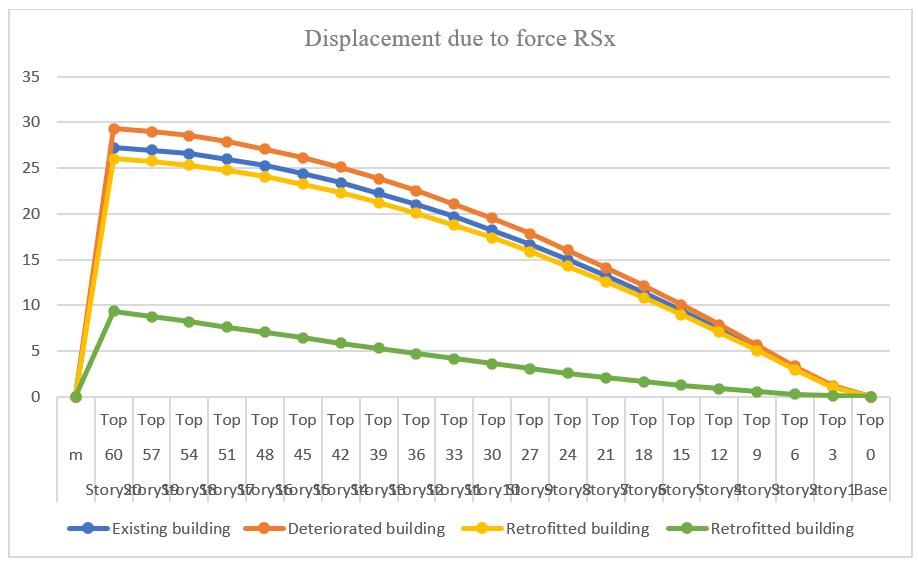
Graph 4.19 Displacement due to force RSx
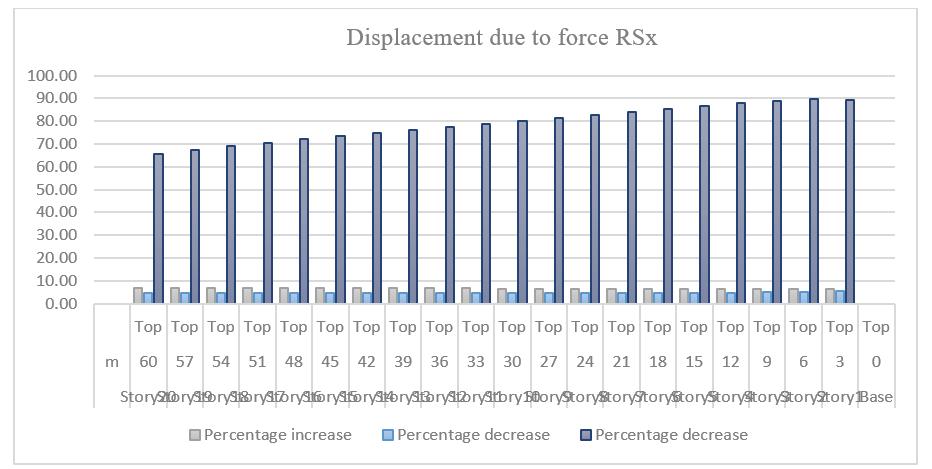
Graph 4.20 Percentage variation due to Displacement
Observations:
The table 12 and graphs 4.19 and 4.20 shows the displacement and percentage variation due to displacementalongstoreyheightofbuilding.
1) Bycomparingexistingbuildingmodelto18.36% deterioratedbuildingmodel.
a) It is observed that the displacement from storey 1tostorey20isincreasedby6.28%to7%
b) The maximum displacement at storey 20 is increased by 7 % (i.e. increase from 27.253 mm to29.305mm)
2) Bycomparingexistingbuildingmodelto18.36% Retrofittedbuildingmodelusingjacketing.
a) It is observed that the displacement from storey 1tostorey20isdecreasedby5.29%to4.56%
b) The maximum displacement at storey 20 is decreased by 4.56 % (i.e. decrease from 27.253 mmto26.011mm)
3) Bycomparingexistingbuildingmodelto18.36% RetrofittedbuildingmodelusingShearwall.
a) It is observed that the displacement from storey 1 to storey 20 is decreased by 89.15 % to 65.72 %.
b) The maximum displacement at storey 20 is decreased by 65.72 % (i.e. decrease from 27.253 mmto9.343mm)
Table 13. Displacement Comparison due to force RSx for Case 1, Case 3, Case 6 and Case 9

International Research Journal of Engineering and Technology (IRJET) e-ISSN:2395-0056
Volume: 11 Issue: 06 | Jun 2024 www.irjet.net p-ISSN:2395-0072
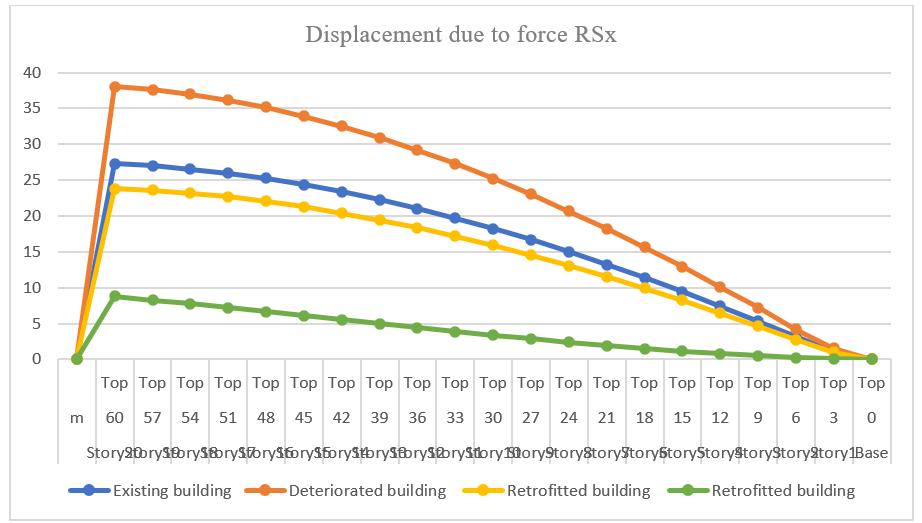
Graph 4.21 Displacement due to force RSx
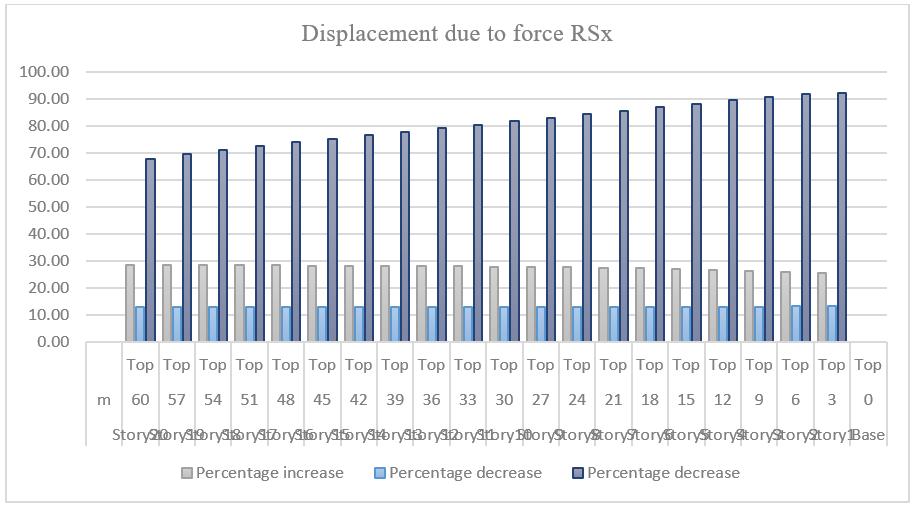
Graph 4.22 Percentage variation due to Displacement
Observations:
The table 13 and graphs 4.21 and 4.22 shows the displacement and percentage variation due to displacementalongstoreyheightofbuilding.
1) By comparing existing building model to 51.02 % deterioratedbuildingmodel.
a) Itisobservedthatthedisplacementfromstorey1 tostorey20isincreasedby25.35%to28.36%
b) The maximum displacement at storey 20 is increased by 28.36 % (i.e. increase from 27.253 mmto119.28mm)
2) By comparing existing building model to 51.02 % Retrofittedbuildingmodelusingjacketing.
a) Itisobservedthatthedisplacementfromstorey1 tostorey20isdecreasedby13.14%to12.68%
b) The maximum displacement at storey 20 is decreased by 12.68 % (i.e. decrease from 27.253 mmto23.798mm)
3) By comparing existing building model to 51.02 % RetrofittedbuildingmodelusingShearwall.
a) Itisobservedthatthedisplacementfromstorey1 tostorey20isdecreasedby92.06%to67.67%.
b) The maximum displacement at storey 20 is decreased by 79.41 % (i.e. decrease from 27.253mmto8.81mm)
Table 14 Displacement Comparison due to force RSx for Case 1, Case 4, Case 7 and Case 10

International Research Journal of Engineering and Technology (IRJET) e-ISSN:2395-0056
Volume: 11 Issue: 06 | Jun 2024 www.irjet.net p-ISSN:2395-0072
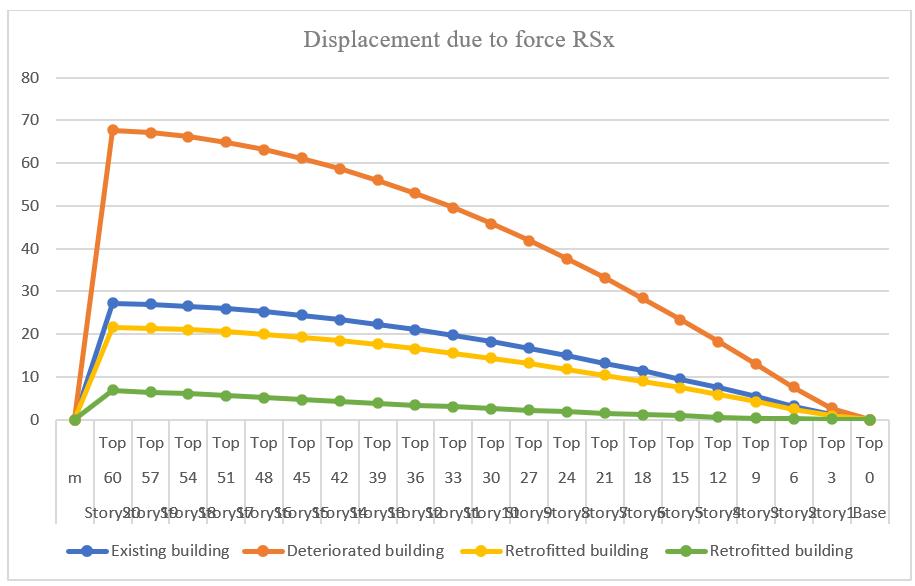
Graph 4.23 Displacement due to force RSx
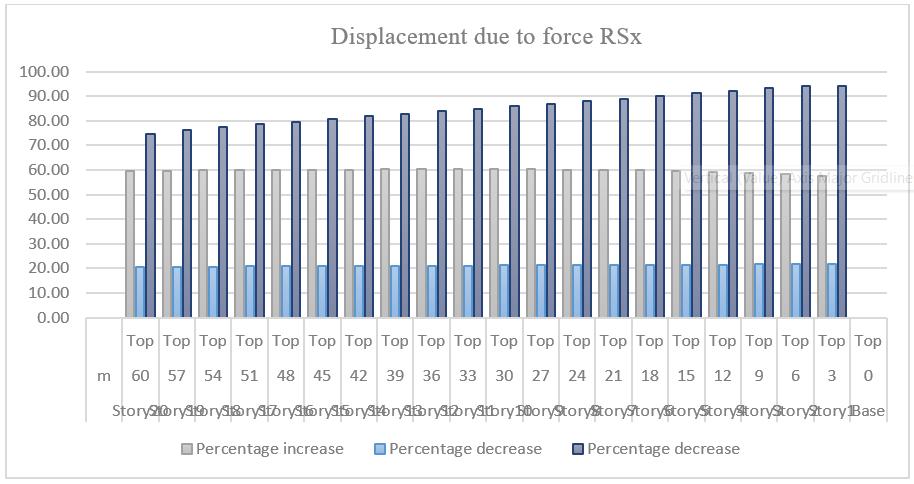
Graph 4.24 Percentage variation due to Displacement
Observations:
The table 14 and graphs 4.23 and 4.24 shows the displacement and percentage variation due to displacementalongstoreyheightofbuilding.
1) By comparing existing building model to 100 % deterioratedbuildingmodel,
a) Itisobservedthatthedisplacementfromstorey 1tostorey20,isincreased by57.50%to 59.72 %
b) The maximum displacement at storey 20 is increased by 59.72 % (i.e. increase from 27.253 mmto67.66mm)
2) By comparing existing building model to 100 % Retrofittedbuildingmodelusingjacketing.
a) Itisobservedthatthedisplacementfromstorey 1tostorey20isdecreased by21.69 %to20.66 %,
b) The maximum displacement at storey 20 is decreasedby20.66%(i.e.decreasefrom27.253 mmto21.622mm)
3) By comparing existing building model to 100 % RetrofittedbuildingmodelusingShearwall.
a) Itisobservedthatthedisplacementfromstorey 1tostorey20isdecreasedby94.27%to 74.76%.
b) The maximum displacement at storey 20 is decreasedby74.76%(i.e.decreasefrom27.253 mmto6.878mm)
Table 15. Displacement Comparison due to force RSy for Case 1, Case 2, Case 5 and Case 8

International Research Journal of Engineering and Technology (IRJET) e-ISSN:2395-0056
Volume: 11 Issue: 06 | Jun 2024 www.irjet.net p-ISSN:2395-0072
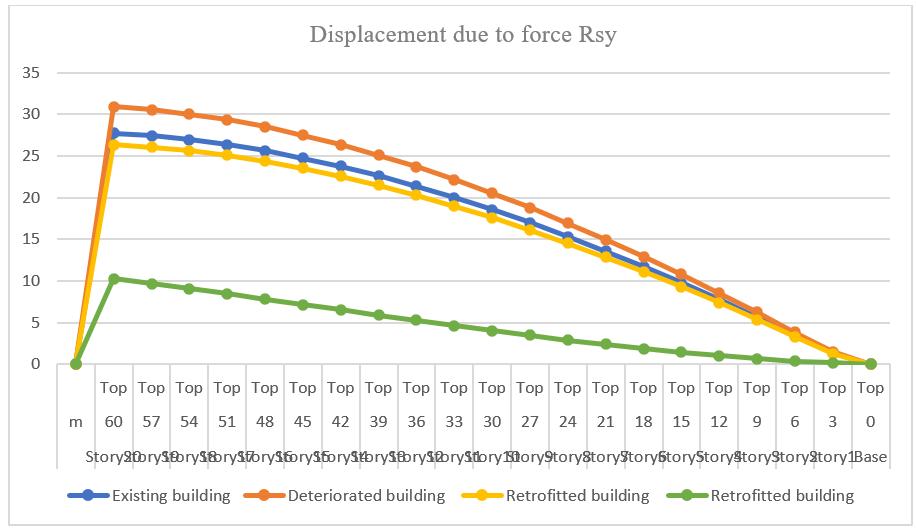
Graph 4.25 Displacement due to force Rsy
Graph 4.26 Percentage variation due to Displacement
Observations:
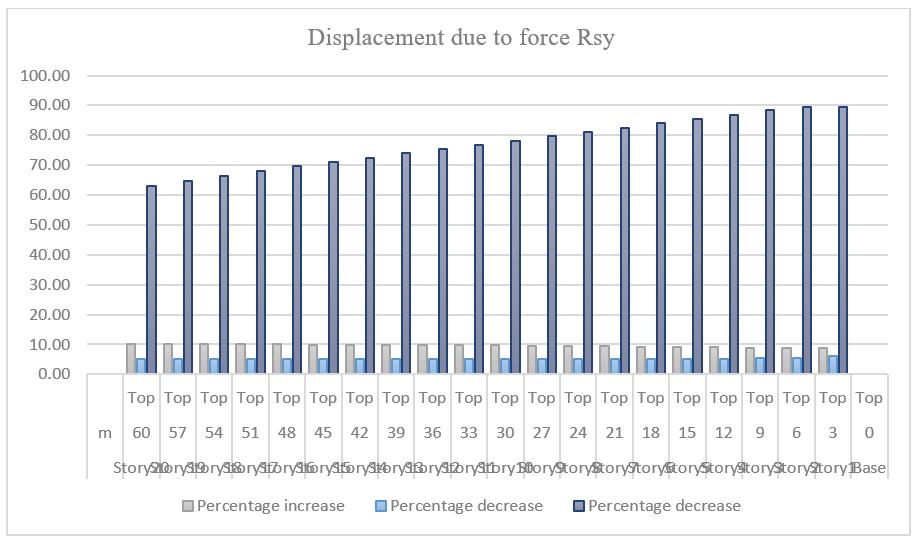
The table 15 and graphs 4.25 and 4.26 shows the displacement and percentage variation due to displacementalongstoreyheightofbuilding.
1) By comparing existing building model to 18.36 %deterioratedbuildingmodel.
a) Itisobservedthatthedisplacementfromstorey 1tostorey20isincreasedby8.89%to10.27%
b) The maximum displacement at storey 20 is increased by 10.27 % (i.e. increase from 27.709 mmto30.882mm)
2) By comparing existing building model to 18.36 %Retrofittedbuildingmodelusingjacketing.
a) Itisobservedthatthedisplacementfromstorey 1tostorey20isdecreasedby5.99%to4.99%
b) The maximum displacement at storey 20 is decreased by 4.99 % (i.e. decrease from 27.709 mmto26.325mm)
3) By comparing existing building model to 18.36 %RetrofittedbuildingmodelusingShearwall.
4) Itisobservedthatthedisplacementfromstorey 1tostorey20isdecreased by89.64%to 62.89 %.
5) The maximum displacement at storey 20 is decreasedby62.89%(i.e.decreasefrom27.709 mmto10.282mm)
Table 16. Displacement Comparison due to force RSy for Case 1, Case 3, Case 6 and Case 9

International Research Journal of Engineering and Technology (IRJET) e-ISSN:2395-0056
Volume: 11 Issue: 06 | Jun 2024 www.irjet.net p-ISSN:2395-0072

Graph 4.27 Displacement due to force Rsy
Graph 4.28 Percentage variation due to Displacement
Observations:
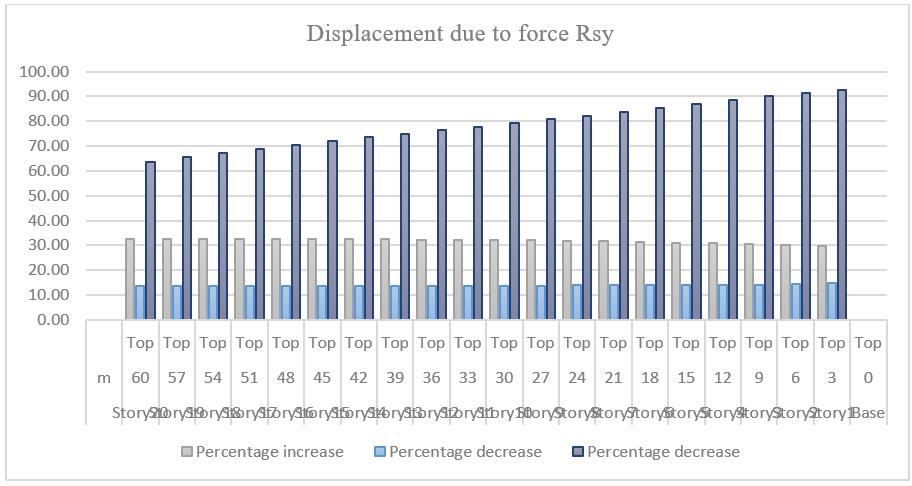
The table 16 and graphs 4.27 and 4.28 shows the displacement and percentage variation due to displacementalongstoreyheightofbuilding.
1) By comparing existing building model to 51.02 %deterioratedbuildingmodel.
a) Itisobservedthatthedisplacementfromstorey 1 to storey 20 is increased by 29.58 % to 32.70 %
b) The maximum displacement at storey 20 is increased by 32.70 % (i.e. increase from 27.709 mmto41.174mm)
2) By comparing existing building model to 51.02 %Retrofittedbuildingmodelusingjacketing.
a) Itisobservedthatthedisplacementfromstorey 1tostorey20isdecreased by14.72%to 13.62 %
b) The maximum displacement at storey 20 is decreasedby13.62%(i.e.decreasefrom27.709 mmto23.935mm)
3) By comparing existing building model to 51.02 %RetrofittedbuildingmodelusingShearwall.
a) Itisobservedthatthedisplacementfromstorey 1tostorey20isdecreased by92.53%to 63.74 %.
b) The maximum displacement at storey 20 is decreasedby63.74%(i.e.decreasefrom27.709 mmto10.046mm)
Table 17. Displacement Comparison due to force RSy for Case 1, Case 4, Case 7 and Case 10

International Research Journal of Engineering and Technology (IRJET) e-ISSN:2395-0056
Volume: 11 Issue: 06 | Jun 2024 www.irjet.net p-ISSN:2395-0072
Graph 4.29 Displacement due to force Rsy
Graph 4.30 Percentage variation due to Displacement
Observations:
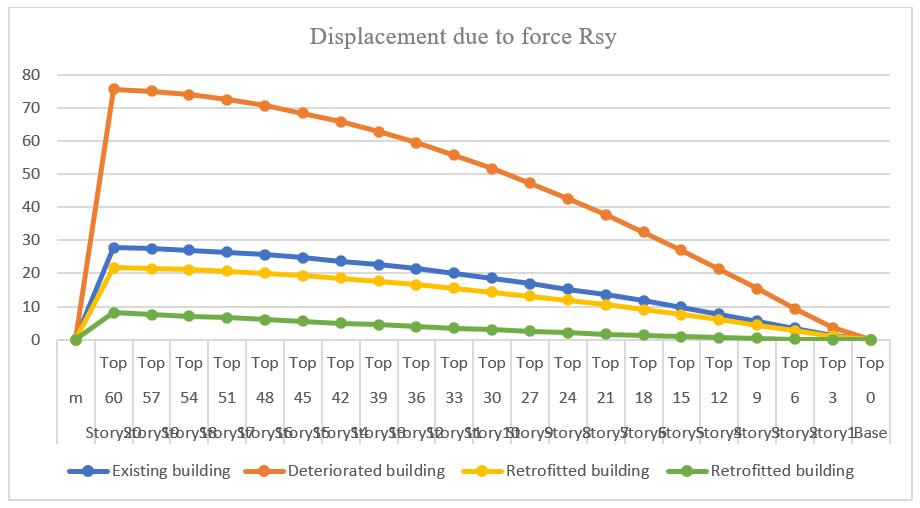
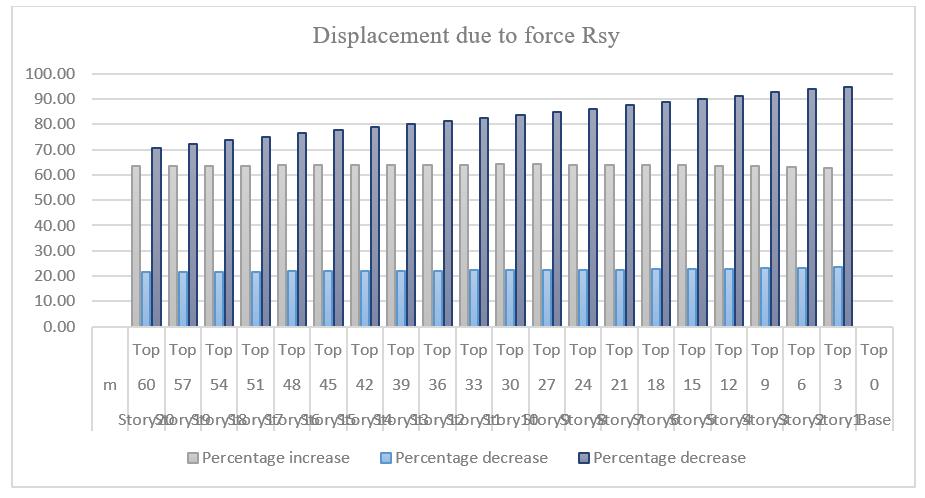
The table 17 and graphs 4.29 and 4.30 shows the displacement and percentage variation due to displacementalongstoreyheightofbuilding.
1) By comparing existing building model to 100 % deterioratedbuildingmodel.
a) Itisobservedthatthedisplacementfromstorey 1 to storey 20 is increased by 62.58 % to 63.33 %
b) The maximum displacement at storey 20 is increased by 63.33 % (i.e. increase from 27.709 mmto75.555mm)
2) By comparing existing building model to 100 % Retrofittedbuildingmodelusingjacketing.
a) Itisobservedthatthedisplacementfromstorey 1tostorey20isdecreased by23.74%to 21.57 %
b) The maximum displacement at storey 20 is decreasedby21.57%(i.e.decreasefrom27.709 mmto21.732mm)
3) By comparing existing building model to 100 % RetrofittedbuildingmodelusingShearwall.
a) Itisobservedthatthedisplacementfromstorey 1tostorey20isdecreased by94.60%to 70.67 %.
b) The maximum displacement at storey 20 is decreasedby70.67%(i.e.decreasefrom27.709 mmto8.127mm)
1) Displacement shows grater results in deteriorated building model considering various percentage deterioration as compared to existing building model without retrofitting and retrofitted building modelsconsideringvariouspercentageretrofication.
2) Displacements are decreased in retrofitted building modelsconsideringvariouspercentageretrofication compared to deteriorated building structure and existingbuildingstructurewithoutretrofitting.
[1] Bahador Bagheri, “Comparative study of the static and dynamic analysis of multistorey irregular building”, International Journal Civil, Environmental Structural ConstructionandArchitecturalEngineering,vol-6.
[2] Chandurkar P. P, Dr. Pajgade P. S. (2013). “Seismic Analysis of RCC Building with and Without Shear Wall.”, International Journal of Modern Engineering Research (IJMER)(2249-6645).
[3] Chavan Krishna raj R., Jadhav H.S. (2014). “Seismic Response of RC Building with Different Arrangement of Steel Bracing System.”, International Journal of engineeringResearchandApplications(2248-9622).
[4] Girum mindaye, “Seismic analysis of multistory RC frame building in different seismic zone”, International Journal of Innovative Research in Science, Engineering andTechnology,vol.-05,issue-09,sep.2016
[5] IS 1893 (Part 1): 2016 Criteria for Earthquake ResistantDesignStructures,BureauofIndianStandards, NewDelhi.
[6] IS 875 (Part 1): 1987, Indian Standard Code of PracticeforDesignLoads(OtherthanEarthquake)(Dead Load) for Buildings and Structures, Bureau of Indian Standards,NewDelhi.
[7] IS 875 (Part2): 1987, Indian Standard Code of Practice for Design Loads (Other than Earthquake) (Imposed Load) for Buildings and Structures, Bureau of IndianStandards,NewDelhi.

International Research Journal of Engineering and Technology (IRJET) e-ISSN:2395-0056
Volume: 11 Issue: 06 | Jun 2024 www.irjet.net p-ISSN:2395-0072
[8] IS 456-2000, Indian Standard Plain and Reinforced Concrete- Code of Practice, Bureau of Indian Standards, NewDelhi.
AUTHORS BIOGRAPHY

Prof. Ganesh C. Jawalkar
Working as Assistant Professor in N. B. Navale Sinhgad College of Engineering Solapur. Graduated in Civil Engineering from Shivaji University Kolhapur and Post Graduation in Structural Engineering from Solapur University and UGC approved. Having a total Teaching Experience of 17 years. Guided more than 10 students for Post Graduation.

Yogesh Sanjay Pawar MTech(Structure)Persuing,Studentof N.B. Navale Sinhgad college of Engineering,kegaonsolapur,India

Prof. Rameez R. Badeghar
Working as Assistant Professor in N. B. Navale Sinhgad College of Engineering Solapur. Graduated in Civil Engineering from Shivaji University Kolhapur and Post Graduation in Structural Engineering from Solapur University. Having a total Teaching Experience of 16 years. Guiding more than 4 students for Post Graduation. Worked for a semester in STES University Kigali, Rawanda,EastAfrica.