
International Research Journal of Engineering and Technology (IRJET) e-ISSN: 2395-0056
Volume: 11 Issue: 07 | July 2024 www.irjet.net p-ISSN: 2395-0072

International Research Journal of Engineering and Technology (IRJET) e-ISSN: 2395-0056
Volume: 11 Issue: 07 | July 2024 www.irjet.net p-ISSN: 2395-0072
Thanup NT1 , Nikhil GR2, Kumar Swamy MS3, Sheikh Mohammed Zain4
1Head of Department, Department of Civil Engineering, Adichunchanagiri Polytechnic, Chikkamagalur, Karnataka, India
2,3,4Diploma in Civil Engineering, Adichunchanagiri Polytechnic, Chikkamagalur, Karnataka, India ***
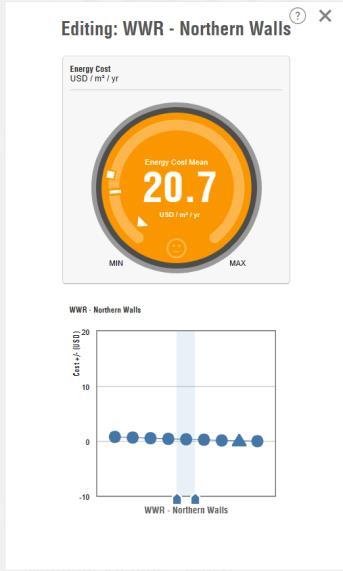
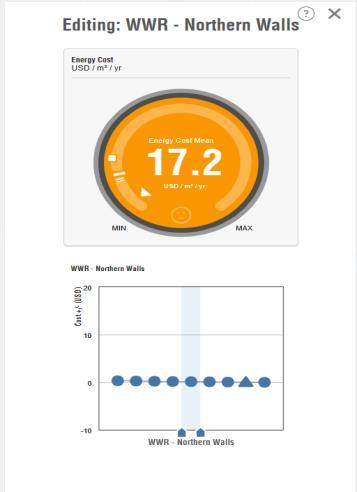
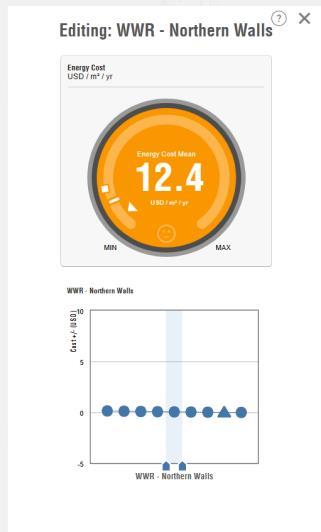
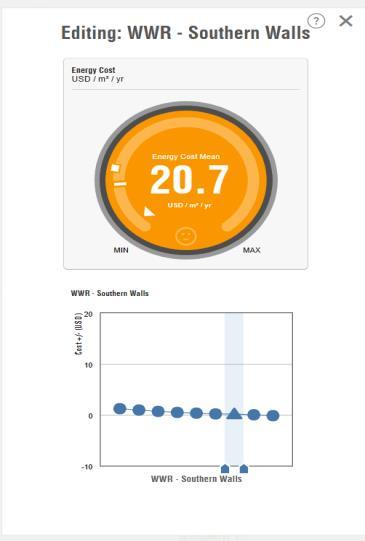
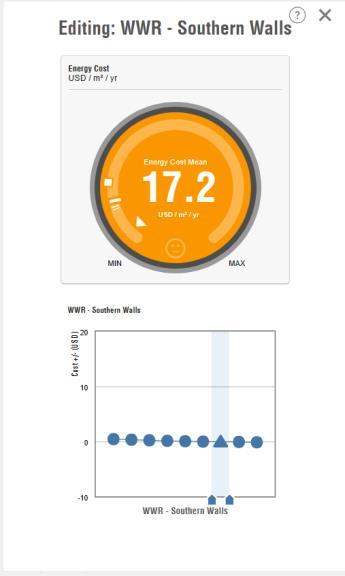
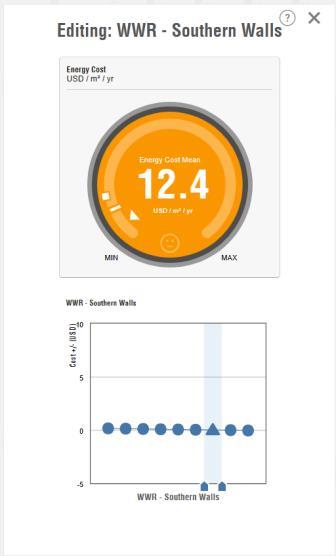
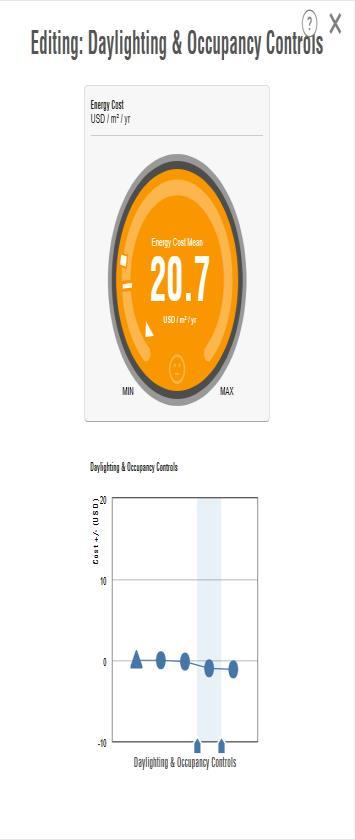
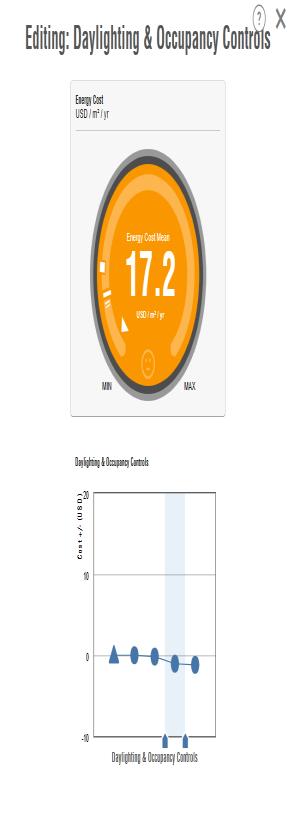
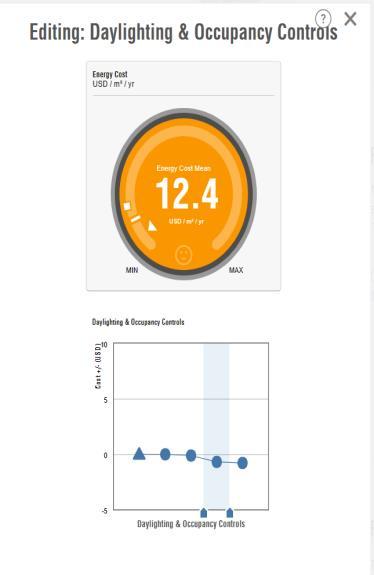
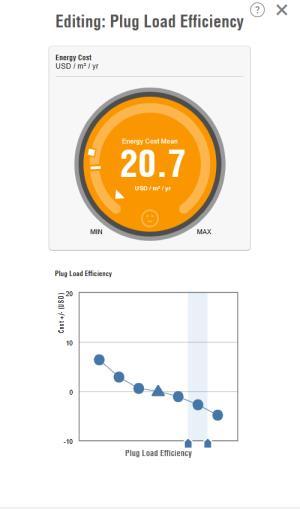
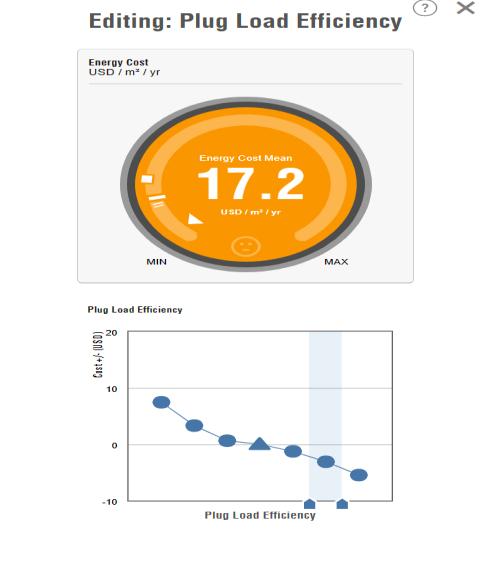
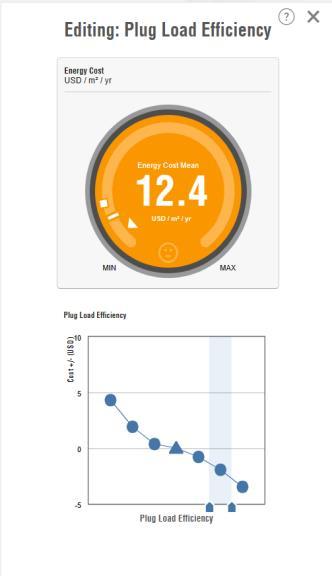
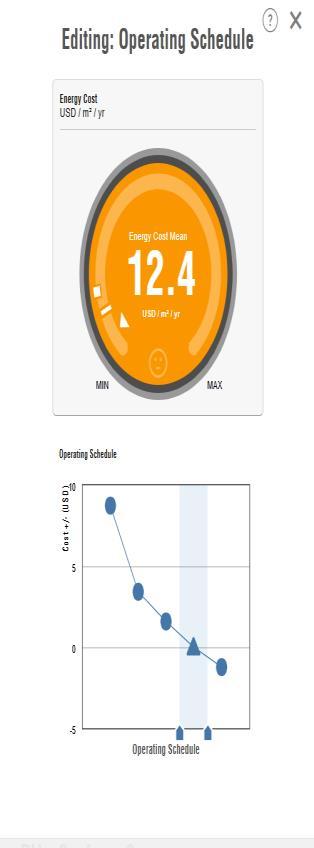
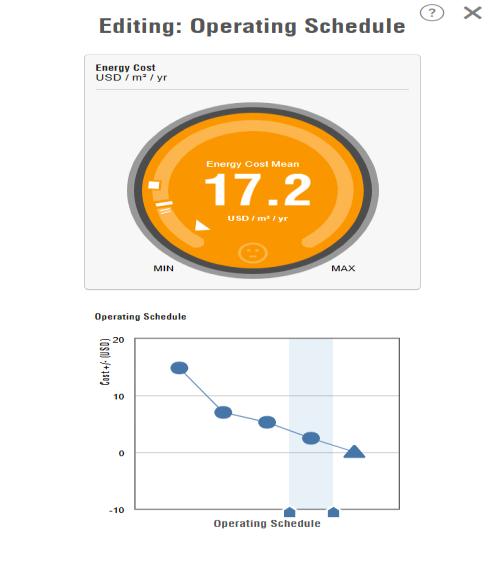
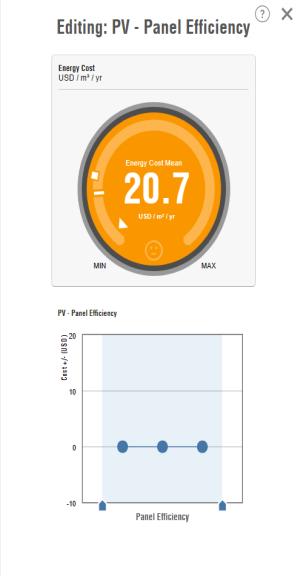
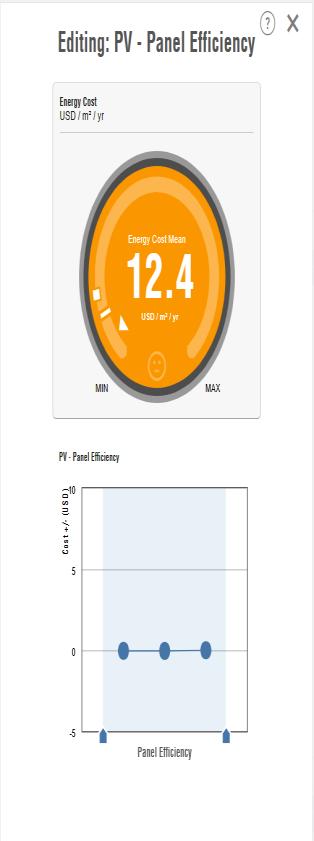
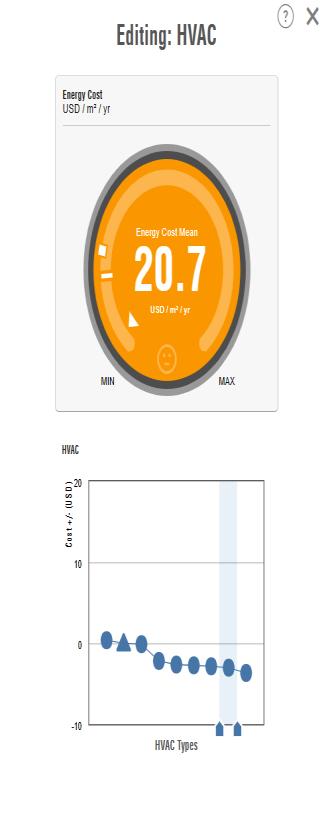
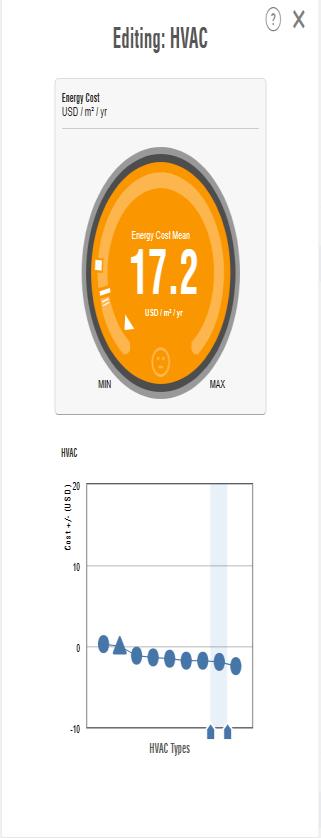
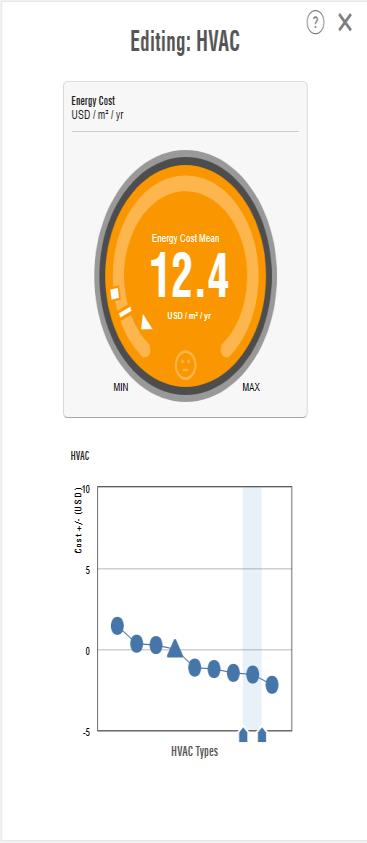
Abstract – Theconsciousnessofenergyusageiscrucialfor global sustainability efforts, particularly in optimizing the energy consumption of buildings. This research focuses on creating a digital twin of Adichunchangiri Polytechnic's existing building and enhancing its visualization using Twinmotion software. Additionally, a comprehensive threeenergy model was developed and analyzed. Among the assessments conducted, Assessment Three emerged with the most favorable operational cost per square meter at 12.4 USD/m2, surpassing Assessment One (20.7 USD/m2) and AssessmentTwo(17.2USD/m2).ThisunderscoresAssessment Three's superior energy efficiency and effective system optimizations.KeyfactorscontributingtoAssessmentThree's performance include its high window-to-wall ratio, which enhances natural day lighting and reduces reliance on artificial lighting. Historical analysis of the model reveals ongoing improvements that have consistently enhanced its energy performance. Strategic building orientation further enhances Assessment Three's efficiency, optimizing lighting, airflow, and overall sustainability. This is evident in its superior metrics for daylight utilization, occupancy control, plug load efficiency, and HVAC efficiency, all of which contribute to operational efficiency and sustainability. Financially, the lower operational costs of Assessment Three highlight its long-term cost-effectiveness and potential for substantial savings. This study provides valuable insights for future building designs, emphasizing the importance of optimized ratios, strategic orientation, and integrated efficiencies to achieve superior energy performance and occupant comfort. In conclusion, Assessment Three sets a benchmarkforsustainablebuildingpractices,showcasingthe benefits ofstrategicdesignandefficientsystemsinachieving exceptionalenergyperformanceandoperationalexcellence.
Key Words: Energy efficiency, Sustainability, Building optimization,BIM,Revit,Insight
Intheever-evolvinglandscapeofsustainabledevelopment and environmental consciousness, the built environment standsasapivotalarenaforinnovationandtransformation. Associetiesgrapplewiththechallengesofclimatechange, resource depletion, and escalating energy costs, the imperative for energy-efficient building design and operationhasneverbeenmorepressing.Inresponsetothis imperative, the integration of advanced technologies and
methodologieshasemergedasacornerstoneinthepursuit of sustainable building practices. Central to this paradigm shift is the utilization of Building Information Modeling (BIM),arevolutionaryapproachthattranscendstraditional architecturaldesignprocessesbyenablingcomprehensive digitalrepresentationsofbuildingprojects.Attheforefront of this technological revolution is Autodesk Revit 2022, a powerful BIM software suite renowned for its versatility, efficiency,and robustanalytical capabilities.Coupledwith the cutting-edge insights provided by Insight 2022, Revit 2022 empowers architects, engineers, and building professionals to not only visualize and design intricate building structures but also to analyze, optimize, and streamline their energy performance with unprecedented precisionandinsight.Againstthisbackdrop,thisresearch endeavor embarkson a comprehensive exploration of the energy analysis capabilities afforded by Revit 2022 and Insight2022,withaparticularfocusontheirapplicationin thecontextofsustainablebuildingdesignandoperation.By delvingintotheintricaciesofthesesoftwaretools,thisstudy seeks to unravel the full spectrum of functionalities, methodologies,andbestpracticesavailabletopractitioners in their quest to create energy-efficient, environmentally sustainablebuiltenvironments.
2395-0056
Volume: 11 Issue: 07 | July 2024 www.irjet.net p-ISSN: 2395-0072
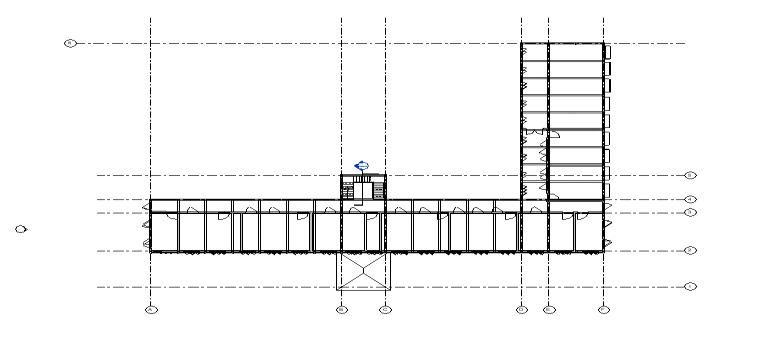
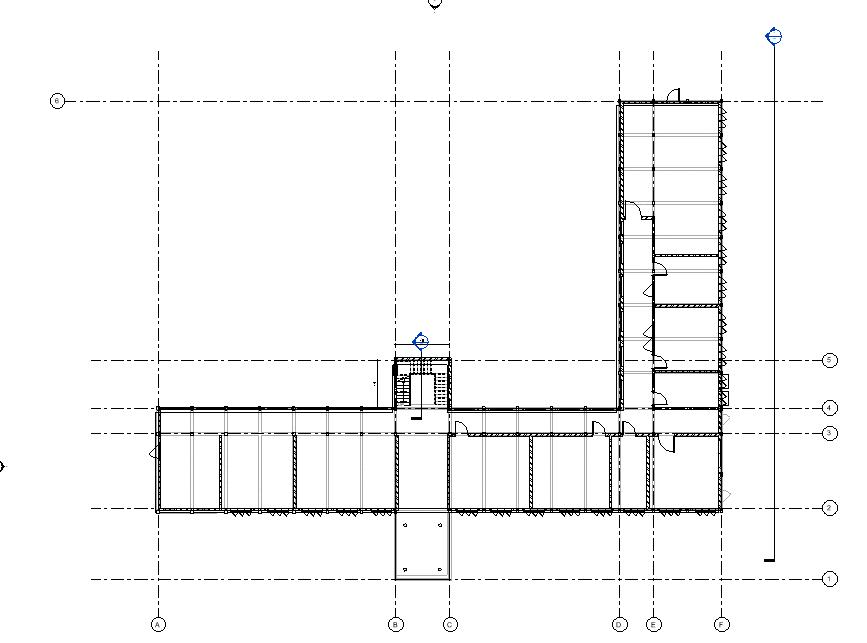
IntegratingsurveyedbuildingdataintoRevit2020forthree different floors involves a systematic approach from data collectiontofinalmodelcreation.Initially,detailedsurveys usingadvancedtoolslikelaserscannersandtotalstations captureprecisemeasurementsofthebuilding'sstructural elements.These measurementsareprocessed togenerate accurateplandrawingsthatserveasthebasisformodeling in Revit. Importing these drawings into Revit allows for direct plotting of the surveyed data, ensuring the threedimensional models accurately represent the physical attributesofeachfloor.Challengessuchasdataalignment and accuracy verification were addressed through meticulousqualitycontrolmeasuresduringboththesurvey andmodelingphases,ensuringthereliabilityandusabilityof thefinalBIMmodels.
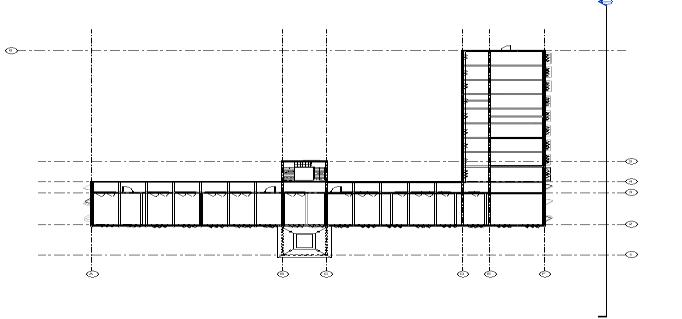
1.2 MODELING
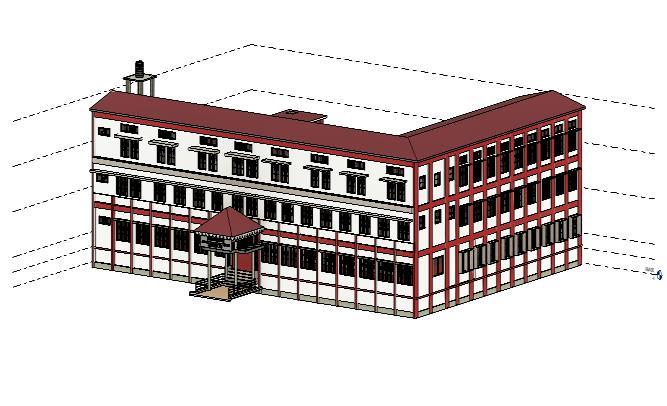
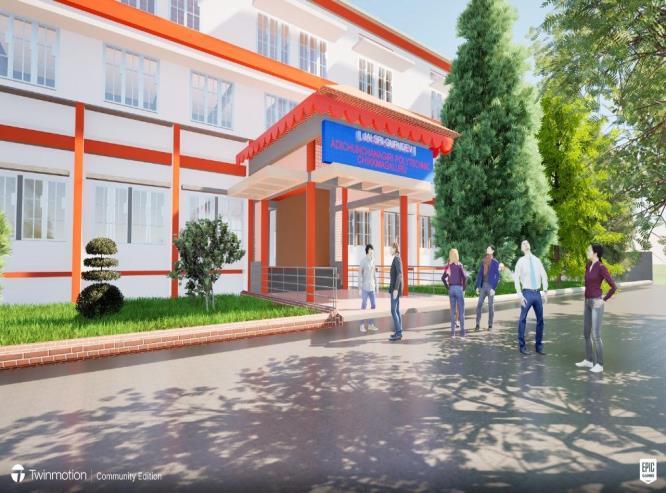
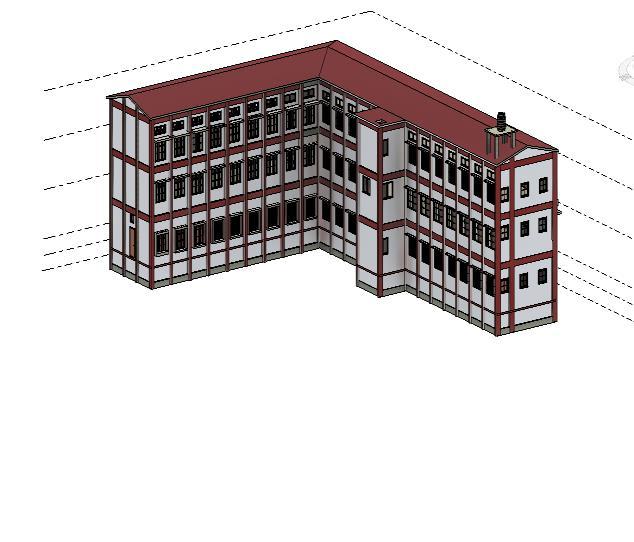
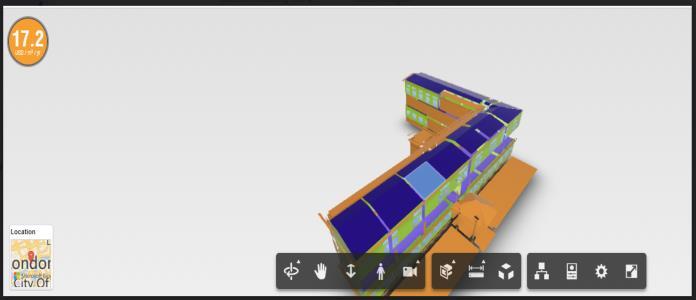
Usingthesurveyedbuildingdata,weproceededtomodel the structure in Revit 2022 software while maintaining consistencywiththearchitecturaldimensionsderivedfrom the plan drawings. This process involved importing the detailed measurements obtained during the survey phase into Revit 2022We ensured that the structural elements, such as walls, columns, and openings, were accurately represented in the digital models to reflect the physical reality observed in the field. By aligning the modelled elements with the architectural dimensions from the plan drawings,weaimedtocreatecohesiveandaccuratethreedimensional representations of each floor within the building.Thisapproachnotonlyfacilitatedthevisualization ofthebuilding'sstructurebutalsoenhancedtheefficiency andprecisionoffuturedesignandrenovationprocesses.In additiontomodelingthestructureinRevit2022,wefurther enhanced the project by rendering the models using Twinmotion. This step was crucial in providing a more immersive and realistic perspective of the building. Twin motion’scapabilitiesallowedustoapplytextures,lighting effects, and environmental elements to the Revit models, thereby creating compelling visualizations that closely simulatereal-worldconditions
International Research Journal of Engineering and Technology (IRJET) e-ISSN: 2395-0056
Volume: 11 Issue: 07 | July 2024 www.irjet.net p-ISSN: 2395-0072
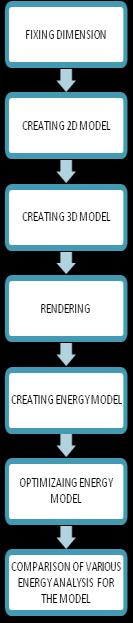
7: Flowchart of Methodology
Themethodologybeganwithfixeddimensionsfromdetailed surveys, followed by creating 2D and 3D models in Revit. RenderingenhancedvisualizationsusingTwinmotion.An energymodelwasthenbuiltwithinRevit,optimizingfactors like materials and HVAC systems for efficiency. Various energyanalyseswereconductedtocomparescenariosand inform sustainable design decisions, aiming to minimize environmental impact and operational costs while maximizingbuildingperformance.
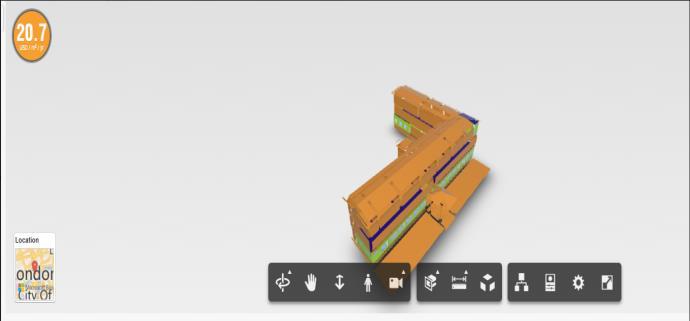

TheseresultsindicatethatAssessmentThreehasthelowest energycostpersquaremetercomparedtoAssessmentsOne andTwo.ThissuggeststhatAssessmentThreepotentially hassuperiorenergyefficiencymeasuresorbetterutilization ofenergysystems,leadingtoloweroperationalcosts.
AssessmentThreeexhibitsasuperiorwindow-to-wallratio comparedtoAssessmentsOneandTwoinalldirections.This indicatesthatAssessmentThreehasoptimizedthebalance between windows (day lighting and views) and walls (insulation and structural integrity), likely contributing to betterdaylightingandreducedrelianceonartificiallighting.
International Research Journal of Engineering and Technology (IRJET) e-ISSN: 2395-0056
Volume: 11 Issue: 07 | July 2024 www.irjet.net p-ISSN: 2395-0072
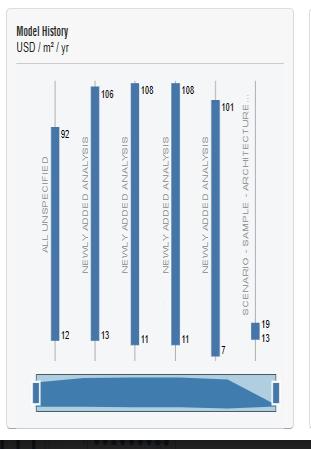
Thegraphicalpresentationofmodelhistoryprovides insights into the evolution of the building design. It helps in understanding the iterative improvements made over time, potentially highlighting design decisionsthatledtoenhancedenergyperformanceand overallefficiency.
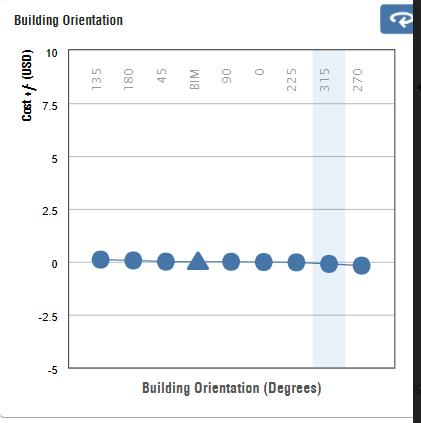
The tabulated data on building orientation shows that improvedlighting,airflow,andsustainabilitywereachieved throughoptimalorientation.ThisimpliesthatAssessment Three, which likely benefited from better orientation strategies,enjoysnaturaladvantagessuchasreducedsolar heat gain, improved natural ventilation, and enhanced naturallightingconditions
International Research Journal of Engineering and Technology (IRJET) e-ISSN: 2395-0056
Volume: 11 Issue: 07 | July 2024 www.irjet.net p-ISSN: 2395-0072
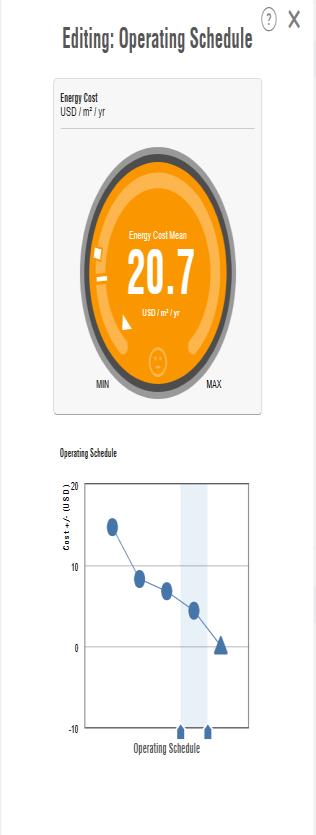
AssessmentThreeoutperformsAssessmentsOneandTwoin severalkeyaspectsDaylightandOccupancyControlLikely duetosuperiorwindowplacementandcontrolsystems.Plug LoadEfficiency Efficientuseofelectricaloutletsanddevices. OperatingScheduleandPanelEfficiencyOptimalscheduling ofoperationsandefficientelectricalpanels.VACEfficiency Effectiveheating,ventilation,andairconditioningsystems management. These factors collectively contribute to Assessment Three achieving superior overall building performance.Lowerenergycosts,enhancedcomfortthrough betterdaylightingandventilation,andefficientoperationof systemshighlightAssessmentThreeasthepreferreddesign optionfromanenergyandsustainabilityperspective.
the results emphasize that Assessment Three not only achieveslowerenergycostsbutalsodemonstratessuperior environmentalperformancethroughoptimizedwindow-towall ratios, strategic building orientation, and efficient system operations. These findings are crucial for making informeddecisionsinbuildingdesignandenergyefficiency improvements. the comprehensive analysis of energy benchmarks,window-to-wallratios,modelhistory,building orientation, and overall performance metrics consistently highlight Assessment Three as the optimal choice. Its superiorenergyefficiency,achievedthroughstrategic design decisions and operational optimizations, not onlylowers
International Research Journal of Engineering and Technology (IRJET) e-ISSN: 2395-0056
Volume: 11 Issue: 07 | July 2024 www.irjet.net p-ISSN: 2395-0072
Operational costs but also enhances comfort and sustainability.Thesefindingsunderscoretheimportanceof integrateddesignapproachesandcontinuousimprovement inbuildingperformanceassessments.
Basedontheprojectanalysis,AssessmentThreestandsout withthelowestoperational costs persquaremeter 12.4 USD/m2comparedto20.7USD/m2forAssessmentOneand 17.2 USD/m2 for Assessment Two. This highlights AssessmentThree'ssuperiorenergyefficiencyandeffective
system optimizations. Assessment Three also features a superior window-to-wall ratio, enhancing natural day lighting and reducing reliance on artificial lighting. The modelhistoryanalysisshowscontinualimprovementsthat have refined its energy performance over time. Strategic building orientationfurther enhancesAssessment Three's performance, improving lighting, airflow, and overall sustainability.Thisalignswithitssuperiorperformancein key operational metrics such as daylight and occupancy control, plug load efficiency, and HVAC efficiency, contributing to overall operational efficiency and sustainability. Financially, Assessment Three's lower operationalcostsunderscoreitslong-termcost-effectiveness and potential for significant savings. The project provides valuable insights for future building designs, emphasizing optimized ratios, effective orientation, and integrated efficienciesforenhancedenergyperformanceandoccupant comfort.Inconclusion,AssessmentThreesetsabenchmark for sustainable building practices, demonstrating the benefitsofstrategicdesignandefficientsystemsinachieving superiorenergyperformanceandoperationalexcellence.
[1] ASchlueter,F.Thesseling,"BuildingInformationModel basedenergy/energyperformanceassessmentstudyin the early design stages", in Institute of Building Technologies, Building Systems Group, ETH Zurich, Switzerland 2008 Elsevier. http://dx.doi.org/10.1016/j.autcon.2008.07.003.
[2] P.Capone,V.Getuli,andT.Giusti,“Constructabilityand safety performance based design: a design and assessment toolfor the building process,”inThe 31st InternationalSymposiumonAutomationandRobotics inConstructionandMining(ISARC2014)
[3] Svetlana Olbina, Thomas Reeves, Raymond Issa, ValidationofBuildingEnergyModelingTools:Ecotect™, Green Building Studio™ and IES™, Proceedings of the 2012WinterSimulationConference.
[4] A. Pinto, “Life cycle assessment applied to the environmental and energy analysis of buildings”. InstitutoSuperiorTécnico,ofUniversidadeTécnicade Lisboa,2008.PhDthesis
[5] L. Tronchin, K. Fabbri, Energy performance building evaluation in Mediterranean countries: Comparison between software simulations and operating rating simulation,EnergyandBuildings40(2008)1176–1187.
International Research Journal of Engineering and Technology (IRJET) e-ISSN: 2395-0056
Volume: 11 Issue: 07 | July 2024 www.irjet.net p-ISSN: 2395-0072


Mr.ThanupNT
HODDept.ofCivilEngineering
AdichunchanagiriPolytechnic Chikkamagaluru-577102
NikhilGR
DiplomainCivilEngineering
AdichunchanagiriPolytechnic Chikkamagaluru-577102
KumarSwamyMS
DiplomainCivilEngineering
AdichunchanagiriPolytechnic Chikkamagaluru-577102
SheikMohammedZain
DiplomainCivilEngineering
AdichunchanagiriPolytechnic Chikkamagaluru-577102