
International Research Journal of Engineering and Technology (IRJET) e-ISSN: 2395-0056
Volume: 11 Issue: 07 | July 2024 www.irjet.net p-ISSN: 2395-0072

International Research Journal of Engineering and Technology (IRJET) e-ISSN: 2395-0056
Volume: 11 Issue: 07 | July 2024 www.irjet.net p-ISSN: 2395-0072
Nazmus Sakib Ahmed
Graduate Research Assistant, Iowa State University ***
Abstract - Thisresearchfocusesondevelopingpavement performancepredictionmodelsusingregressionmethods, examiningtwodistinctclimatezones,Dry-Non-Freezeand Wet-Freeze, and utilizing data from the Long-Term PavementPerformance(LTPP)program.Thisresearchaims to identify and analyze factors affecting pavement performance. The study investigates three main types of pavement distress: roughness (International Roughness Index), rutting, and alligator cracking, which significantly influence the overall pavement condition. The research assessestheimpactofseveralvariablesobtainedfromthe Literature Review on pavement performance, which are expected to affect pavement performance by applying multiple linear and logistic regression models. Multiple linearregressionmodelswereusedforpredictingpavement roughness and rutting, while logistic regression was used topredicttheoccurrenceofalligatorcracking.Findingsfrom this comprehensive analysis are expected to provide actionable insights that can optimize pavement design, construction, and maintenance practices, ultimately enhancingroadsafetyandextendingpavementlifeacross differentenvironmentalconditions.
Key Words: InternationalRoughnessIndex(IRI),Rutting, Alligator Cracking, Pavement Performance Modelling, MultipleLinearRegression,LogisticRegression
Pavementdamageisacriticalissuerapidlyincreasingdueto variousfactors.Thedeteriorationofpavementsovertimeis a complex process influenced by multiple variables, including vehicle loads, structural capacity, materials, constructionquality,andenvironmentalconditions.Among thesefactors,heavyvehicleloads,andinsufficientstructural capacity of pavements have been identified as significant contributorstopoorroadconditions.Toaddressthisissue, researchershavebeenfocusingonunderstandingtheeffects ofthesefactorsonpavementperformance,withthegoalof developing effective strategies for pavement preservation andlifeextension(Bhandari,Luo&Wang2023).
Thisstudyfocusesonthreeprimarytypesofdistressusedas performancemeasuresofroadconditions:alligatorcracking, rutting,androughness.Alligatorcrackingisfatiguecracking that appears as interconnected cracks resembling an alligator’sskinpattern.Ruttingisalongitudinaldepression
along the wheel paths caused by the accumulation of permanentdeformationinthepavementlayers.Roughness, on the other hand, refers to the irregularities in the pavement surface that affect ride quality and safety. Pavement Roughness is known as the International RoughnessIndex(IRI).Understandingthedevelopmentand extentofthesedistressesiscrucial foreffectivepavement managementandmaintenancedecision-making(Bhandari, Luo&Wang2023).
Themainobjectiveofthisstudyistodevelopmultiplelinear regression and logistic regression models to predict the pavement performance and understand the variables that affectpavementperformanceintwodifferentclimatezones (i.e.,Dry-Non-FreezeandWet-Freezeclimatezones)ofUSA. Thisresearchutilizespavementperformancedatafromthe Long-TermPavementPerformance(LTPP)Program,witha primary focus on Specific Pavement Studies (SPS-1). The LTPPdataispubliclyaccessibleandcanbedownloadedfrom the LTPP InfoPave website. The SPS-1 experiment is designed to investigate the effects of various structural factorsontheperformanceofflexiblepavements,including the base type, hot mix asphalt concrete (HMAC) layer thickness, base layer thickness, traffic loading, age, and environmental conditions such as precipitation and temperature.
In summary, this comprehensive study investigates the factorsaffectingpavementroughness,rutting,andalligator crackingbyutilizingmultiplelinearregressionandlogistic regressionmodelsandtheextensiveLTPPSPS-1dataset;the researchersaimtoprovideactionableinsightsthatcanhelp optimizepavementdesign,construction,andmaintenance practices, ultimately leading to improved road conditions andextendedpavementlife.Thefindingsofthisstudyare expected to contribute to understanding the factors that affectpavementperformanceintwodifferentclimatezones oftheUSA.
Pavement condition data is essential for evaluatingthestructural health and serviceabilityof road pavements. Accuratedatacollectionrequiresassessingboth thepavementsurfaceandstructuralcondition,aspavement structural condition cannot be predicted based on the pavementsurfacecondition(Ahmedetal.,2022).Tomake informed pavement maintenance decisions, it is crucial to
International Research Journal of Engineering and Technology (IRJET) e-ISSN: 2395-0056
Volume: 11 Issue: 07 | July 2024 www.irjet.net p-ISSN: 2395-0072
gather data on both functional and structural conditions (Huynh et al., 2021). Pavement data is categorized into various metrics such as Ride Quality, Distresses, and Structural Integrity, which comprehensively assess pavementcondition.Specifically,RideQualityreferstothe smoothnessofthepavementsurfaceasexperiencedbyroad users. Rutting and Cracking, significant indicators of pavementdistress,quantifytheextentofdeformationalong wheelpathsandtheoccurrenceofcracksinthepavement surface, respectively. These indicators are critical for maintaining road safety and optimizing maintenance interventions. Pavementqualityindicatormetricsused by thisresearch(Hafez,2019)arementionedbelow:
The Pavement Roughness Index measures ride quality, reflectingdistortionsalongtheroadsurfaceinthedirection oftravel.Assuch,higherlevelsofpavementroughnessresult inreducedridequality.TheInternationalRoughnessIndex (IRI),establishedbySayersetal.in1986,isthemostused metricforassessingthisroughness.Itcalculatesroughness by dividing the total suspension travel of a vehicle by the distance covered, with results expressed in meters per kilometer/inchespermile.Consequently,greaterIRIvalues indicateincreasedroadroughness.
Rutting,characterizedbypermanentdeformationsalongthe wheel paths of pavement, is primarily influenced by high temperatures and the properties of the asphalt binder. Typically,ruttingoccursduringwarmerseasonswhenthe asphalt binder becomes softer, allowing the pavement to deform under the pressure of the vehicular load. The Superpave Performance Grading (PG) System evaluates asphaltbindersbasedontheirabilitytoresistruttingand withstand low-temperature cracking (NCHRP, 2011). Variousmethodologiesareemployedtomeasurerutdepth, with the 3-sensor and 5-sensor rut bars being the most prevalent.Thesedevicesaremountedonthefrontbumper of a van, enabling the collection of rut measurements at highway speeds. Rut depth can then be determined using edgeorstring-linemethods(ChenandLi,2008).
Alligator or fatigue cracking appears as interconnected cracksresultingfromfatiguefailureoftheasphaltconcrete (AC) surface. This type of failure typically arises due to repeatedtrafficloads.Thecrackingbeginsatthebaseofthe ACsurfaceorstabilizedbase,wheretensilestressandstrain aremaximizedundertheloadofawheel.Initially,thecracks appearasparallellines,butwithcontinuoustrafficloading, theselines intersect, creating many-sided, sharp-angled fragments that resemble an alligator’s skin. Alligator crackinginitiallyoccursinareasexposedtorepeatedtraffic, suchaswithinwheelpaths,andisasignificantindicatorof
structural distress. The extent of alligator cracking is quantifiedbymeasuringtheaffectedareainsquarefeetor squaremeters.Table1showsdifferentCrackingtypesand theunitsforAsphaltConcretePavement.
AlligatorCracking SquareMeters
BlockCracking SquareMeters
EdgeCracking Meters
LongitudinalCracking Meters
TransverseCracking Meters
Severalstudieshavedevelopedpavementperformance models using the multiple linear regression model. For instance,Rahmanetal.(2017)developedmultiplelinear regressionmodelstopredictthefourdifferentpavement performance indicators: Pavement Quality Index (PQI), PavementServiceIndex(PSI),PavementDistressIndex (PDI), and International Roughness Index (IRI). The independent variables were the Average Annual Daily Traffic (AADT), Free Flow Speed (FFS), precipitation, temperature, and soil type. Abdelaziz et al. (2018) proposed a multiple linearregression model to predict theIRIusingpavementage,initialIRI,transversecracks, alligatorcracks,andstandarddeviationofrutdepth.This researchlistedsomeotherstudiesthatusedvariousinput variables to predict the IRI, such as age, initial IRI, distress,climate(Precipitation,Freezing–Precipitation, andPrecipitation-Temperature),soilparameters,traffic (ESAL), and structural parameters (Structural Number, Asphalt Thickness, Structural Number – Deflection, Structural Number – Percent Asphalt Concrete, and Structural Number – Construction Number). Similarly, Elhadidyetal.(2018)predictedIRIusingvariouspavement distresses (i.e., Fatigue Cracking, Edge Cracking, Block Cracking, Longitudinal Cracking, Transverse Cracking, Patching, Potholes, Shoving, Bleeding, Polished Aggregate, Rutting,andRaveling)astheinputvariables.
This research aims to enhance our understanding of pavement performance across two different climatic conditions, contributing to more effective pavement management and maintenance strategies in two different climatezones.Theobjectivesofthisresearchareoutlinedas follows:
Development of Pavement Roughness Prediction
Models:Thisstudyaimstodevelopaccuratepavement roughness(InternationalRoughnessIndex)prediction modelsfortwodistinctclimatezones:Dry-Non-Freeze
International Research Journal of Engineering and Technology (IRJET) e-ISSN: 2395-0056
Volume: 11 Issue: 07 | July 2024 www.irjet.net p-ISSN: 2395-0072
andWet-Freeze.Themodelswillbeconstructedusing multiple linear regression techniques, enabling us to understandthefactorsaffectingpavementroughnessin twodifferentclimatezones.
Development of Pavement Rutting Prediction Models:Thisresearchseekstocreatereliablemodels for predicting pavement rutting within the same two climatezones.Utilizingmultiplelinearregression,this objectivefocusesonunderstandingthefactorsaffecting pavementruttingintwodifferentclimatezones.
Development of Alligator Crack Prediction Models: The third objective of this research is to develop prediction models for alligator cracking For this purpose,logisticregressionwillbedevelopedtopredict theoccurrenceandextentofalligatorcrackinginboth the Dry-Non-Freeze and Wet-Freeze Zone. This approach will help identify the probability of such cracksoccurringintwodifferentclimatezones.
The hypotheses of this research are clearly and comprehensivelyoutlinedbelow.Eachhypothesisisdefined to explore specific aspects of the research question, providingastructuredframeworkforinvestigation.
4.1 Pavement Roughness Prediction Hypothesis:
Hypothesis 1: The factors affecting pavement roughnessdiffersignificantlybetweenDry-Non-Freeze andWet-Freezeclimatezones.
Hypothesis 2: Multiple linear regression models can accurately predict pavement roughness in Dry-NonFreeze and Wet-Freeze climate zones using relevant variablesexpectedtoaffectthepavementperformance.
4.2 Pavement Rutting Prediction Hypothesis:
Hypothesis 1: There are distinct predictors of pavement rutting that vary between Dry-Non-Freeze andWet-Freezeclimatezones.
Hypothesis 2: Multiple linear regression models can effectivelypredicttheextentofpavementruttingintwo different climate zones using relevant pavement historicalinformationandtrafficloadfactors.
4.3 Pavement Alligator Crack Prediction
Hypothesis:
Hypothesis 1: The probability and extent of alligator cracking are influenced by specific factors and differencesobservableamongthevariablesintheDryNon-FreezeandWet-Freezezones.
Hypothesis 2:Logisticregressionmodelscanreliably predicttheoccurrenceofalligatorcracking,providinga
probabilisticassessmentofpavementdeteriorationin varyingclimateconditions.
ThisresearchutilizeddatafromtheLong-TermPavement Performance (LTPP) program to predict the International Roughness Index (IRI), rutting, and alligator cracking in asphalt concrete pavements. The LTPP is managed by the Federal Highway Administration (FHWA) and was establishedundertheStrategicHighwayResearchProgram. TheLTPPdatabaseservesasapivotalreferenceinpavement research due to its extensive and comprehensive data collection. However, one notable challenge with the LTPP dataisthepresenceofasignificantnumberofmissingvalues forcertainvariables,whichcouldimpacttherobustnessof predictive analyses. Despite this issue, the LTPP database remains a valuable long-term resource for employing advanced analytics in pavement management, providing critical insights that aid in the enhancement of pavement durability and performance. Table 2 describes the description of the several Data Items of the LTPP data (Damirchiloetal.2021).
Table – 2: LTPPDataDescriptionTable(Bhandari,Luo& Wang2023)
DataItem LTPPtable TableDescription LTPP–Section Inventory EXPERIMEN T_SECTION Identifiestestsectionsand pavementstudyprograms
Maintenanc e Information CONSTRUCT ION_EVENTS _EXP
Maintenanceandrehabilitation detailsincludingdatesand typesofworkperformed Average Annual
DailyTruck Traffic TRF_TREND RecordsAADTTforvehicle classificationsrangingfrom4to 13
Annual Estimated SingleAxle Load
Longitudina lProfile (IRI)
TRF_TREND EstimatesannualESAL (EquivalentSingleAxleLoad) forvehicleclasses4through13
MON_HSS_P ROFILE_SEC TION Containsvaluesforthe roughnessindex Transverse Profile (Rutting) MON_T_PRO F_INDEX Containsvaluesforpavement rutting
Manual Distress MON_DIS_AC _REV Documentssurveydatesand measuresareasofalligator crackingacrossvariousseverity levels.
Layer Thickness
TST_L05B Detailingpavementlayertypes, thicknesses
Precipitatio n MERRA_TEM P_YEAR
Temperatur e MERRA_TEM P_YEAR
Recordsannualprecipitation dataattheMERRA-2cell centroid.
Measuresyearlyair temperature2metersabovethe MERRA-2cellelevation
International Research Journal of Engineering and Technology (IRJET) e-ISSN: 2395-0056
Volume: 11 Issue: 07 | July 2024 www.irjet.net p-ISSN: 2395-0072
Table3detailstheunitsofmeasurementforvariablesused in the explanatory data analysis and model development. Thistablecategorizeseachvariableanditscorresponding unit, providing a clear quantification framework for analyticalpurposes.Theselectionofvariablesisprimarily informed by literature reviews, focusing on those significantlyinfluencingpavementperformance.Here,some variablesarediscussedinmoredetail:
Initial IRI: Thisistheroughnessvaluerecordedatthe onset of data collection for each pavement segment. Previous research has highlighted the importance of using the Initial IRI for developing IRI prediction models.
Time since initial measurement: This variable measuresthedurationbetweentheinitialassessmentor recordingofapavement'sconditionandasubsequent evaluation.
Pavement Age: Determinedbysubtractingtheyearof lastpavementrehabilitation/maintenancefromtheyear ofdatacollection,thisvariablereflectsthetimeelapsed sincethelastsignificantpavementintervention.
Layer Thickness (Surface and Base): Thesevariables indicate the thickness of thepavement'ssurface and base layers, which are critical for assessing the structuralintegrityanddurabilityofthepavement.
AADTT (Annual Average Daily Truck Traffic): This measureindicatesthedailyaveragenumberoftrucks that travel over a particular section of pavement, reflectingtheintensityofheavyvehicletraffic.
ESAL (Equivalent Single Axle Load): This variable quantifiesthewearandtearcausedonthepavementby traffic, calibrated to the damage typically caused by a singleaxleload.
Table - 3: Unitsofthevariables
Variables
IntitialIRI
Rutting mm
AlligatorCracking SquareMeters
TimeSinceInitialMeasurement Years
PavementAge Years
SurfaceLayerThickness inch
BaseLayerThickness inch
AADTT(AnnualAverageDailyTruck Traffic) Unitsoftrucksper day
ESAL(EquivalentSingleAxleLoad)
18,000lb(80kN) equivalentsingle axleload(ESAL)
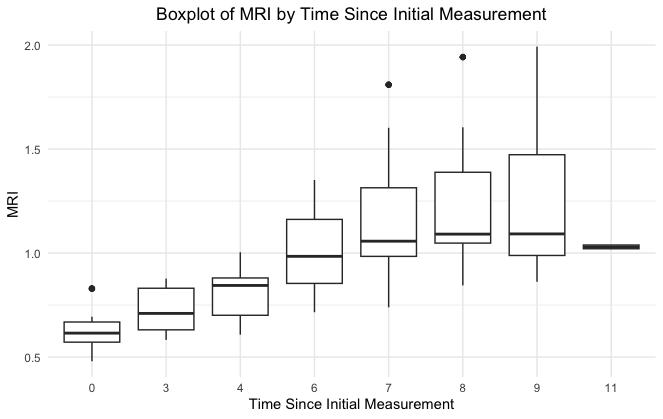
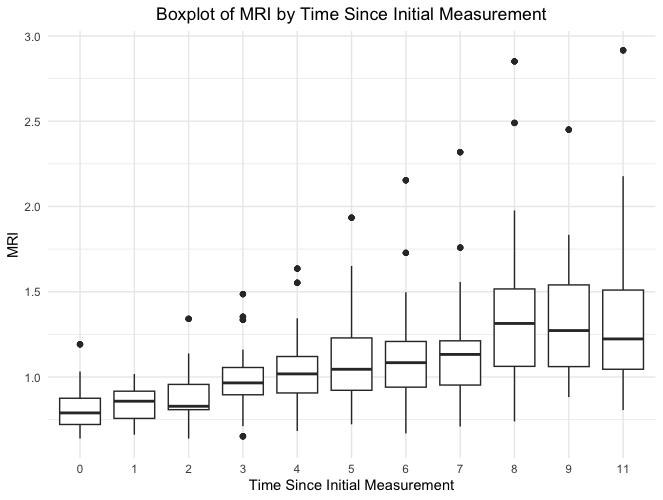
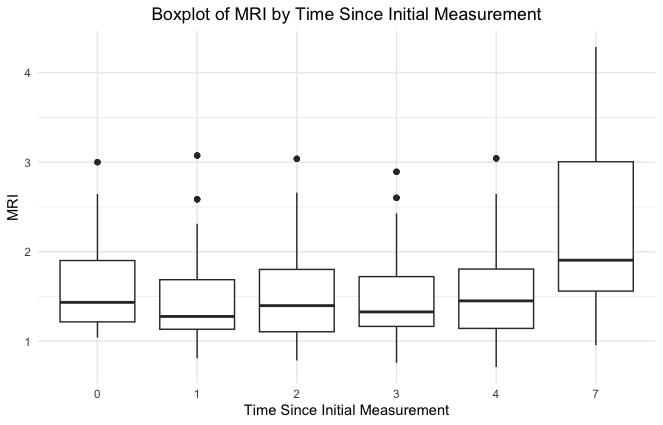
Figures 1 to 5 present a series of visualization plots demonstrating how pavement deteriorates over time and withage.Figures1through3specificallyillustratethatthe International Roughness Index (IRI) tends to increase as timeprogresses,acrosstwodistinctclimatezones,indicating a correlation between time and increased pavement roughness.Figures4and5,ontheotherhand,focusonthe increasingpatternofrutting,showingthataspavementages, rutting depths also tend to increase. These visualizations utilizeboxplotstoeffectivelyshowcasevariationsandtrends atdifferenttimepointsandages,providingaclearstatistical summaryofIRIandRuttingintwodifferentclimatezones. This method of data presentation captures the variability withineachdataset,makingiteasiertoobservetheimpacts oftimeandenvironmentalfactorsonpavementconditions.
UsingSPS-1ExperimentData
UsingSPS-1ExperimentData
International Research Journal of Engineering and Technology (IRJET) e-ISSN: 2395-0056
Volume: 11 Issue: 07 | July 2024 www.irjet.net p-ISSN: 2395-0072
3:DescriptiveStatisticsofIRIinWet-FreezeZone UsingSPS-3ExperimentData
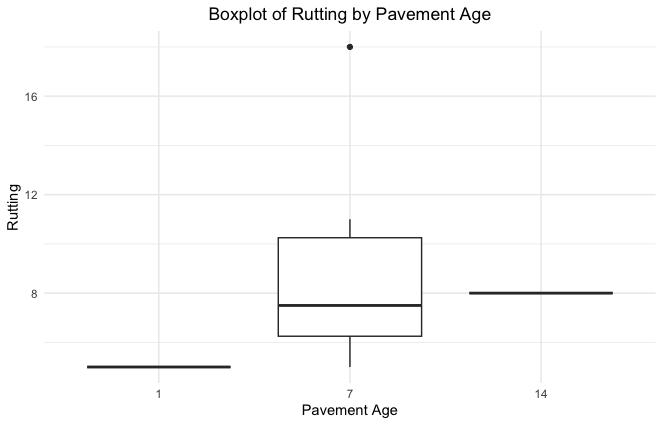
4:DescriptiveStatisticsofRuttinginDry-NonFreezeZoneUsingSPS-1ExperimentData
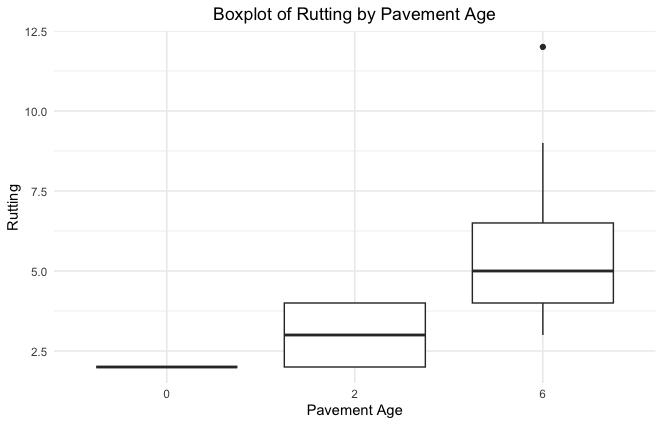
Figure5:DescriptiveStatisticsofRuttinginWet-Freeze ZoneUsingSPS-1ExperimentData
7. METHODOLOGY
This research developed two types of models i.) Multiple LinearRegressionii.)LogisticRegression
The objective of linear regression is to determine the relationshipbetweenoneormoreindependentvariables(X) with the dependent variable (Y). A linear regression that contains more than one variable is called multiple linear regression(Rahmanetal.,2017).StatisticalsoftwareRwas usedtodevelopMultipleLinearRegressionModel.
Theassumptions(Keith,2019)ofmultiplelinearregression areasfollows:
1. A linear relationship exists between the dependent variableandtheindependentvariables.
2. It is required to draw each observation independently from the population. This means that the errors for each observationareindependentfromthoseofothers.
3. There should be a constant dispersion for each observation of the independent variables around the regression line. This property is referred to as homoscedasticity.
4.Theerrorsarenormallydistributed.
5.Anyoftheindependentvariablesshouldnotbeinfluenced bythedependentvariable.
6. The independent variables are measured without any error.
Alogisticregressionisaspecialcaseofmultipleregression where the response variable (also known as dependent variable) has only two outcomes (Ahmed et al. 2022). Statistical software R was used to develop Logistic RegressionModel.Mathematically,itisexpressedas:
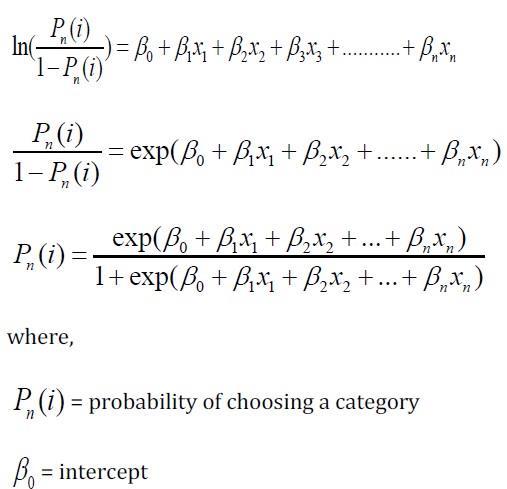
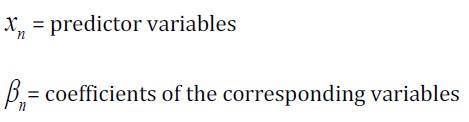
8.
Tables 4 to 10 present the results from multiple linear regression models for predicting the International Roughness Index(IRI) andrutting,andlogistic regression
International Research Journal of Engineering and Technology (IRJET) e-ISSN: 2395-0056
Volume: 11 Issue: 07 | July 2024 www.irjet.net p-ISSN: 2395-0072
models for predicting alligator cracking. In the multiple linear regression models, variable transformation of the outcomevariableIRIandRuttingwasconductedbyapplying logarithm.TheBackwardEliminationmethodwasemployed torefinetheseregressionmodels.Variablesthatwerenot statistically significant were systematically excluded, resultinginmodelsthatincorporateonlythosefactorsthat significantlyimpactthepredictions.
Table 4 shows that the initial IRI, time since initial measurement,andsurfacelayerthicknesswerestatistically significantvariablesfortheIRIpredictionmodelintheDryNon Freeze zone. Variables such as Base Layer Thickness, AnnualAverageDailyTruckTraffic(AADTT),andEquivalent SingleAxleLoad(ESAL)werenotfoundtobesignificant.The modelachievedanR2valueof0.68.
The analysis showed that initial IRI and time since initial measurement both havepositivecoefficient estimates, consistentwithfindingsfromtheliterature;theIRIincreases with initial roughness and time, reflecting expected pavementdeterioration.Conversely,thecoefficientestimate for surface layer thickness isnegative, aligning with engineeringlogicthatthickersurfacelayersresultinslower pavementdeterioration.Theregressionresultssupportthis logical interpretation, demonstrating a clear relationship betweenthesevariablesandpavementquality.
Table4:IRIpredictionmodelforDry-Non-FreezeZone (SPS–1experiment)
thickness in these models could be attributed to several factors. In Wet Freeze zones, conditions such as freezing temperatures and moisture penetration may cause pavementdeteriorationmorethansurfacethickness.Most importantly,thefreeze-thawcyclestypicalofsuchclimates canleadtoacceleratedmaterialdegradationandstructural failures,lessinfluencedbythesurfacelayer’sthicknessthan other factors. The R2 of the models are 0.63 and 0.70, respectively.
Table5:IRIpredictionmodelforWetFreezeZone(SPS–1 experiment)
Since Initial Measurement
Signif.codes: 0‘***’0.001‘**’
Residualstandarderror:0.09723on242degreesoffreedom
MultipleR-squared: 0.6325,AdjustedR-squared: 0.628 F-statistic:138.8on3and242
Table6:IRIpredictionmodelforWetFreezeZone(SPS–3 experiment)
Since Initial Measurement
Signif.codes: 0‘***’0.001‘**’0.01‘*’0.05‘.’0.1‘’1
Residualstandarderror:0.09107on82degreesoffreedom
MultipleR-squared: 0.6843,AdjustedR-squared: 0.6728
F-statistic:59.25on3and82DF, p-value:<2.2e-16
Tables5and6detailtheIRIpredictionmodelsfortheWet Freeze Zone using data from the SPS-1 and SPS-3 experiments.TheinitialIRI,timesinceinitialmeasurement and base layer thickness were identified as statistically significant variables in both cases. Conversely, other variables, including surface thickness, were found to be statistically insignificant. The insignificance of surface
Signif.codes: 0‘***’0.001‘**’0.01‘*’0.05‘.’
Residualstandarderror:0.1257on134degreesoffreedom
MultipleR-squared: 0.7036,AdjustedR-squared: 0.697
F-statistic: 106on3and134DF, p-value:<2.2e-16
Tables7and8presenttheruttingpredictionmodelsforthe Dry-Non-FreezeZoneandWet-FreezeZone,respectively.In the Dry-Non Freeze Zone, pavement age, surface layer thickness, and base layer thickness were identified as statisticallysignificantvariables.Thecoefficientestimatefor
International Research Journal of Engineering and Technology (IRJET) e-ISSN: 2395-0056
Volume: 11 Issue: 07 | July 2024 www.irjet.net p-ISSN: 2395-0072
pavement age ispositive, which aligns with literature findings and logically suggests that rutting increases as pavementsage.Conversely,thecoefficientsforsurfaceand base layer thickness are negative, indicating that thicker pavements exhibit less rutting deterioration. The model achieves a high R2 value of 0.90, indicating a good explanation of the variance in rutting by the included variables. As rutting can indicate pavement structural failure,trafficvariablessuchasEquivalentSingleAxleLoad (ESAL) and Annual Average Daily Truck traffic (AADTT) shouldbestatisticallysignificant.Still,thesevariableswere notstatisticallysignificantinthismodel,whichcouldbedue totheprotectiveeffectofthepavementstructureintheDryNon-Freeze Zone, where robust surface and base layers effectively distribute the load and mitigate the impact of traffic loads on rutting. As such, variations in ESAL and AADTT might not significantly influence rutting when the pavementstructureissufficientlyresilient.
FromtheruttingpredictionmodeldevelopedfortheWetFreezeZone,itwasfoundthatpavementageandEquivalent SingleAxleLoad(ESAL)arestatisticallysignificantvariables. ThemodeldemonstratesamoderateR2 valueof0.64.The significanceofpavementageandESALinthismodelcanbe attributed to their direct impact on pavement wear and deterioration. Age is critical as older pavements typically show more signs of rutting due to cumulative stress and material fatigue over time. ESAL, representing the traffic load, directly influences the rate at which rutting occurs; higher traffic volumes and heavier loads accelerate the deformationofthepavementsurface.Interestingly,surface and base layer thickness were not statistically significant variables in this model for the Wet-Freeze Zone.The probablereasoncouldbethatinenvironmentssubjectedto freeze-thawcycles,temperaturefluctuations,andmoisture ingress might have a more pronounced impact on the structuralconditionofpavementthanitsthickness.Freezing water can expand and cause damage to the pavement material,andrepeatedcyclescanexacerbatethiseffect.In suchscenarios,thematerialcompositionandquality,along with drainage and subgrade conditions, might play more significantrolesthansimplythethicknessofthesurfaceand baselayersinmitigatingrutting.
7:RuttingpredictionmodelforDry-Non-Freeze Zone(SPS–1experiment)
Signif.codes: 0
Residualstandarderror:0.1759on4degreesoffreedom
MultipleR-squared: 0.9044, AdjustedR-squared: 0.8327
F-statistic:12.61on3and4DF,p-value:0.01658
Table8:RuttingpredictionmodelforWetFreezeZone (SPS–1experiment)
Signif.codes:
Residualstandarderror:0.3391on13degreesoffreedom
MultipleR-squared: 0.639, AdjustedR-squared: 0.5835
F-statistic:11.51on2and13DF,p-value:0.001329
Table 9 shows the result of logistic regression model for alligatorcrackpredictionmodel.Fromthemodelresults,it wasfoundthatpavementage,surfacelayerthickness,and AADTTarestatisticallysignificantvariables.Theco-efficient fortheagevariableis0.647813,whichindicatesthatasthe pavement age increases by one year, the log odds of observing alligator cracking increase significantly, suggestingthatolderpavementsaremorelikelytoexhibit alligator cracking. The coefficient for Surface Layer Thicknessis-0.739545,whichindicatesthatanincreasein surfacelayerthicknessdecreasesthelikelihoodofalligator cracking, suggesting that thicker surface layers are protective against this type of damage. The negative coefficientforAADTT(AnnualAverageDailyTruckTraffic) in the logistic regression model, although statistically significant,isnotlogical,asitisexpectedthatheaviertraffic increases the likelihood of pavement damage such as alligatorcracking. Apossibleinterpretationcanbethatin areaswithhightrucktraffic,pavementsareoftendesigned to higher specifications and may receive more frequent maintenance to accommodate the heavy loads. This enhancedstructuralconditioncouldreducetheoccurrence of alligator cracking despite higher traffic volumes. Roads withhighertrafficandheavytrucksaregenerallydesigned with thicker or more robust pavement structures that effectivelydistributetheloadacrossthesurface.Thisdesign aspect could mitigate the impact of heavy traffic on thepavement’ssusceptibilitytoalligatorcracking.
International Research Journal of Engineering and Technology (IRJET) e-ISSN: 2395-0056
Volume: 11 Issue: 07 | July 2024 www.irjet.net p-ISSN: 2395-0072
Table9:AlligatorcrackpredictionmodelforDry-NonFreezeZone(SPS–1experiment)
Variable
Signif.codes: 0‘***’0.001‘**’0.01‘*’0.05‘.’0.1‘’1
(Dispersionparameterforbinomialfamilytakentobe1)
Nulldeviance:189.51on138degreesoffreedom
Residualdeviance:100.28on135 degreesoffreedom
AIC:108.28
FortheAlligatorcrackmodeldevelopmentforWetFreeze Zone, only pavement age variable was found to be statisticallysignificant.Theco-efficientfortheagevariableis 0.6824,whichindicatesthatasthepavementageincreases by one year, the log odds of observing alligator cracking increasesignificantly,suggestingthatolderpavementsare morelikelytoexhibitalligatorcracking.
Table10:AlligatorcrackpredictionmodelforWetFreeze Zone(SPS–1experiment)
occurs.Predictivemodelshelpprioritizemaintenanceand rehabilitationeffortsbyforecastingthefutureconditionof pavement sections. In addition, this allows for strategic allocation of limited resources, ensuring that budgets are usedefficientlytomaintainroadqualityandsafety.
Thesignificantfindingsobtainedfromtheaboveanalysisare documentedbelow:
InitialIRI,timesinceinitialmeasurement,andsurface layerthicknessarefoundtobeimportantpredictorsfor theIRIpredictionmodelintheDry-NonFreezezone
In Wet Freeze zones, initial IRI and time since initial measurement remain significant; however, base layer thickness rather than surface thickness plays a significant role, likely due to the dominant impact of freeze-thawcyclesoverstructuralfeatures.
In the Dry-Non Freeze zone, pavement age and the thickness of surface and base layers are found to be statistically significant variables for the rutting predictionmodel,indicatingthatthickerpavementsare lesspronetoruttingdespitevaryingtrafficloads.
FortheWet-FreezeZone,pavementageandESALare significantpredictors,emphasizingtheimpactofaging and traffic load on rutting. Surface and base layer thicknesses are less impactful, possibly due to environmentalconditionssuchasmoistureandfreezethaweffects.
IntheDry-NonFreezezone,pavementage,surfacelayer thickness, and AADTT significantly influence the occurrence of alligator cracking. Interestingly, higher AADTT does not increase cracking as expected, suggestingthatroadssubjectedtoheaviertrafficmaybe betterdesignedandmaintained.
In the Wet-Freeze Zone, only pavement age is a significantpredictorforalligatorcracking
Signif.codes: 0‘***’0.001‘**’0.01‘*’0.05‘.’0.1‘’1
(Dispersionparameterforbinomialfamilytakentobe1)
Nulldeviance:60.579on51degreesoffreedom
Residualdeviance:43.212on50degreesoffreedom
AIC:47.212
NumberofFisherScoringiterations:5
Thisresearchdevelopedpavementperformanceprediction modelsfortheInternationalRoughnessIndex(IRI),Rutting, andAlligatorcrackingusingtheLTPPdataintwodifferent climate zones (i.e., Dry-Non Freeze zoneand Wet Freeze zones). This research helped to understand the variables that affect the pavement performance in two different climatezones.Byunderstandingthesignificantpredictorsof pavementdeterioration,statedepartmentoftransportation can schedule maintenance before severe deterioration
[1] Abdelaziz, N., Abd El-Hakim, R. T., El-Badawy, S. M., & Afify, H. A. (2020). International Roughness Index predictionmodelforflexiblepavements. International Journal of Pavement Engineering, 21(1),88-99.
[2] Ahmed,N.S.,Huynh,N.,Gassman,S.,Mullen,R.,Pierce, C., & Chen, Y. (2022). Predicting pavement structural condition using machine learning methods. Sustainability, 14(14),8627.
[3] Bhandari,S.,Luo,X.,&Wang,F.(2023).Understanding the effects of structural factors and traffic loading on flexiblepavementperformance. InternationalJournalof TransportationScienceandTechnology, 12(1),258-272.
[4] Chen, D. H., & Li, Z. (2008). Comparisons of five computationalmethodsfortransverseprofiles. Journal of Testing and Evaluation, 36(5),473-480.
International Research Journal of Engineering and Technology (IRJET) e-ISSN: 2395-0056
Volume: 11 Issue: 07 | July 2024 www.irjet.net p-ISSN: 2395-0072
[5] Damirchilo,F.,Hosseini,A.,MellatParast,M.,&Fini,E.H. (2021). Machine learning approach to predict international roughness index using long-term pavementperformancedata. Journal of Transportation Engineering, Part B: Pavements, 147(4),04021058.
[6] Elhadidy,A.A.,El-Badawy,S.M.,&Elbeltagi,E.E.(2021). Asimplifiedpavementconditionindexregressionmodel for pavement evaluation. International Journal of Pavement Engineering, 22(5),643-652.
[7] Hafez,M.(2019). Comprehensively Optimized Pavement Management System for Low-volume Paved Roads. UniversityofWyoming.
[8] Huynh,N.,Gassman,S.,Mullen,R.,Pierce,C.E.,Chen,Y., & Ahmed, N. (2021). Utilization of Traffic Speed DeflectometerforPavementManagement (No.FHWA-SC21-04).SouthCarolina.Dept.ofTransportation.Officeof MaterialsandResearch.
[9] Keith,T.Z.(2019). Multiple regression and beyond: An introduction to multiple regression and structural equation modeling.Routledge.
[10] Rahman, M. M., Uddin, M. M., & Gassman, S. L. (2017). Pavement performance evaluation models for South Carolina. KSCE Journal of Civil Engineering, 21, 2695-2706.
[11] Sayers,M.W.(1986). Guidelines for conducting and calibratingroadroughness measurements.Universityof Michigan,AnnArbor,TransportationResearchInstitute.