
International Research Journal of Engineering and Technology (IRJET) e-ISSN: 2395-0056
Volume: 11 Issue: 07 | July 2024 www.irjet.net p-ISSN: 2395-0072

International Research Journal of Engineering and Technology (IRJET) e-ISSN: 2395-0056
Volume: 11 Issue: 07 | July 2024 www.irjet.net p-ISSN: 2395-0072
Mohitmuthu G R1 , Deepakraj M2 , Lohith R3, Praveen Kumar G4 , Dr. G.Vijayakumar 5
1,2,3,4 Student& PTU
5 Professor, Dept. of Civil Engineering, PTU, Puducherry, India
Abstract - Coastal areas, the place where the water of the sea meets the land are unique places. Coastal Zones are dynamic interface between land and water and are common locations of high-density development, therefore monitoring of these regions are of immense importance both in terms development and protection of coastal settlement and ecology. Protection may be provided by constructing coastal protection structures such as Sea wall, Groynes, Jetties and so on. This study examines the Shoreline changes that have occurred after the construction of groynes structures along the Puducherry Coastline (Kalapet to Bommiarpalayam) for a period of 3 months (January to April), A handheld GPS device has been used in this study to map the Shoreline changes and this data were then exported to a GIS software (ArcGIS) and were analyzed using DSAS Version 5.0 (Digital Shoreline Analysis System) developed by USGS (U.S. Geological Survey) to determine various factors such as Net Shoreline Movement (NSM), Shoreline Change Envelope (SCE), End Point Rate (EPR) and Linear Regression Rate (LRR) and Weighted Linear Regression (WLR) and evaluate the effects that the Groynes have had on the Shoreline. The use of GPS provides better accuracy compared to conventional surveying methods. Furthermore, Soil samples have also been collected on the lee side of the groyne to determine their sediment characteristics and fall velocity.
Key Words: Coastal Erosion, GIS, Sediment Transport, Groyne, DSAS.
This study focuses on the effects of Groyne field on the Puducherry Coastline. Coastal areas play a major role for the human beings from ancient time for trading, livelihood etc. Due to this phenomenon, rapid urbanization developed on the coastal area and developmental activities were conceded in order to fulfill the requirements of the settlements which have created a negative impact on the coast and its upland. These negative impacts include changes in shoreline such as erosion, seawater intrusion, shoreline modification etc. Coastal zone is increasingly under pressure from human activities such as fishing, sand mining, sewage disposal, urban expansion and tourism. SandminingandharvestingofMangroveshaveamajor negativeimpactonbeachstability,itgivestheresults of beach erosion and drastic shoreline change. To protect therecedingshorelinecoastalprotectionstructuresare
introduced such as Groynes, Seawall, Breakwater and Jetties
Coastline is the point of contact between land and water. Due to the rapid urbanization, they are constantly under pressure which leads to coastal erosion, sea water intrusion and shoreline modification. The coastline from Bommayapalayam to Kalapet has been victim to major coastal erosion which has negatively impacted the coastal ecology and coastal settlements. To protect the coastline fromfurthererosionandtoregainthelostcoastline groyne field were laid along this stretch to trap sedimentfromtravellinginthelongshoredirection.
Coastal erosion not only affects the coastline but alsotheCoastalsettlementsandCoastalecology.Ifit isnotmonitoredandmaintainedproperly,theywill haveadevastatingimpactandhaveamonetarycost to rehabilitate the coastline. The factors affecting coastal process include activities such as Fishing, Sandmining,Sewagedisposal,urbanexpansionand tourism.Thisaffectsthenaturalprocessofthecoast and cause coastal erosion. Seawater intrusion and shoreline modification. Coastal erosion not only affectsthecoastlinebutalsotheCoastalsettlements and Coastal ecology. If it is not monitored and maintained properly, they will have a devastating impact and have a monetarycost torehabilitate the coastline.
To prevent Coastal erosion, Coastal protection structures have been introduced. These include structures such as Groyne, Seawall, Jetties and Breakwater. Each has different use case depending upon the location and requirement. Our study focusesonGroynestructuresandtheireffectiveness inPuducherrycoastline.
Volume: 11 Issue: 07 | July 2024 www.irjet.net p-ISSN: 2395-0072
• The Shoreline change and Impact of coastal protection structures have been determined using Satelliteimages.
• DSAS (Digital Shoreline Analysis Software) has beenusedtodetermineboththeshorttermandlongtermchanges.
• DSAS (Digital Shoreline Analysis Software) has beenusedendpointratequantified
•ThestudystatesthatthecombinationofSatellite data along with statistical method prove to be reliable.
•Erosionmeasuredwasmorethanpredicteddue tonaturalandman-madecauses.
• Factors such as Beach changes, Sediment transportandStormimpactareanalyzed.
• GPS techniques are faster and provide better accuracythanconventionalsurveymethods.
• GPS techniques prove to be suitable for monitoring the real -time shoreline change accurately.
• Construction of Pier without considering its impactsleadstotheerosionofthecoastline.
• Monitoring of coastline after implementation of thecoastalprojecthastobeperformed.
• The management strategy stated will help the engineers to manage the coastal zone during and afterthecompletionofcoastalrelatedprojects.
•Thehydrodynamicprocessesandmorphological stability near the groin are studied using field observationsandbathymetricdata.
•Thenumericalmodelresultswerevalidatedand foundtobeingoodagreementwiththefielddata.
• Theoutcomeofthis researchdemonstratesthat studies similar to ours should be carried out in different parts along the vast Indian coastline to understandtheshoreline-evolution.
Inthisprojectwehaveuseddatacollectedfrom GPS,open-sourcedataandINCOISdata.
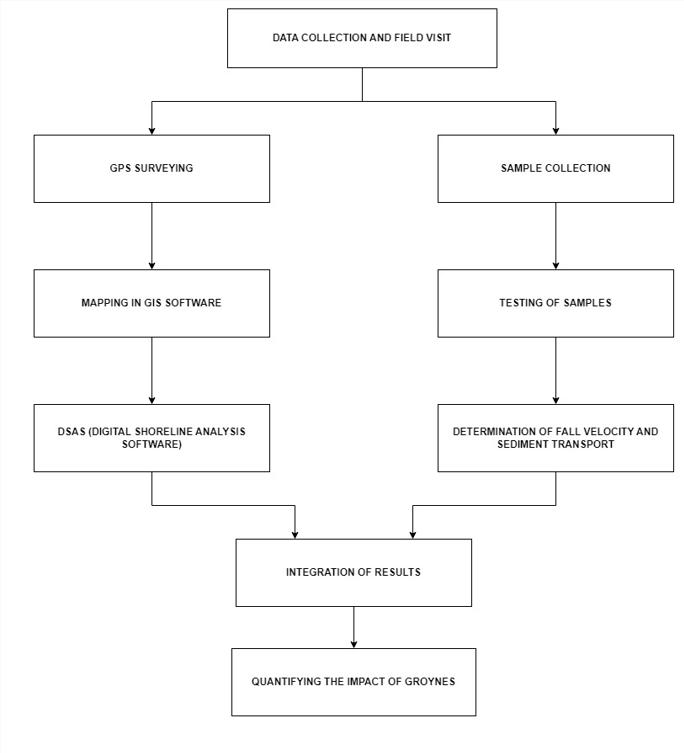
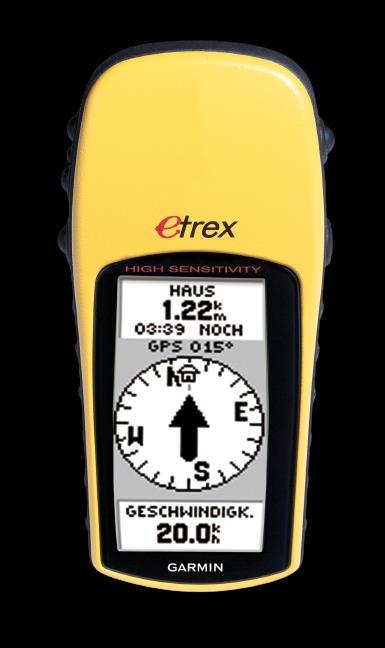
GPS survey is performed using a handheld GPS device. Shoreline, Baseline and two other Reference lines are captured using handheld GPS and the co-ordinates are exportedintoanexcelsheetandtheshorelineandbaseline arelatertransferredtoGISsoftwareandtheyaredigitized. Other corresponding data such as time, point ID are entered into the attribute table. After digitizing all the shorelineandbaselinewhichhasbeendigitized,wecan performDSAS(DigitalShorelineAnalysisSoftware).
International Research Journal of Engineering and Technology (IRJET) e-ISSN: 2395-0056
Volume: 11 Issue: 07 | July 2024 www.irjet.net p-ISSN: 2395-0072

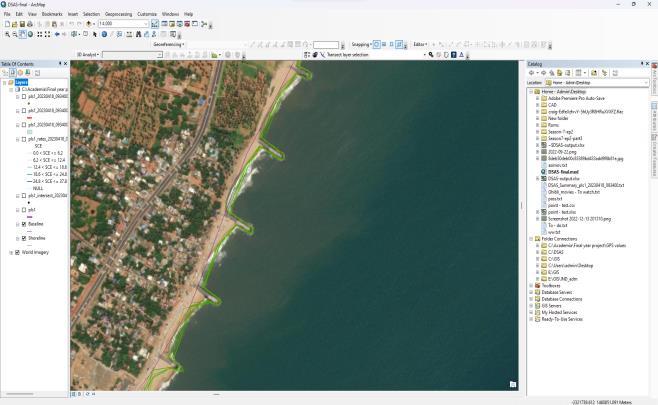

-4:DSASToolbar
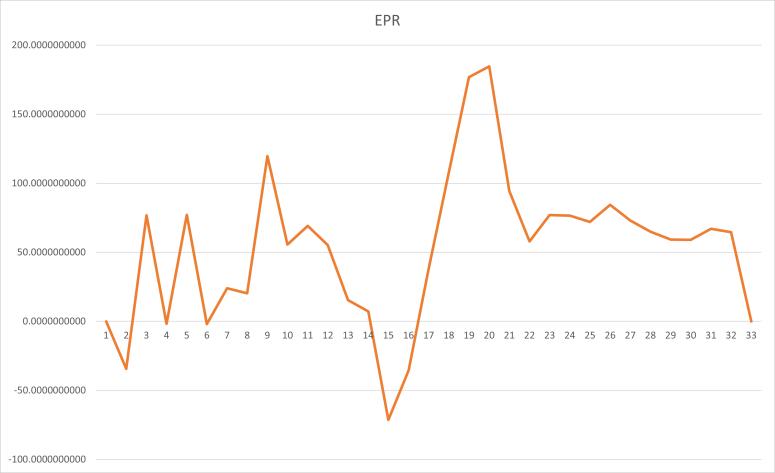
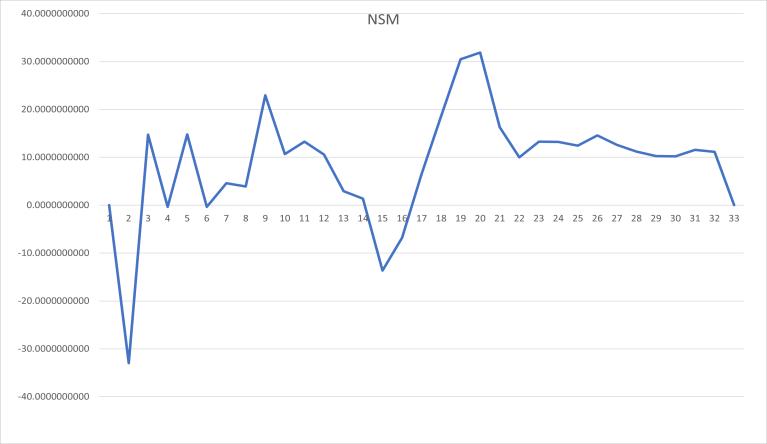
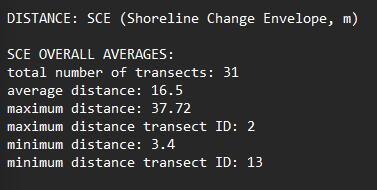
We have followed the DSAS Version 5.0 user guide for digitizing the shoreline andfor casting the transects. After performing the analysis, we get the statistics it includes, EndPointRate(EPR),NetShorelineMovement(NSM)and Shoreline Change Envelope (SCE) which can be used to characterizetheeffectsofgroynefieldonthecoastline.
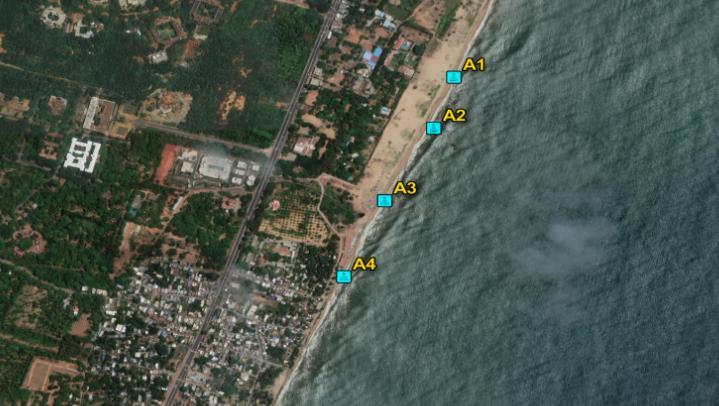
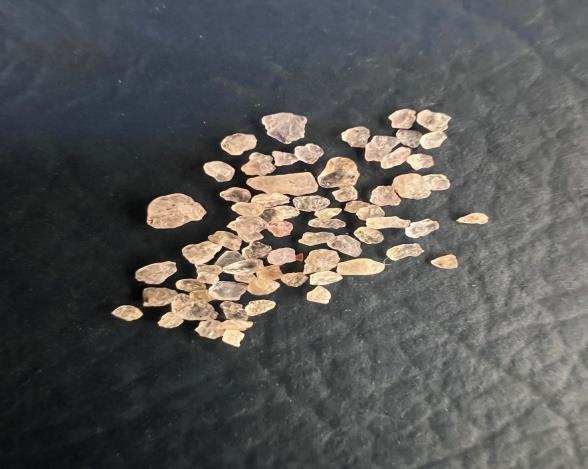
Sampleswerecollectedatthelee-sideofthegroynesat4 points each spaced 200 m apart. Then sieve analysis was performed on the collected samples to determine the particle size distribution. From this we can determine the sediment characteristics, Mean particle size, fall velocity andSedimenttransportrate.
After performing the sieve analysis graphs were made to determine the characteristics of the samples collected at each sample collection points. The median particle size was found to be 0.46 mm. The sample was found be Well sorted, Coarse-skewed and Leptokurtic according to the CoastalEngineeringManual.

4. RESULTS
4.1 GPS
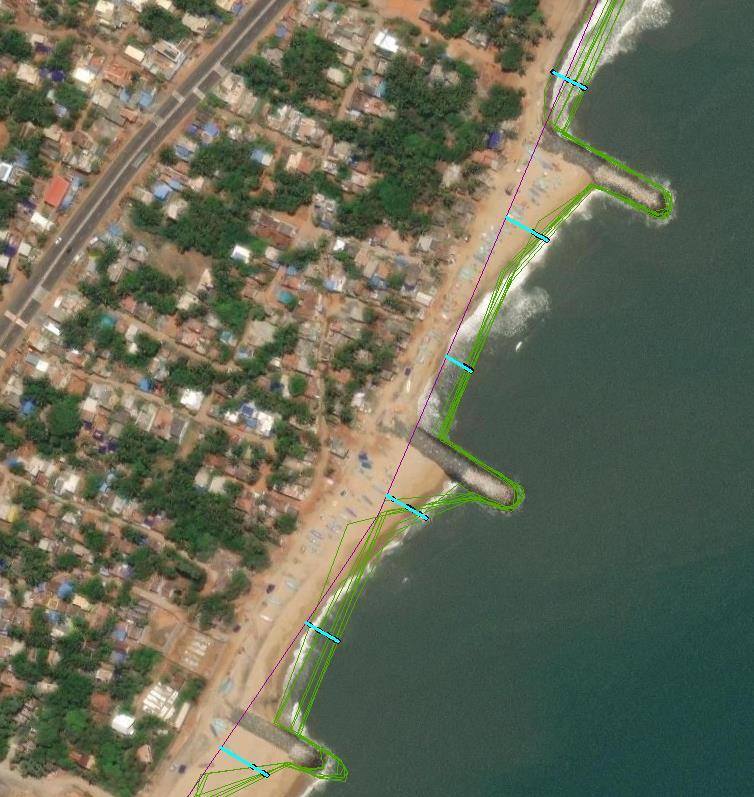
The recorded Shorelines and Baselines are then digitized in GIS software (ArcGIS), then Shoreline Analysis is performed using DSAS tool in ArcMap to get the value of parameters such End point Rate (EPR), Net Shoreline Movement (NSM) and Shoreline Change Envelope (SCE) formJanuary2023toMarch2023.
International Research Journal of Engineering and Technology (IRJET) e-ISSN: 2395-0056
Volume: 11 Issue: 07 | July 2024 www.irjet.net p-ISSN: 2395-0072
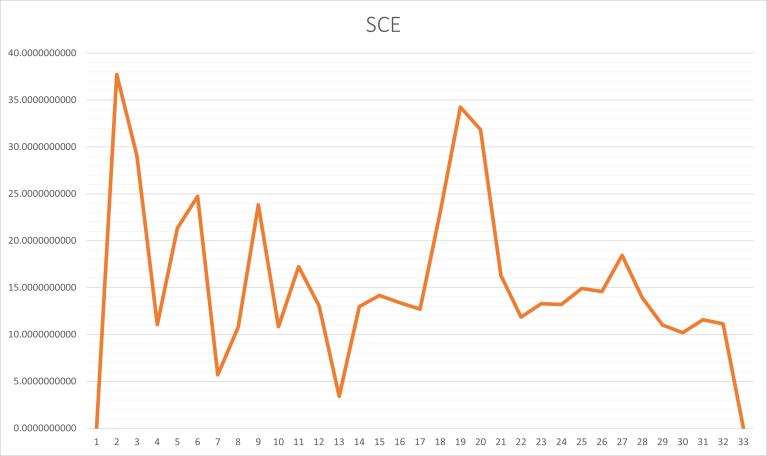
From the analysis we have determined the no. of erosionaltransectstobe5andno.ofaccretiontransectsto be 26 which is more the 80% of the transects. The maximum erosion transect is transect no.2 and maximum accretiontransectistransectno.20.


The collected samples are tested to determine the particle size and the sample are classified.AfterperformingSieveanalysis,thesediment wasfoundto bemediumsand whichiswell-sorted, the distribution is Coarse Skewed and Leptokurtic. The mean particle size and the median particle size (D50) were0.47mmand0.46mm.

International Research Journal of Engineering and Technology (IRJET) e-ISSN: 2395-0056
Quartz particlewere found in the sediment sampleand their particle size is compared with the graphs provided in Coastal Engineering Manual we can determinethefallvelocityofthesedimentparticles.
g=980cm/sec2
ƴ water =0.011cm2/sec
ƿ saltwater=1.03g/cm3
ƿ quartz =2648g/cm3
Re =Wf *D/ƴwater
Re =(7*0.046)/0.011
Re =29.27
CD=4/3*980*(0.046/72)*(2.65-1)
CD=2.02
FallvelocityinSaltwater
Wf =7*0.977=6.839
Re =(6.839*0.04)/0.011 =28.59
CD=4/3*980*(0.046/6.8392)*(2.65-1)
CD=2.12
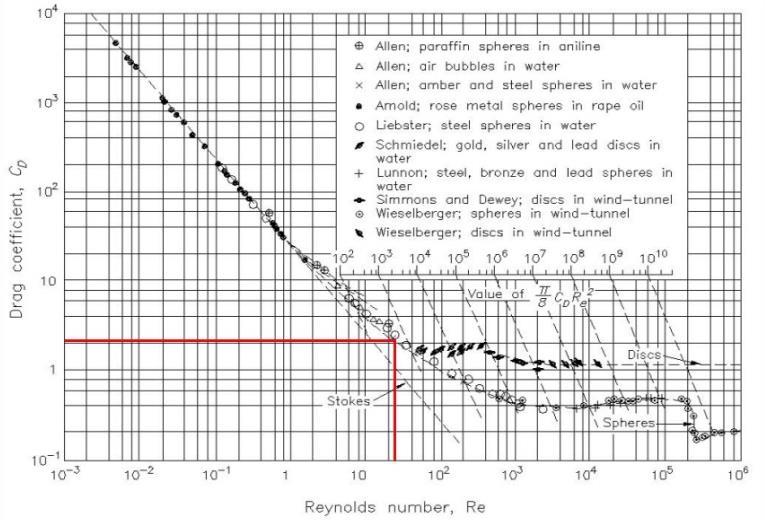
Fig -12:DragCoefficientasafunctionofReynoldsnumber
Therefore, the fall velocity (Wf) = 7 cm/sec (or) 0.07 m/sec
This agrees with the graph provided in the Coastal EngineeringManual.
4.3 Sediment Transport Rate
The Longshore Sediment Transport rate is calculated using Energy-Flux formula using the wave data acquired fromINCOIS.
Volume: 11 Issue: 07 | July 2024 www.irjet.net p-ISSN: 2395-0072 © 2024, IRJET | Impact Factor value: 8.226 | ISO 9001:2008 Certified
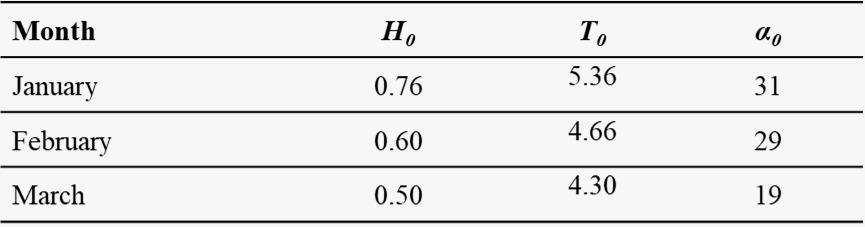
-13:WavedatafromINCOIS ; Q= ⁄ x
This is the Energy Flux formula for Longshore Sediment Transport.
JANUARY: =0.76 =44.81
=1.14
International Research Journal of Engineering and Technology (IRJET) e-ISSN: 2395-0056
=+15744cum/month
Netdrift=+152696.25cum/month[FromJanuaryto March2023]
Thedriftoccursinnorthwarddirectionsoitispositive.
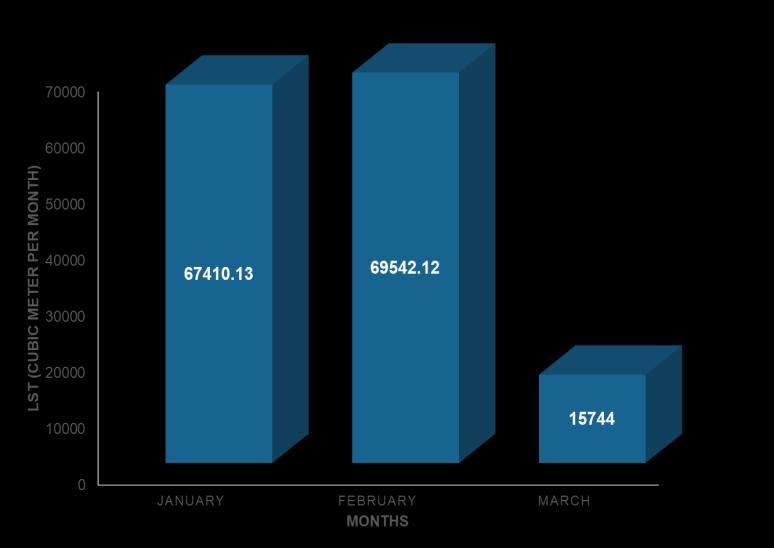
Fig -14:LongshoreSedimentTransportfromJanuaryto March 5. CONCLUSION
Volume: 11 Issue: 07 | July 2024 www.irjet.net p-ISSN: 2395-0072 © 2024, IRJET | Impact Factor value: 8.226 | ISO 9001:2008 Certified Journal | Page1182
From the DSAS analysis it is concluded that there the groynes have not negatively impact the coastline. Significant accretion of the coastline has taken place
International Research Journal of Engineering and Technology (IRJET) e-ISSN: 2395-0056
Volume: 11 Issue: 07 | July 2024 www.irjet.net p-ISSN: 2395-0072
after the construction of the groynes. Although there is erosion in some places it is found to be very minimal. Linear Regression Rate (LRR) and Weighted Linear Regression(WLR)werefoundtobe26.11mm/year.
The sediment is classified as medium sand which is well-sorted, the distribution is cross-skewed and Leptokurtic. The fall velocity of the particles is determined as 0.07 m/s. The sediment transport happens only in one direction (i.e.) towards the north which is taken as positive. Longshore sediment transport for the month of March was found to be less compared to January and February. From this data we canconcludethatthegroynesareperformingefficiently in regaining the eroded coastline, although there is erosion in some area it is very minimal are can be compensated by artificial beach nourishment. Once the desired coastal profile is achieved the groynes can be removed andthe beach profilewill be maintained. This is in experimental phase and there are still on-going studieswhicharebeingperformedonthistopic
[1] Vrinda, Ms. and M. A. Mohammed-Aslam. “Assessment of shoreline vulnerability in parts of the coastline of Kasaragod district, Kerala,India.”(2021).
[2] Selvan,S.&Kankara,R.S.&Markose,Vipin& Bhoopathy, Rajan & Kalaivanan, Prabhu. (2016). Shoreline change and impacts of coastal protection structures on Puducherry, SEcoastofIndia.NaturalHazards.
[3] Vaidya, Aditee & Kumar, Santosh & Kudale, M.. (2015). Shoreline Response to Coastal Structures.
[4] Veeramuthu,Anandabaskaran & Vijayakumar, G.. (2022). Short Term and Seasonal Observation on Shoreline Changes from Kanagachettikulamto Veerampattinam ofthe Puducherry Coastal Region Using GPS Technique.
[5] Smith, Martyn & Cromley, Robert. (2012). Measuring Historical Coastal Change using GISandtheChangePolygonApproach.
[6] Smith,Kathryn&Terrano,Joseph&Pitchford, Jonathan & Archer, Michael. (2021). Coastal Wetland Shoreline Change Monitoring: A Comparison of Shorelines from HighResolution WorldView Satellite Imagery, Aerial Imagery, and Field Surveys. Remote Sensing.
[7] Sumangala,Dhanya&Mohan,Rajarethinam& Vendhan, Mullai & Murthy, M. & Sajeev, R.. (2020).AssessmentofPerformanceofaGroin Constructed on Puducherry Coast - A Case Study.JournalofCoastalResearch.
[8] United States. Army. Corps of Engineers. Recreation Task Force. U.S. Army Corps of Engineers Recreation Study: a Plan Prepared for the Assistant Secretary of the Army (Civil Works). Washington, D.C. : [Springfield, VA :] :Headquarters,U.S.ArmyCorpsofEngineers; [National Technical Information Service, distributor],1990.
[9] Natesan, Usha & Parthasarathy, Anitha & Vishnunath, R. & Jeba Kumar, G.Edwin & Ferrer,Vincent.(2015).MonitoringLongterm Shoreline Changes along Tamil Nadu, India UsingGeospatialTechniques.
[10] Veeramuthu, Anandabaskaran. (2017). Monitoring Shoreline Changes of the Puducherry Coast, South India: A Review and a Case Study. International Journal for Research in Applied Science and Engineering Technology
[11] Himmelstoss, E.A., Farris, A.S., Henderson, R.E., Kratzmann, M.G., Ergul, Ayhan, Zhang, Ouya, Zichichi, J.L., Thieler, E. R., 2018, Digital Shoreline Analysis System (version5.0):U.S.Geological Survey software release.