

International Research Journal of Engineering and Technology (IRJET) e-ISSN: 2395-0056
Volume: 11 Issue: 07 | July 2024 www.irjet.net p-ISSN: 2395-0072
DETECTION OF FRACTURES USING TRADITIONAL WELL LOG DATA AND COMBINATION OF MACHINE LEARNING TECHNIQUES
MD. Ashikur Rahman1 , Ishtiak Ahmed2 , Mehedi Hasan3, Md. Abdullah Al Humayun4
1Graduate, Petroleum and Mining Engineering Department, Chittagong University of Engineering and Technology, Chattogram, Bangladesh.
2Graduate, Mechanical and Production Engineering, Ahsanullah University of Science and Technology, Dhaka, Bangladesh.
3Graduate, Electrical and Electronic Engineering, Ahsanullah University of Science and Technology, Dhaka, Bangladesh
4Department of Electrical and Electronic Engineering, Eastern University, Dhaka, Bangladesh
Abstract - Fractures significantlyimpacthydrocarbonflow and reservoir permeability, making their detection crucial for reservoir development, production assessment, and quality evaluation. This study identifies fracture zones using conventional well log data, consisting of two main steps. First, it analyzes well log responses to detect fracture zones, distinguishing fracturedfromnon-fracturedregions.Second,it applies a Support Vector Machine (SVM) classification to predict fracture zones based on these log responses. The well logs used include RHOB, DRHO, NPHI, DT, CALI, and PEF, which are commonly available for most wells. Current technologies like Borehole televiewer and core analysis, while effective, are expensive and time-consuming, highlighting the importance of log data for fracture detection. This study demonstrates the effectiveness of the SVM model on two wells, achieving a prediction accuracy of over 95%. The model's performance is consistentacrossbalanced,unbalanced,scaled, and unscaled data, indicating its robustness and applicability in fracture detection.
Key Words: Fracture Detection, Well Log Analysis, Support Vector Machine (SVM), Hydrocarbon Flow, Reservoir Quality, Machine Learning.
1.INTRODUCTION
1.1 Background
Fractures in underground formations have a significant roleinfluidflowsuchasgasandoil.Withoutidentifyingthe fractureandunderstandingitspropagationinthereservoir,it is impossible to analyse and comprehend the behavioural traitsofthereservoiranditdoesnotleadtoreliableresults. In reservoir fluid flow, fracture have both positive and negativeeffects[1].Bymakingadditionalflowchannelsinthe formation,fracturecanhelptotransporthydrocarbontothe wellbore.Ontheotherhand,whenfracturesfilledwithclay orshale,itmaycreatebarrierstohydrocarbonflowandserve as a seal. They also affect the stability of engineered structuresandexcavations.Fracturemayhavealsoimpacton the stability of excavation and designed structures.
Additionally,fracturedetectioncanminimizedrillingcosts andreduceenvironmentalimpactsbyavoidingunnecessary drillingdecreasingtheriskofwellboredamage.
Fracturedzonescanbedetectedthroughindirectordirect method.Variousdatasources,suchasseismicsources,well logs,welltests,drillingmudhistoriesandrockcorescanbe used to detect fracture zones. Formation Micro- Scanner (FMS), Borehole Televiewer (BHTV) etc. are used for high resolutionimagesinboreholetodirectfracturedetection. Conventionalwelllog,welltestsandotherdataareusedas indirectmethodstoidentifyfracturezones[1].
Amongthese,oneofthemostcommonmethodforlocating fracturesinreservoirrockistouseconventionalwelllog.As, welllogwhichinclude,calliper(CAL),gammaray(GR),sonic intervaltransittime(DTorAC),neutronporositylog(NPHI), density(RHOB),resistivitylogetc.provideacontinuousand in-situmeasurementsofrockproperties,conventionalwell log data are commonly used for fracture identification. Fractureshavetypicallysomeindirectanddirectinfluenceon the response of log these log data. Conventional well log measuresseveralrockpropertiessuchas,density,resistivity, neutronporosity,sonicvelocityetc.Fracturecanbedetected from changes in these properties, for example decreasing density, increasing sonic velocity etc. [2]. Using Machine Learningapproachaddinganovelstepinidentifyingfracture zoneinthereservoir.Amachinelearningsystemgenerates predictionmodelsusingpreviousdataandlearnsfromitto anticipate the results for new data. As various logs have differentresponsetothefracturedandnon-fracturedzones, these responses can be used for training a machine to discriminatefracturedandnon-fracturedzones.Inmachine learning technique, detection of fractured zone in the formationbyusingconventionallogdataisacomplexnonlinearclassificationproblem[2].Becauseinthepresenceof fractureresponsesoftheseconventionallogarecomplicated. Itsneedtocombinealllogresponsetodoclassification.
International Research Journal of Engineering and Technology (IRJET) e-ISSN: 2395-0056
Volume: 11 Issue: 07 | July 2024 www.irjet.net p-ISSN: 2395-0072
1.2 Context
Conventionalwelllogsincludinggammaray,resistivity, andsoniclogsetc.havetraditionallybeenusedforfracture identification,thoughthesehavesomelimitations.Machine learningapproachhasnowemergedasanadvancedtoolfor detectingfracture,asitcanmakeusevastamountofwelllog datatofindpatternsandrelationshipsthatarechallenging forhumanstorecognize.InThispaper,itwillbeexplored theuseofmachinelearningalgorithmsinordertofracture detection by using conventional well log data. At first the paperwillprovideanoverviewofconventionalwelllogsand detectfracturebyanalysinggraphicaldiscontinuationdueto fracture. After that it will introduce the idea of machine learning and applicability to fracture detection. North-sea welllogdatawillbeusedforidentificationoffracturethatis collected from an online source. First, these log data(.las) willplottedintoPETRELsoftwaretocreategraphicalview and then detection of the fractured zones will be done by analysing the log response to fracture. Then finally implication of the machine learning technique to fracture zonedetectionbyusingsupportvectormachine(SVM)will beanalysed.Asalargeamountofwelllogdatawillbeused for the detection process in SVM, it is a great challenge to reach at a better accuracy. Because of less amounts of fracture zones compared to non-fractured zones in a reservoir, there create an imbalance data set. A small amountoffractureddatawithrespecttonon-fractureddata maycausebiasesintheclassification.Forbetteraccuracyits needtomakethedatasetbalancedandcomparewiththe imbalancedaccuracy.Theconclusionofthethesispaperwill entail a discussion on the implications of the research outcomesforoilandgassector.Thepaperwillhighlightthe fracturedetectionprocessfromconventionalwelllogdata andfindthepotentialityofmachinelearninginthisfieldfor betterefficiency.
1.3 Aims and Objectives
Themainpurposeofthepaperistouseconventionalwell logdataforfracturedetectionanddevelopmentofamachine learning based method. Support vector machine classifier wereusedforthispurpose.
1.Todetectfracturezonesbyusingconventionalwelllogin areservoir.
2. To predict fracture zones by using machine learning approach.
3.Toanalysetheapplicabilityofmachinelearningtechnique forfracturedetectionbyusingconventionalwelllogdata.
1.4 Significance and Scope
Fractureidentificationisoneoftheimportantpartsof reservoir characterization. As it is a complex task in petroleumindustry,severaltechniquesweredevelopedfor this job. Among these approaches, fracture detection by using image logs is more reliable, because of its high resolution and advance technology. But the image log technologyisveryexpensiveandwasdevelopedduringthe lastfourdecades[3].That’swhyimagelogswerenotrunin themostofthewells.Coreanalysisisalsoadirectprocess for fracture detection. As cores are acquired from a well withinasmallrangeofdepth,welllogismoreadvantageous over core analysis. Because, well logs normally cover full depth of the well and a lot of information are collected in everyreservoirduringitsdevelopingphase.Asconventional welllogdataisalmostavailableineveryreservoir’swell,if wecanusethesedataforthepurposeoffracturedetectionit will may offer a highly significant role and be beneficial. Beside this, if we can able to apply the machine learning processforundergroundfractureidentification,itwilladda revolutionarystepinthepetroleumindustry.Bytraineda machinelearningalgorithm,itcanpredictfracturezoneson thebasisofconventionalwelllogresponsetothefracture. Wecanapplythistrainedalgorithmfordifferentwellsand gainideaaboutfracturezoneswithoutanalysingorapplying theotherdetectionmethods.Itreducescostandcomplexity withminimizingtheenvironmentalimpact.Thethesishasa broadscope,asitinvolvesthemachinelearningapproachto aspecificgeologicalissue.Itinvolvesproficiencyinmachine learningmethodsanddata analysis,aswell asa thorough understandingofthegeologyandpetrophysicsofsubsurface formations. This thesis may enhance the applicability of machinelearninginotherreservoirevaluationsectors.[4]
All things considered, a thesis on fracture identification integratingconventionalwelllogwithmachinelearninghas thepotentialtosignificantly.
International Research Journal of Engineering and Technology (IRJET) e-ISSN: 2395-0056
Volume: 11 Issue: 07 | July 2024 www.irjet.net p-ISSN: 2395-0072
2. METHODOLOGY
2.1 Workflow Diagram

Fig-1: WorkflowDiagram
2.2 Data Management
2.2.1
Data Collection
For the fracture detection process in this study, conventional well log data was utilized. The data was obtained from the GEOLINK website, which offers a comprehensivecollectionofwelllogdatain.lasformatfor researchpurposes.Specifically,datafrom223wellsdrilled intheNorthSeawascollected.Thedatasetincludesvarious typesoflogssuchasdensity,neutronporosity,photoelectric effect,gammaray,andresistivitylogs[11].
2.2.2
Data Analysis
Fromtheextensivecollectionofwelllogdataprovidedby GEOLINK,theanalysisfocusedonthemostcommonlogsfor fracture detection [8]. Due to the inconsistency of data availabilityatdifferentdepthsandthevaryingeffectiveness of logs in responding to fractures, the selected logs were density, density correction, neutron porosity, caliper, and PEFlogs,astheyshowedbetterresponsestofracturezones inundergroundformations.Afterevaluatingthedatafrom
variouswells,‘well-25_7-2’and‘well-34_7-21’wereselected forthestudyduetotheirsuitabilityforthethesisobjectives.
2.2.3 Data Cleaning and Repairing
For the fracture detection task, the log data from ‘well25_7-2’wasanalyzedbetweendepthsof4620mto4822m, andfrom‘well-34_7-21’betweendepthsof2550mto2882 m.Dataoutsidetheserangeswasexcludedduetomissing data. Abnormal data points were corrected by replacing them with average values to ensure better accuracy. Additionally, data standardization was performed using standardscalarprocessesinPythontonormalizethedata.
2.2.4 Data Pre-processing
Toaddressdataimbalanceissues,twocommontechniques were considered: Random Over Sampling and Random UnderSampling.TheRandomOverSamplingtechniquewas employed to balance the dataset by creating duplicate samplesfromtheminorityclass[9].
2.3 Fracture Detection by Using Conventional Well Log
The figure below shows the different log responses to undergroundfractures.
Table-1:
Formationdensitylog (RHOB)
Densitycorrectionlog (DRHO)
Neutronporositylog (NPHI)
LogResponse
Decreasewithasharpdrop
Decrease
Increasedwithasharppick
Calliperlog(CALI) Sizechange
Soniclog(DT)
Photoelectricfactorlog (PEF)
2.4 Fracture
Highvaluewithasharp drop
Increase
Prediction by SVM Classification Model
AlthoughtheSVMmodelcanbeusedforbothclassification andregressionproblems,howeverinitiallyitisutilizedasa classificationandrecommendedforuseasclassifier[3],[10]. TheSVMalgorithm'sobjectiveistoestablishthebestlineor decisionboundarythatcandividen-dimensionalspaceinto classes, allowingusto quicklyclassifyfreshdata points in thefuture.
International Research Journal of Engineering and Technology (IRJET) e-ISSN: 2395-0056
Volume: 11 Issue: 07 | July 2024 www.irjet.net p-ISSN: 2395-0072
2.4.1 Mathematical Expressions
In order to understand the basics of this classification, mathematicalexpressionofsvcmodelaredescribedbelow-
LetconsiderbinaryclassificationbySVCmodel,fromFig-3a line that separate the positive and negative data into two classes.Equationofthatline,
�� =����+��
Now,consideravector‘w’whichparametersare‘m’and‘c’. ‘w’iscalledweightvectororthogonaltothehyperplane. �� =(��,��)
Nowtoclassifytheinputdata,thedecisionfunctionis-
If the value of D(x) is positive, the input data falls into positiveclassandifthevalueofD(x)isnegativetheninput datafallsintonegativeclass.
Nowthequestionarisesaboutbesthyperplaneselectionas itcanbeanystraightlinewiththedifferentslope.

3. RESULTS
3.1 Identify Fractured Zones
From Fig. 3, in these two zones the density and density correctionlogweredecreasedsuddenly.Ontheotherhand, neutronporosityincreasedrapidlyfromitsnormalaverage value.Thesoniclogvaluewasincreasedwithasharppick. Thatmeans,thesoundvelocitywasdecreasedandforthis reason interval Transit time was increased which was an indicationoffractures.At4632.0454m–4632.198mdepth, the caliper log value was slightly increased, whereas at 4665.2686m–4667.0972m,thecaliperlogshowedagood
indicationbytheboreHolesizetopresenceoffractures.The PEF value also increased at both zones which might be causedbyentrancemudintofractures.Byanalyzingallthe signs,itcouldbesaidthattherewasafracturezoneatthe mentioneddepth.

Fig-3: Fracturezonesat(4632.05m–4632.20)& (4665.27m–4667.10m)
The neutron-density overlap in track-3 made the fracture detection process easier. As density and porosity are inversely related, the decreased density log value and increasedporosityresponseatthesetwozonesweregood indications of fracture existence. In Fig. 4, the zone from 4698.3394 m to 4703.521 m represents a large fractured zonewithbetterresponses.Theotherlogresponsesshowed similarcharacteristicsasmentionedforthepreviouszone withmoreaccurateindicationsaboutfractures

Fig-4: Fracturezonesat(4676.83m–4679.59m)& (4698.34m–4703.52m)
At 4714.80 m - 4715.87 m, the caliper log value and PEF value showed a small increase, whereas the other zones showed a high increase. The RHOB value at each zone decreasedwithasharpfigure,andNPHIalsoincreasedata
International Research Journal of Engineering and Technology (IRJET) e-ISSN: 2395-0056
Volume: 11 Issue: 07 | July 2024 www.irjet.net p-ISSN: 2395-0072
highvalue.Byanalyzingthesevaluesandchangesinfigures, as well as the DRHO value, fractures at these zones were detected.
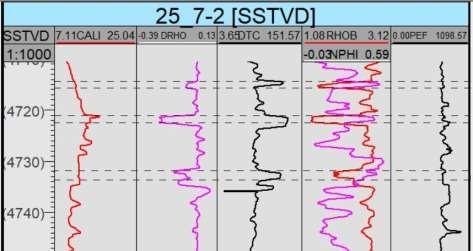
Fig-5:Fracturezonesat(4714.80m–4714.87m)& (4721.05m–4722m)&(4732.02m–4733.54m)
The neutron-density overlay showed a decrease in RHOB coupledwithanincreaseinNPHI.Ahighvalueofthesonic log with cycle skipping in the selected zone indicated fracturesbecauseinopenfracturesorfluid-filledfractures, soundpassesatalowervelocity,increasingthetraveltime.In this figure, the caliper log value showed a little change in boreholediameter,andconsideringtheotherlogresponses aswellasPEF,thesethreezonesweredetected.

Fig-6: Fracturezonesat(4750.03m–4750.92m)& (4774.54m–4750.76m)
Atthesetwodepthregions,all theparametersrequiredto denoteafracturezonewerealmostmatched.DTC,NPH,and PEFvalueswereincreased,andDRHOandRHOBvalueswere decreased with sharp peaks. Caliper log values for these selectedtwozoneswereagoodindicationoffractures.

Fracturezonesat(4810.66m–4812.18m)& (4816.45m–4816.45)
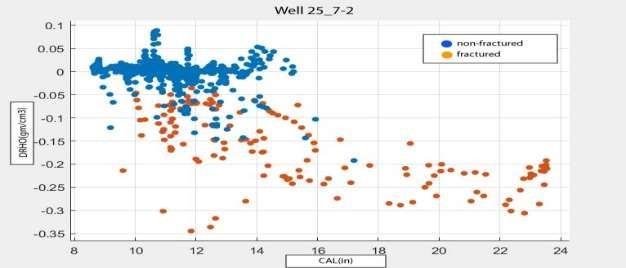
3.2 Cross-Plot
Inordertobettercomprehendandanalyzetheclassification results,a2Dcross-plotisausefultoolinSVMclassification because it gives a visual representation of the data distribution, decision boundary, feature relevance, outlier detection,andmodelevaluation.Toanalyzetheresponseof conventionalwelllogtofractures,2Dcross-plotsweremade usingMATLABsoftware.Twoplotsaregivenbelow:
International Research Journal of Engineering and Technology (IRJET) e-ISSN: 2395-0056
Volume: 11 Issue: 07 | July 2024 www.irjet.net p-ISSN: 2395-0072

3.3 Performance Analysis
SVMclassificationwasusedtodiscriminatefracturezones andnon-fracturedzonesbyusingselectedconventionalwell logs data. Accuracy was checked for both balanced and imbalanceddata.Sincethedatawasdividedintotwoparts as test data set and train data set, accuracy was also determined by using both train and test data. Recall and precision were measured for better understanding the performance of SVM classification. Accuracy was also checked after converting the unbalanced data set into a balancedone.
Table-2: PerformanceAnalysisofSVMclassification model
Balanceddataset(withoutscaling)–
Accuracyoftestdata:95.09%
Accuracyoftraindata:95.15%
ForvalidationandfindingtheapplicabilityoftheSVCmodel todetectfractures,anotherwell(34_7-21)wasrunthrough themodel.
Predictedaccuracyof34_7-21well:95.43%
4. DISCUSSION
Inthispaper,weaddresstwomaintasks:detectingfracture zones using conventional well log data and evaluating the applicability of a machine learning approach for fracture detection.TheapproachinvolvesapplyingSVMclassification to well log data and testing the model's performance on anotherwell.
Fracture detection from well log responses is complex, requiring the combination of multiple log types due to varying log characteristics for fractures. In well 25_7_21, twelve fracture zones were identified, with log responses matching theoretical characteristics described in the methodologychapter.Whileverificationwithimagelogsor coresampleswouldbeideal,thehightheoretical-logmatch suggestsminimaldetectionerrors,thoughsomeuncertainty remainsregardingfracturezonewidth.
To apply the SVM model, we labeled fractured and nonfracturedzones.Dataimbalanceduetoahighernumberof non-fractured zones compared to fractured ones was addressed using data oversampling techniques, which yieldedsimilaraccuraciesforbothbalancedandunbalanced datasets.
For a comprehensive assessment of SVM classification, accuracy,recall,andprecisionforbothscaledandunscaled datawerecompared,revealingonlyslightdifferenceswith highaccuracy.TheSVMmodeldemonstratedhighaccuracy for both training and testing datasets with minimal overfittingorunderfittingissues,indicatingawell-balanced modelcomplexity.

Fig-10: Comparisonbetweentrainandtestdata
In Table-3, the fractured zones identified through conventional log analysis are compared with the zones predictedbySVMclassification,witheachzone'swidthalso provided. This comprehensive presentation allows for a
International Research Journal of Engineering and Technology (IRJET) e-ISSN: 2395-0056
Volume: 11 Issue: 07 | July 2024 www.irjet.net p-ISSN: 2395-0072
detailedcomparisonbetweenthetwofractureidentification methods.Byincludingthewidthsofthezones,itbecomes easier to discern the accuracy and effectiveness of each method. The table aims to highlight any discrepancies or agreementsbetweenthetraditionalandmachinelearning approaches,therebyprovidingvaluableinsightsintotheir respectiveperformancesinidentifyingfracturedzones.This comparisoniscrucialforunderstandingtheadvantagesand limitationsofusingSVMclassificationinfracturedetection comparedtoconventionallogmethods.
The table illustrates a very small number of incorrect fracture predictions when using the SVM classifier. The classifier is able to detect all zones accurately, with only minor variations in width. This high level of accuracy suggeststhatthemodelcouldbeeffectivelyappliedtoother wells.Tofurtherassessitsapplicability,thetrainedmodel was tested on well 34_7-21. The results confirmed the model'srobustness,asitexhibitedoutstandingaccuracyin predicting fractures for this well as well. This successful applicationtoadifferentwellunderscoresthepotentialof theSVMclassifiertobeareliabletoolforfracturedetection acrossvariouswelllogs.Theabilityofthemodeltomaintain high accuracy across different datasets is indicative of its generalizabilityandeffectivenessinreal-worldscenarios.
Table-3: Comparisonbetweenfracturezonespredictedby SVManddetectedfromwelllog
Fractureanalysisofwell25_7-2 PredictedbySVM Detectedfromlog
5. CONCLUSION
5.1 General
Inordertodiscoverandextractnatural resourceslikeoil, gas, and minerals, fracture networks are essential. Understandinganddescribingsubterraneanfracturesaidsin predicting resource distribution and developing effective extractionmethods.Thispaperaimedtouseconventional well log data for the purpose of identifying underground naturalfracturezones.Thefracturedetectionprocessusing conventionalwelllogsisindirect,asthistechniquecannot provide direct measurements of fracture zones, whereas borehole image logs can identify and represent fracture distribution.
Among all log responses to fractures, an increase in DT (sonictraveltime)andneutronporosity(NPHI),alongwitha sharpdecreaseinbulkdensity(RHOB),aremoredistinctive parameters for detecting fractures. The application of machinelearninghassimplifiedthisprocesssignificantly.In thisthesis,SVMclassificationdemonstratedhighaccuracyin predictingfracturesfromconventionalwelllogdata.
Thereisariskofmisclassifyingalldataasnon-fractureddue tothehighimbalanceindex.However,afterevaluatingthe results,it wasfoundthat theimpactofdata imbalance on accuracyisminimal.Thedifferencebetweenbalancedand imbalanced data accuracy is only 1.13% for test data and 2.48% for training data. Data scaling is also an important taskinmachinelearningmodels.Accuracywascheckedfor both scaled and unscaled data, revealing only a small deviation.Thedifferencebetweenscaledandunscaleddata accuracyis0.76%fortestdataand0.38%fortrainingdata.
Tobetterunderstandthemodel'sperformance,additional accuracy measurement parameters such as recall and precision were used. The differences between these performance metrics were very small for test data and showed no change for training data, which increases the acceptability of the SVM classification model. This comprehensiveevaluationindicatesthattheSVMclassifieris areliableandeffectivetoolforfracturedetectioninwelllog data,enhancingtheprocessofnaturalresourceextraction.
5.2 Key Findings
Someimportantfindingsarementionedbelow:
NPHI, RHOB, and DT serve as good indicators for detectingfracturezones.
Errors tend to occur at the boundaries between fracturedandnon-fracturedzones.However,since the study's objective is to identify the zones, the resultsareencouraging.
International Research Journal of Engineering and Technology (IRJET) e-ISSN: 2395-0056
Volume: 11 Issue: 07 | July 2024 www.irjet.net p-ISSN: 2395-0072
Thereisalowerimpactoftheimbalanceindex,as theaccuracydifferenceisnotsignificant.
There is minimal effect on the SVM classification model's accuracy when using scaled or unscaled data.
5.3 Practical Implications
Since image logs are not run in every well due to highexpenses,andcoresamplesarenotavailable fortheentiredepthofthewell,thisstudywillhelp detect fracture zones, which is an important phenomenonforeveryreservoir.Conventionallogs areavailableineverywell.
Additionally,machinelearningprocedurescanplay a significant role in the petroleum industry. They can reduce costs and time, as well as improve explorationprocedures.
5.4
Recommendation forFuture Study
Inthispaper,themainfocuswasondetectingfracturezones only from conventional well logs. However, there are different types of fractures and many fracture characteristics. Using conventional well logs for fracture detection has shown appreciable results. The current challenge is to determine the fracture characteristics and fracture types. Machine learning processes will help minimizemanycomplexitiesinthisfield.
REFERENCES
[1] M.Gamal,A.A.El-Araby,A.N.El-Barkooky,andA. Hassan,“‘Detectionandcharacterizationoffracturesinthe Eocene Thebes formation using conventional well logs in October field, Gulf of Suez, Egypt,’” Egyptian Journal of Petroleum, vol. 31, no. 3, pp. 1–9, Sep. 2022, doi: 10.1016/j.ejpe.2022.06.001.
[2] S. Dong et al., “Fracture identification by semisupervised learning using conventional logs in tight sandstonesofOrdosBasin,China,”JNatGasSciEng,vol.76, Apr.2020,doi:10.1016/j.jngse.2019.103131.
[3] H. Azizi, “Developing A Machine Learning Based Approach For Fractured Developing A Machine Learning Based Approach For Fractured Zone Detection By Using PetrophysicalLogsZoneDetectionByUsingPetrophysical Logs.”[Online].Available:https://commons.und.edu/theses
[4] A. Mohsenipour, I. Zahmatkesh, and B. Soleimani, “FracturesAnalysisUsingCoreDataandImageLogs:ACase StudyintheDalan–KanganReservoirofSouthParsGasField, Iran,”IranJSciTechnolTransASci,vol.46,no.3,pp.819–828,Jun.2022,doi:10.1007/s40995-022-01288-4.
[5] L. P. Martinez, R. G. Hughes, and M. L. Wiggins, “IDENTIFICATION AND CHARACTERIZATION OF NATURALLY FRACTURED RESERVOIRS USING CONVENTIONALWELLLOGS.”
[6] “fractueedetection-Copy”.
[7] M. Tian, B. Li, H. Xu, D. Yan, Y. Gao, and X. Lang, “Deep learning assisted well log inversion for fracture identification,”GeophysProspect,vol.69,no.2,pp.419–433, Feb.2021,doi:10.1111/1365-2478.13054.
[8] “Geolink - Datasets - Data Underground.” https://dataunderground.org/dataset/geolink (accessed May27,2023).
[9] “Random Oversampling and Undersampling for ImbalancedClassification-MachineLearningMastery.com.” https://machinelearningmastery.com/randomoversampling-and-undersampling-for-imbalancedclassification/(accessedMay27,2023).
[10] G.Aghli,B.Soleimani,R.Moussavi-Harami,andR. Mohammadian, “Fractured zones detection using conventional petrophysical logsbydifferentiationmethod anditscorrelationwithimagelogs,”JPetSciEng,vol.142, pp.152–162,Jun.2016,doi:10.1016/j.petrol.2016.02.002.
[11] M.R.ShalabyandM.A.Islam,“Fracturedetection using conventional well logging in carbonate Matulla Formation,Geisumoilfield,southernGulfofSuez,Egypt,”J Pet Explor Prod Technol, vol. 7, no. 4, pp. 977–989, Dec. 2017,doi:10.1007/s13202-017-0343-1.
[12] A.R.MohebbiandM.haghighi,“fractueedetectionCopy”.
[13] J. Tian, H. Liu, L. Wang, L. Sima, S. Liu, and X. Liu, “Identification of fractures in tight-oil reservoirs: a case studyoftheDa’anzhaimemberinthecentralSichuanBasin, SW China,” Sci Rep, vol. 11, no. 1, Dec. 2021, doi: 10.1038/s41598-021-03297-6.
[14] A.Soni,P.Kumar,andB.S.Bisht,“Identificationof FracturesfromConventionalWirelineLogsandIntegration with Sedimentological Core Samples-A Case Study of WesternOffshoreBasin,India.”