
International Research Journal of Engineering and Technology (IRJET) e-ISSN: 2395-0056
Volume: 11 Issue: 07 | July 2024 www.irjet.net p-ISSN: 2395-0072

International Research Journal of Engineering and Technology (IRJET) e-ISSN: 2395-0056
Volume: 11 Issue: 07 | July 2024 www.irjet.net p-ISSN: 2395-0072
Wayan Suparta1,*, Hill Gendoet Hartono2
1Department of Electrical Engineering, Institut Teknologi Nasional Yogyakarta, Jalan Babarsari, Caturtunggal, Depok, Sleman, Yogyakarta 55281, Indonesia
2Study Program of Magister of Geological Engineering, Institut Teknologi Nasional Yogyakarta, Jalan Babarsari, Caturtunggal, Depok, Sleman, Yogyakarta 55281, Indonesia
Abstract - Todeterminethebuilt-upareaswithinaregion or city for land use planning, map interpretation is one of the effective techniques. This paper utilizes the Normalized Difference Built-Up Index (NDBI) method for built-up city in Surabaya, Indonesia as a case study Analyzing NDBI parameters from Landsat optical data revealsthatSurabaya Citysawa 21%increasein built-up land from 2002 to 2022. These findings highlight significant urban development in the city during this period and offer valuable insights for future spatial planningandlandusepolicyformulation.
Keywords: NDBI, Built up land, Urbanization, Surabaya City
Intermsofitspotentialutilization,physicalenvironmental factors that influence land use include soil condition, climate, geological relief, topography, hydrology, and vegetation. Nearly every year, the population increases, leading to a rise in built-up land and a decrease in nonbuilt-up land. According to Sajow et al. [1], built-up land includesresidentialareas,commercialgoodsandservices, social facilities, and public facilities, while non-built-up land encompasses green open spaces (GOS) such as plantations and rice fields, and non-green open spaces (NGOS) such as open land and fields. Lillesand and Kiefer [2]definelanduseasrelatedtohumanactivitiesonaplot of land, whereas land cover is more about the physical manifestation of objects covering the land, regardless of humanactivitiesassociatedwiththoseobjects.
Urban land cover tends to change drastically within a short period due to urbanization. These changes are ideally monitored and detected using remote sensing imagery because such images are relatively current and providethematicviews.Remotesensingmaterialssuchas aerial photographs and satellite imagery are typically convertedintousefulinformation.Toidentifythebuilt-up areasofaregionorcity,mapscanbeinterpreted.Various image processing methods can be used to create maps of built-up land, such as Maximum Likelihood Classification (MLC), Normalized Difference Built-Up Index (NDBI), and others.Thispaperdiscussestheimageprocessingmethod
of NDBI. NDBI is one of the image processing methods aimedatidentifyingandanalyzingbuilt-upandnon-builtup land in a region or city. The NDBI index highlights urban or built-up areas where there is usually higher reflectance in the Shortwave Infrared (SWIR) region compared to the Near-Infrared (NIR) region. SWIR is typicallydefinedaslightwitha wavelengthrange of0.9 –1.7µm[3].
The NDBI has advantages in identifying built-up areas because it utilizes the unique reflectance properties of building materials compared to vegetation and soil [3] Using NDBI in land change analysis enables quicker and more efficient detection of urban expansion [4] CombiningNDBIwithotherindiceslikeNDVIcanimprove theaccuracyoflanduseclassification[5].Researchshows thatNDBIhasastrongcorrelationwithpopulationdensity and economic activity in urban areas [6]. The NDBI method is highly effective in identifying changes in builtup land in tropical regions that frequently undergo rapid development[7]anditisalsoalow-costbutrobust
2.1
The study area for analyzing changes in built-up is in Surabaya City located in East Java of Indonesia, geographically located between 7°9′- 7°21′ South Latitude and 112° 36′ – 112° 54′ East Longitude. Surabaya was chosen as the study area due to its rapid infrastructure development linked to efforts to increase local revenue. AccordingtotheCentral StatisticsAgency(BPS),Surabaya isthesecondlargestcityinIndonesiaafterJakarta,bothin terms of area and population, with a population reaching 2,893,698 people. This density is driven by rapid urbanization, fast economic growth, and its role as a hub for trade and industry in East Java, Indonesia. Figure 1 shows the Surabaya City map with a free vector (https://www.vecteezy.com/free-vector/surabaya-map).
International Research Journal of Engineering and Technology (IRJET) e-ISSN: 2395-0056
Volume: 11 Issue: 07 | July 2024 www.irjet.net p-ISSN: 2395-0072
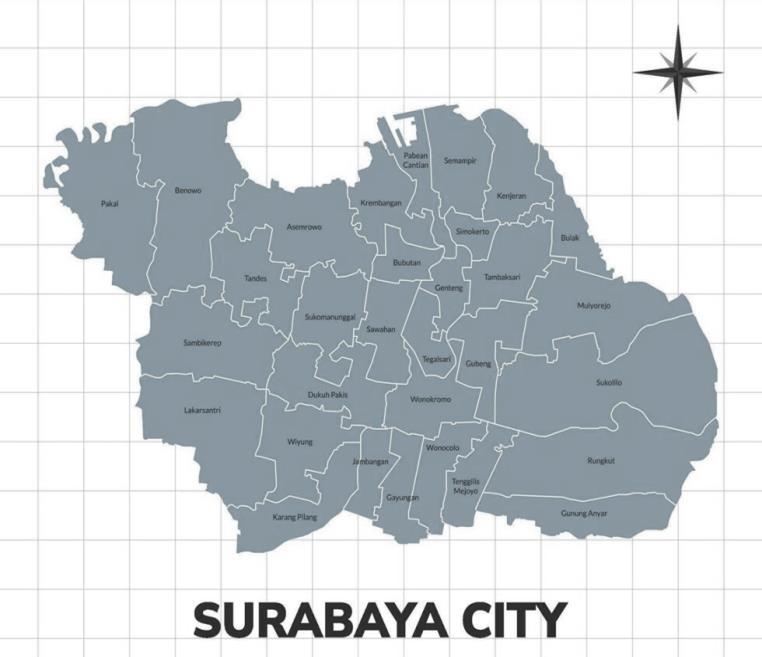
Fig. 1: ThemapofSurabayaCity,EastJavaofIndonesia (courtesybyhttps://www.vecteezy.com)
Since Surabaya City serves as a critical hub for trade, industry, and economic growth, their geological characteristicssignificantlyinfluenceitsrapidurbanization and economic development. Based on the Surabaya City Government[8]report,thecoastalplaincomprisesalluvial deposits, which are fertile and support agricultural activities, contributing to the city's food supply and secondary economic activities. The Brantas River and its tributariesaswellasTanjungPerakPortplayacrucialrole in the city's water supply, irrigation, flood control, and supporting international trade. These river systems are vital for maintaining the urban ecosystem and supporting agricultural and industrial demands. The region benefits from volcanic ash deposits from nearby volcanoes, enhancing soil fertility, which supports intensive agriculture. This agricultural productivity underpins the city’s economy by providing raw materials for food processingindustries. The presence ofvarious mineralsin the surrounding areas supports industries such as constructionandmanufacturing.
Hence,itisinteresting tovisualizeormapthebuilt-upland of Surabaya City as a case study with data in 2002 and 2022 by utilizing the NDBI method. The population of Surabaya in 2002 was approximately 2,489,800, and by 2022 it had increased to 2,887,223, indicating a 15.96% increaseover20years,oranannualgrowthrateof0.23%. The rapid population growth presents a significant challenge in urban planning, aiming to increase productivity,maintaingreen,healthy,safe,andsustainable cities[9].
The NDBI is calculated using satellite imagery, typically from sensors like Landsat, Sentinel-2, or other multispectral satellites. These sensors capture data in various spectral bands, including the near-infrared (NIR) and shortwave infrared (SWIR). The NDBI is computed usingtheformula[4]:
where SWIR is the reflectance in the shortwave infrared band and NIR is the reflectance in the near-infrared band. Built-upareastendtohavehigherreflectanceintheSWIR band compared to the NIR band, resulting in higher NDBI values. Note that the NDBI on this Landsat 8 image uses SWIRandNIRchannels,mergingbandfiveandband6.
The next step involves performing atmosphericcorrection using the relative atmospheric correction method [10] Severalatmosphericcorrectionmethodscanbeemployed, such as Dark Object Subtraction (DOS), Covariance Matrix Method (CMM), Multi-Band Regression technique (MBR), andRadiometricControlAreamethod(RCA),dependingon the pixel image issues encountered. The DOS method is commonly used, assuming that some atmospheric effects, such as scattering, can be removed by identifying the darkest pixels in an image and subtracting their values from all other pixels. In this atmospheric correction, pixel values are used as correction values due to atmospheric disturbancesduringimagecapture.Thelowestpixelvalues in the visible and NIR regions approximate atmospheric path radiance. Equation (2) shows the algorithm used for atmosphericcorrection[11]
whereDOSj isrepresentedpathradianceortheinfluenceof atmosphericeffectsfromdarktargetof j, Meanj isthemean reflectance value of the selected dark target pixels from band j,andSTDj isthestandarddeviationofthereflectance valuesoftheselecteddarktargetpixelsfromband j [12].
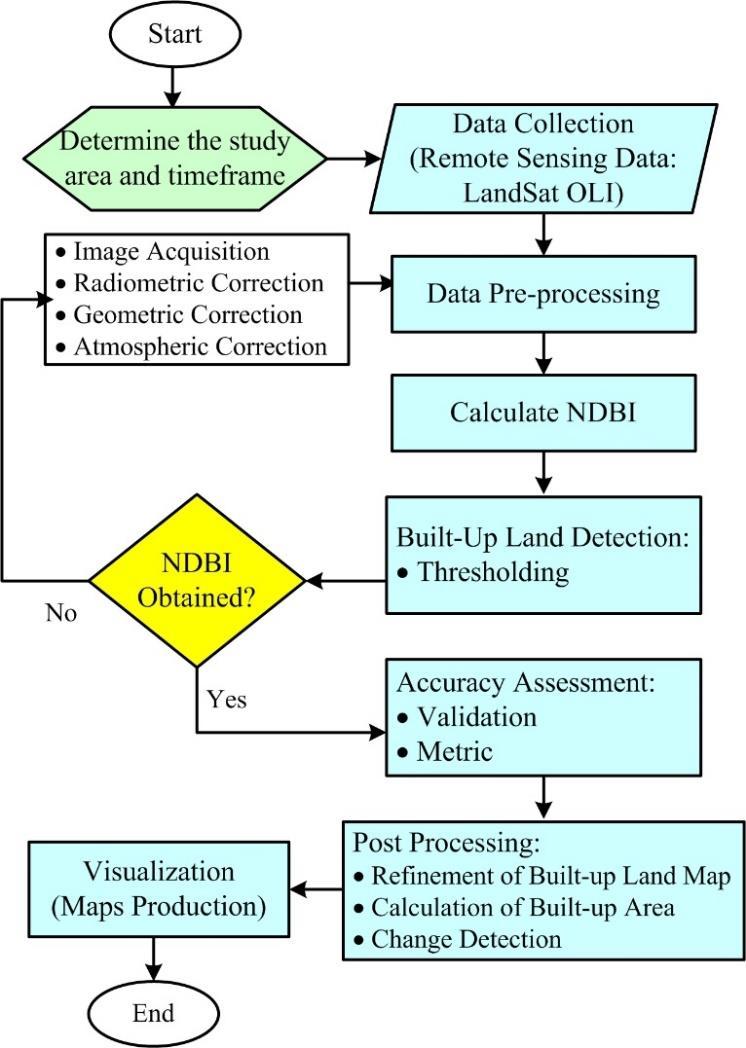
When the computation of NDBI is obtained, Figure 2 illustrates the process of using the NDBI for land use analysiswithremotesensingdata fromLandSat,including steps such as data collection, image processing, and accuracy assessment [13]. The flowchart in Figure 2 depicts the process which begins with defining the study area and timeframe, followed by data collection and processing. The main steps involve image acquisition, corrections(radiometric,geometric,atmospheric),feature extraction,indexcalculation,andimageclassification. The focus is on detecting built-up land through thresholding and segmentation. Once the NDBI is obtained, accuracy assessment through validation and metrics is conducted.
International Research Journal of Engineering and Technology (IRJET) e-ISSN: 2395-0056
Volume: 11 Issue: 07 | July 2024 www.irjet.net p-ISSN: 2395-0072
The results are then visualized using maps, followed by analysis and interpretation, which include spatial and trend analysis. Finally, the process concludes with reportingandrecommendations.
3.1 NDBI Transformation
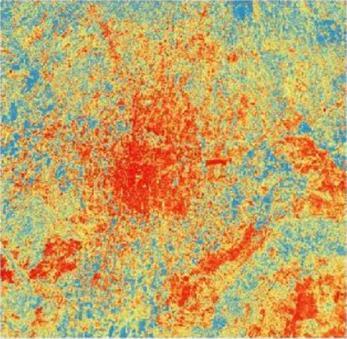
Figure 3 shows the NDBI transformation result in Surabaya City.Theimageclearlydemonstratesthespatial distribution of built-up areas in Surabaya, with a concentrationofurbandevelopmentinthecentralregion, namelythenorthernpartofSouthSurabayaCityandmore scattered or less dense built-up areas towards the outskirts.
a). Red Areas: These indicate high NDBI values, suggesting dense built-up or urban areas. In this figure, the central part with the most intense red likely represents the city center or highly urbanized regionsofSurabaya.
b). Yellow/Orange Areas: These areas have moderate NDBI values, indicating less dense or semi-urban built-upareas.
c). Blue/Green Areas:Theseregionshavelowornegative NDBIvalues,representingnon-built-upareassuchas vegetation,waterbodies,oropenland.
3.2 Built-Up and Non Built-Up Areas Analysis
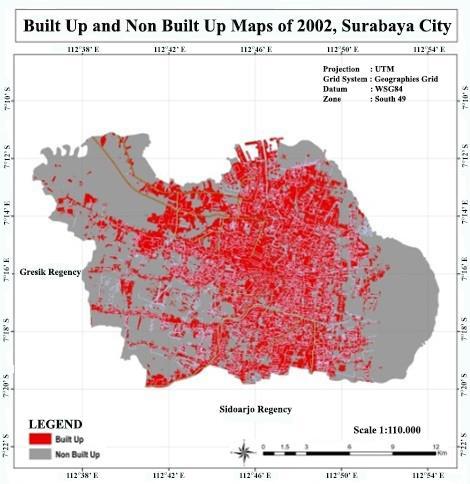
Figure 4 shows the map represents the built-up and nonbuilt-up areas of Surabaya City in 2002, with data projected using the UTM system and a geographic grid basedontheWGS84datum.Themapusescolorcodingto distinguishbetweenbuilt-upareas(red)andnon-built-up areas (gray). To perform a quantitative analysis, we need to measure the area covered by built-up and non-built-up regionsandanalyzetheirspatialdistribution.
The total area of Surabaya City in 2002 is approximately35054km².
Built-upareacoverage:Accordingtothemap,thebuiltup area (marked in red) appears to cover a significant portion of the city's total area. Based on GIS tools, the built-up areas cover approximately 56% of the city's total area, and then the built-up area is about 213.36 km2
The built-up areas are predominantly concentrated in the central and northern parts of Surabaya. This distribution indicates a high level of urbanization in
International Research Journal of Engineering and Technology (IRJET) e-ISSN: 2395-0056
Volume: 11 Issue: 07 | July 2024 www.irjet.net p-ISSN: 2395-0072
these regions, likely corresponding to the city's commercial, residential, and industrial zones. The central concentration suggests a dense urban core, typicalofmetropolitandevelopmentpatterns.
The non-built-up areas are mainly located in the western, southern, and peripheral regions of the city. These areas may consist of agricultural land, open spaces, and less developed regions, reflecting lower populationdensityandurbaninfrastructure.
The limited non-built-up areas within the urban core suggestascarcityofgreenspaces,whicharecrucialfor environmental sustainability, urban cooling, and residents'qualityoflife.
Thehighconcentrationofbuilt-upareascancontribute to the urban heat island effect, where urban regions experience higher temperatures than their rural surroundings due to human activities and built environments.
The map clearly shows the extent of urban sprawl in Surabaya as of 2002. The significant presence of built-up areas highlights the city's rapid urbanization, a common trendinmanySoutheastAsiancities.Theurbanexpansion appears to follow the main transportation routes, indicating the influence of infrastructure development on urbangrowth.
With the same analysis as Figure 4, the built-up area in 2022 from Figure 5 is estimated around 68% or 259,08 km2. This means that during 20 years there has been an increase of around 45.72 km2 or 2143%. The majority of SurabayaCityappearstobebuilt-upandspreadacrossthe city, with a higher concentration towards the central and western parts. While for Non-built-up areas are relatively sparse and scattered throughout the city. These areas are more prominent on the outskirts, especially towards the northern and eastern regions. The central and western partsofthecityshowdenseurbandevelopment,reflecting thecity'sexpansionandpopulationconcentrationinthese areas. This widespread development might require comprehensive planning to ensure balanced growth and avoidoverburdeningcertainareas.
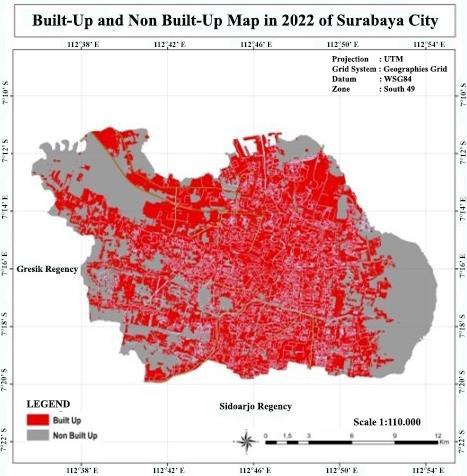
The NDBI method was successfully used to estimate the built-upareaofSurabayaCity,whichspansapproximately 350.54 km². Over a 20-year period, the built-up area increased from around 213 km² in 2002 to 259 km² in 2022, representing a 21% growth. This substantial increase highlights rapid urbanization and underscores the need for sustainable urban planning to manage the city'sdevelopment.For future research, the NDBImethod can be compared with other methods such as NDVI, Normal Difference Water Index (NDWI), modification of land use/land cover (LULC), or other remote sensing techniquesformoreaccurateresultsandinterpretation.
International Research Journal of Engineering and Technology (IRJET) e-ISSN: 2395-0056
Volume: 11 Issue: 07 | July 2024 www.irjet.net p-ISSN: 2395-0072
The author would like to thank you goes to Ms. Anjani Maisyarani Putri of Undergraduate student of Urban and Regional Planning Study Program, Institut Teknologi NasionalYogyakarta,Indonesiaforsatellitedatacollection thatwasusedinthiswork.
[1] C. V. M. Sajow, R. Palamba, and J. A. Ruru, "Land Use andLandCoverChangesandTheirImpactsonFlood EventsinManadoCity," Journal of Environmental and Earth Sciences,vol.6,no.2,pp.147-159,2016.
[2] T. M. Lillesand and R. W. Kiefer, Remote Sensing and Image Interpretation,3rded.,NewYork:JohnWiley& Sons,1993.
[3] Q. Zhang and K. C. Seto, "Mapping urbanization dynamics at regional and global scales using multitemporal DMSP/OLS nighttime lights data," Remote Sensing of Environment, vol. 115, no. 9, pp. 23202329,2011.
[4] Y.Zha,J.Gao,andS.Ni,"Useofnormalizeddifference built-up index in automatically mapping urban areas from TM imagery," International Journal of Remote Sensing,vol.24,no.3,pp.583-594,2003.
[5] H. Xu, "Extraction of urban built-up land features from Landsat imagery using a thematic-oriented index combination technique," Photogrammetric Engineering & Remote Sensing, vol. 73, no. 12, pp. 1381-1391,2007.
[6] C. He, Z. Liu, J. Tian, and Q. Ma, "Urban expansion dynamics and natural habitat loss in China: A multiscale landscape perspective," Global Change Biology,vol.16,no.9,pp.2886-2902,2010.
[7] J. Chen, P. Gong, C. He, R. Pu, and P. Shi, "Landuse/land-cover change detection using improved change-vector analysis," Photogrammetric Engineering & Remote Sensing,vol.69,no.4,pp.369379,2003.
[8] SurabayaCityGovernment, Surabaya in Figures 2019, Surabaya:BadanPusatStatistik(BPS)KotaSurabaya, 2019.Available:SurabayainFigures2019.
[9] United Nations, World Urbanization Prospects: The 2018 Revision, New York: United Nations, 2019. Available: https://population.un.org/wup/Publications/Files/ WUP2018-Report.pdf.
[10] P. S. Chavez, "An improved dark-object subtraction technique for atmospheric scattering correction of multispectral data," Remote Sensing of Environment, vol.24,no.3,pp.459-479,1988.
[11] P. Wicaksono and M. Hafizt, "Comparison of atmospheric correction methods for multi-temporal satellite images over land," International Journal of Remote Sensing, vol. 39, no. 6, pp. 1-15, 2018. doi: 10.1049/iet-ipr.2017.0295.
[12] C. Song, C. E. Woodcock, K. C. Seto, M. P. Lenney, and S. A. Macomber, "Classification and change detection using Landsat TM data: When and how to correct atmosphericeffects?" Remote Sensing of Environment, vol.75,no.2,pp.230-244,2001.
[13] C. He, P. Shi, D. Xie, and Y. Zhao, "Improving the normalized difference built-up index to map urban built-up areas using optical remote sensing data," International Journal of Remote Sensing, vol. 31, no. 24,pp.7011-7024,2010.

Wayan Suparta, is a principal lecturer at the Institut Teknologi Nasional Yogyakarta (2022-Now) and the professional title of Engineer(Ir.)inElectricalEngineeringwas obtained from the Indonesian Institute of Technology (ITI) of South Tangerang City in 2024 He received the degree of Doctor of Philosophy (PhD) in Electrical, Electronic and Systems Engineering from TheNationalUniversityofMalaysia(UKM), Bangi,Selangorin2008 Hewaslecturerof ElectronicsEngineeringofLegendaCollege Group, Malaysia A Post-Doctoral Fellow (2007-2008),SeniorLecturer(2008-2012) and Associate Professor (2012-2017) in UKM He teaches communication engineering, digital signal processing, instrumentation and control, robotics and industrial automation, machine learning, advanced softcomputing, etc His research focused on GPS/GNSS technology, communication systems (remote sensing), smartsystems,andUAV/drones
Hill Gendoet Hartono earnedabachelor's degree in Geological Engineering from the NationalTechnologyCollegeof Yogyakarta in 1993 He received a master's degree from the Bandung Institute of Technology specializinginvolcanicgeologyin2000 He received a doctorate in geology on ancient volcanoes from Padjajaran University in Bandung in 2010 He is a permanent lecturer at the Institut Teknologi Nasional Yogyakarta(ITNY),Indonesia(since1993) Heteachesvolcanicpetrology,volcanology, volcanic stratigraphy. His research is volcanic petrology and determining the centerofancientvolcaniceruptions.