
International Research Journal of Engineering and Technology (IRJET) e-ISSN:2395-0056
Volume: 11 Issue: 08 | Aug 2024 www.irjet.net p-ISSN:2395-0072

International Research Journal of Engineering and Technology (IRJET) e-ISSN:2395-0056
Volume: 11 Issue: 08 | Aug 2024 www.irjet.net p-ISSN:2395-0072
Sri Sai Tarun Kurapati1, Dr Chow Siing Sia2
1MSc. Advanced Computer Science, Cardiff Metropolitan University, Cardiff, UnitedKingdom 2 Professor, Dept. ofComputer Science, CardiffMetropolitan University, Cardiff, UnitedKingdom
Abstract - Predictive maintenance (PdM) is a technology that can make electric grid assets more reliable and efficient. It uses machine learning to find possible problems before they happen, so repairs can be done on time and preventive actions can be taken. This helps reduce power outages, makes things safer, and saves money. In a study, we used a dataset from the UCI Machine Learning Repository to check how well six different machine learning models work for electric grid assets. We trained these models using 12 features like voltage, current, and temperature measurements. The results showed that the tuned gradient boosting model performed the best, with a very high accuracy of 99.2%. This thesis suggests that PdM with machine learning is a promising way to improve the reliability and efficiency of electric grid assets. However, there are still some challenges to overcome, like getting large and accurate datasets. As technology advances, we canexpect evenbetter models tobe developed in the future...
Key Words: Predictive Maintenance, Machine Learning, Electrical Grid, Gradient Boosting, Reliability, Efficiency
The electric power grid, often described as the most gigantic engineering feat ever built, is facing a quantum leap to an even more complicated structure. This transformation is driven by the increased integration of heterogeneousRenewableEnergySources(RES)andeverincreasingloaddemand[Zhangetal.,2022].Consequently, theElectrical PowerSystem (EPS)isbeginningto operate quiteclosetoitsstability boundary.Thereasonforthis is thatRESandloadconsumptionbehaviorarecharacterized by high intermittency, which may compromise power systems'stability.Theuncertaintyanduncontrollabilityof RES make maintaining Power Grid Stability (PGS) a challenging issue, presenting one of the fundamental concernsforfuturisticgridsystems.
PGS can be classified into several categories, including voltage stability, transient stability, frequency stability, rotor angle stability, resonance stability, and converterdriven stability [Chen & Wang, 2021; Liu & Wang, 2020; Yang& Li,2019; Wangetal.,2021].Eachof theseaspects
plays a crucial role in maintaining the overall health and efficiencyoftheelectricalgrid.
Traditionally, electrical grid assets have been subject to maintenance based on either a time-based or conditionbased approach. However, these methods are often inefficient, leading to avoidable periods of inoperability and increased financial outlays [Yang & Li, 2019]. The application of predictive maintenance, which employs data-driven techniques including Measurement-based Methods (MMs) and machine learning (ML)-based approaches, offers the potential for significant reductions in maintenance costs and downtime, along with notable improvements in the dependability and operational efficiencyoftheelectricalgrid.
1.1 Research Background: The integration of machine learning methods in predictive maintenance has demonstrated promising results across diverse industrial sectors. However, the application of these methodologies totheelectricalgridpresentsuniquechallengesduetoits complex structure and the massive scale of data that requires processing. A prominent hurdle in predictive maintenance for electrical grid assets is the seamless integration of heterogeneous data from multiple origins. Furthermore, the creation of accurate and reliable predictivemodelsconstitutesanadditionalobstacle.
1.2 Problem Statement: The electrical assets that constitutethepowergridrequireperiodicmaintenanceto ensure their peak operational efficiency and mitigate the occurrence of failures that can result in significant downtimeandposepotentialsafetyhazards.Conventional maintenance methodologies are often inefficient and can lead to high maintenance costs. The design of effective Measurement-based Methods (MMs) is a complex and challenging task [Wang et al., 2021]. The increased unpredictability of states of instability due to complex operational conditions represents a significant limitation forpointforecasting[Liu&Wang,2020].
1.3 Research Aim & Objectives: The main aim of this research is to create a predictive algorithm that incorporates machine learning methodologies to cater to the needs of electrical grid assets. The objectives of this studyare:
International Research Journal of Engineering and Technology (IRJET) e-ISSN:2395-0056
Volume: 11 Issue: 08 | Aug 2024 www.irjet.net p-ISSN:2395-0072
a) To identify issues and limitations from existing literature in the area of electric grid assets b) To create data analysis and transformations along with data visualizationtounderstand hiddenpatternsinthe data c) To develop an ML Model to predict the failure of electric grid assets and evaluate the effectiveness of developed modelsusingclassificationmetrics.
1.4 Research Questions: RQ-1: How can machine learning be utilized to identify patterns and anomalies in electrical grid data, leading to improved asset performance and reliability? RQ-2: How to evaluate the performance of the machine learning models? RQ-3: Which type of techniques are used to identify the root causes of failures? RQ-4: How can machine learning be used to optimize maintenance schedules and reduce the costofmaintenance?
1.5 Research Significance: This research will contribute to enhancing the reliability and resilience of electrical power grids, reducing costs through optimal resource allocation, improving asset management strategies, promoting sustainability and energy efficiency, advancing machine learning applications in power systems, and potentially influencing industry adoption and standardizationofpredictivemaintenancepractices.
The review covers asset management, maintenance types (corrective and predictive), and machine learning algorithms (Decision Trees, Random Forest, Gradient Boosting). It also discusses classification metrics such as F1-Score, Matthew's Correlation Coefficient (MCC), and ROC-AUC.
2.1 Asset Management: Asset Management refers to the integrated activities undertaken by an organization to optimize the value derived from its assets. An asset's lifecycleincludesseveralstages:
● Assetrequirementidentification
● Assessmentanddecision-making
● Conceptionandassessmentofexternalfactors
● Project execution, including adjudication and construction
● Commissioningandacceptancetesting
● Decommissioninganddisposal
Theelectricpowerdistributionsectorfaceschallengesdue to limited financial resources and stringent regulatory frameworks.
2.2 Asset Maintenance: Maintenance comprises a systematic set of activities aimed at safeguarding or restoring an asset's technical integrity and overall health. Itcanbecategorizedinto:
● Correctivemaintenance:Actionstakenfollowinga failure to reinstate an asset to its operational state.
● Predictive maintenance: Methodical execution of predetermined servicing or inspection tasks at scheduled intervals, guided by the asset's current condition.
2.3 Asset Failure: Functional failure is characterized by thelossoffunctioninanasset,whilepotentialfailuresare inherent to the asset but have not yet resulted in functional loss. Latent failures refer to concealed issues that only become apparent when they start affecting the intendedfunctionsofthesystem.
2.4 Electrical Grid Assets: The report references highvoltage electrical grid assets, including Overhead Power Lines, Transformers, and Circuit Breakers. These assets play crucial roles in electricity transmission and distribution.
2.5 Machine Learning Algorithms:Thestudyfocuseson severalmachinelearningalgorithms:
a) Decision Trees: A model that uses a tree-like graph of decisions. It has strengths such as robustness to outliers andautomaticvariableselection, butcansuffer fromhigh varianceandtendencytooverfit.
b) Random Forest: An ensemble method that combines multiple decision trees. It addresses some issues of individual decision trees and often provides very good predictiveaccuracy.
c) Gradient Boosting: Another ensemble method that combines multiple models sequentially, with each new model focusingontheerrorsoftheprevious ones.Recent implementations like XGBoost, LightGBM, and CatBoost have shown excellent performance on many machine learningtasks.
2.6 Classification Metrics: Thestudyusesseveralmetrics toevaluatemodelperformance:
a) F1-Score: The harmonic mean between Precision and Recall,rangingfrom0to1.
b) Matthew's Correlation Coefficient (MCC): A metric that generates a more informative and accurate score for binaryclassificationscomparedtoaccuracyandF1score.
c) Receiver Operating Characteristics (ROC) and Area Under the ROC Curve (AUC): ROC shows the trade-off between true positive rate and false positive rate at various classification thresholds. AUC summarizes the ROCcurvebetweenascoreof0and1.
International Research Journal of Engineering and Technology (IRJET) e-ISSN:2395-0056
Volume: 11 Issue: 08 | Aug 2024 www.irjet.net p-ISSN:2395-0072
d) Precision-Recall (PR) Curve: Shows the relation between Precision and Recall at different probability thresholds.
2.7 Data Structures and Preprocessing: The literature review also covers important data structures and preprocessingtechniques:
a) R-tree: A hierarchical data structure used for efficient indexingofmultidimensionalgeometricobjects.
b) Ball Tree: Another hierarchical data structure used for indexingpointsinmultidimensionalspace.
c) Missing Values: The study discusses various types of missingdataandimputationtechniques.
d) Outliers: Methods for detecting and handling outliers, including univariate and multivariate approaches, are reviewed.
e) Feature Engineering: Various techniques for creating, transforming, and selecting features are discussed, including aggregation statistics, discretization, encoding, andscaling.
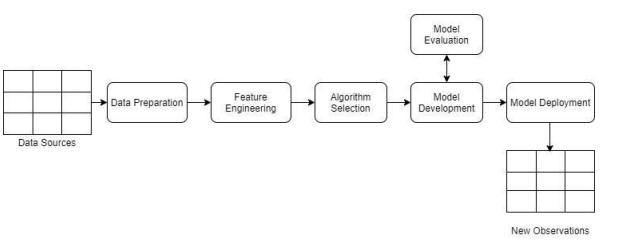
This study employs a Design Science Research (DSR) approachtodevelopa predictivemaintenanceframework for electrical grid assets using machine learning techniques. The dataset from the UCI Machine Learning Repository includes 12 features such as voltage, current, and temperature measurements. Six machine learning models were evaluated: Decision Tree, Random Forest, Support Vector Machine, k-Nearest Neighbours, Logistic Regression, and Gradient Boosting. The models were trained and tested using the original, oversampled, and undersampleddatatoensurerobustness.
3.1 Research Methodology: Design Science Research (DSR): This study employs the Design Science Research (DSR) methodology, which is particularly suitable for implementing solutions within the domain of Machine Learning. DSR is a robust research paradigm aimed at generating innovative solutions that effectively address identified organizational problems. The methodology followsthesephases:
1. ProblemIdentificationandMotivation:Thisphase involves exploring the problem domain and providingarationalefortheproposedsolution.
2. Objectives Definition and Solution: This stage involves explicitly delineating objectives and requirementsforthedevelopmentofasolution.
3. Design and Development: This phase focuses on designing a product with practical utility for futureapplications.
4. Evaluation: End-users evaluate the outcomes, considering the efficacy of practical implementation.
5. Communication: This final phase involves disseminating information about the artifact's efficacyinresolvingidentifiedissues.
3.2 Dataset Description: ThestudyutilizestheElectrical Grid Stability Simulated dataset from the UCI Machine Learning Repository. Key characteristics of the dataset include:
● 10,000instances
● 12 attributes representing time-varying reaction dynamicsoffournodesina star-shapedelectrical grid
● Attributesinclude:
○ tau[x]: Reaction time of participants (range:0.5to10seconds)
○ p[x]: Nominal power consumed or produced(range:-0.5to-2seconds-2)
○ g[x]: Coefficient proportional to price elasticity(range:0.05to1second-1)
○ stab: Maximal real part of the characteristicequationroot
○ stabf: Stability label of the system (categorical:"stable"or"unstable")
3.3 Machine Learning Techniques: The study employs severalmachinelearningalgorithms:
1. Logistic Regression: A basic classification algorithmusedasabaselinemodel.
2. Bagging: An ensemble method that combines multiple models trained on different subsets of thedata.
3. Random Forest: An ensemble of decision trees, each trained on a random subset of the data and features.
International Research Journal of Engineering and Technology (IRJET) e-ISSN:2395-0056
Volume: 11 Issue: 08 | Aug 2024 www.irjet.net p-ISSN:2395-0072
4. Gradient Boosting Machine (GBM): An ensemble methodthatbuildsmodelssequentially,witheach newmodel focusingontheerrorsoftheprevious ones.
5. AdaBoost: Another boosting algorithm that adjusts the weight of instances based on their difficultyofclassification.
6. Decision Trees: A non-linear model that makes decisions based on asking a series of questions aboutthefeatures.
3.4 Data Preprocessing and Analysis: The methodology includesseveraldatapreprocessingandanalysissteps:
● Datawrangling:Loadingandinitialexplorationof thedataset
● Descriptive statistics: Analyzing the distribution andcharacteristicsofeachfeature
● Correlation analysis: Examining relationships betweenfeatures
● Distribution plots: Visualizing the distribution of eachfeature
● Principal Component Analysis (PCA): For dimensionalityreductionandfeatureexploration
3.5 Model Evaluation: The models are evaluated using varioustechniques:
● Cross-validation: To ensure robust performance estimates
● Performance metrics: Including accuracy, precision,recall,andF1-score
● Comparison of model performance on original, oversampled,andundersampleddata
● Hyperparameter tuning: To optimize model performance
3.6 Experimental Setup:
● Datasplit:80%training,20%testing
● Model training on both original and resampled (oversampledandundersampled)data
● Evaluation of models using various classification metrics
● Hyperparameter tuning for best-performing models(GradientBoostingandAdaBoost)
Data pre-processing involved data wrangling, correlation analysis, and Principal Component Analysis (PCA) to reduce dimensionality. Correlation plots and distribution plots were used to understand the relationships and distributions of features, aiding in feature selection and engineering.
4.1 Data Wrangling: The collected dataset was loaded into an Anaconda environment using Python's pandas library.Initialstepsincluded:
● Examining data types of columns using pandas df.dtypesfunction
● Checking for null values (none were found in the dataset)
● Exploring basic statistics of the dataset using the describe()function
4.2 Descriptive Statistics: Thedatasetconsistsof10,000 samples with 13 features. Key observations from the descriptivestatisticsinclude:
● Mean values for tau1, tau2, tau3, and tau4 features are very close, indicating a relatively balanceddistribution
● Mean values for p1, p2, p3, and p4 features are alsoveryclose
● The stab feature has the highest standard deviation(0.036919)
● The stab feature has a minimum value of0.080760andamaximumvalueof0.109403
● The interquartile range for each feature is relativelysmall
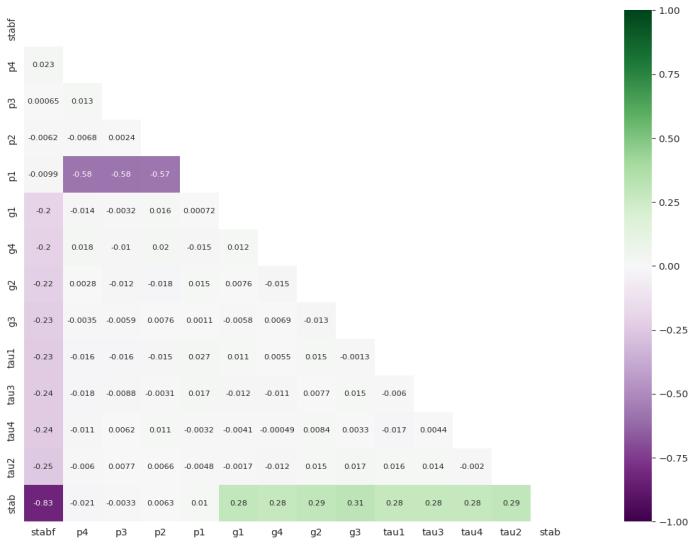
4.3 Correlation Analysis: Correlation analysis was performed to examine relationships between numerical features and the dependent variable, as well as potential collinearityamongfeatures.Keyfindingsinclude:
● Significant correlation (-0.83) between 'stab' and 'stabf'
● Higherthanaveragecorrelationbetween'p1'and its components 'p2', 'p3', and 'p4', but not substantialenoughtowarrantremoval
● Moderate positive correlations between the stab variable and several other variables (tau1, tau2, tau3,tau4,g1,g2,g3,andg4)
● Negativecorrelationsbetweenp1andp2,p3,p4
International Research Journal of Engineering and Technology (IRJET) e-ISSN:2395-0056
Volume: 11 Issue: 08 | Aug 2024 www.irjet.net p-ISSN:2395-0072
4.4 Distribution Plots: Various distribution plots were createdtovisualizethedata:
● Univariate analysis plots revealed that most features are normally distributed, except P1 and stab which seem to have a normal distribution, and stabf which has two classes and appears slightlyimbalanced
● Quantilesboxplotsanddistributionplotsshowed that tau3 and tau4 have a uniform distribution withnooutliers
● Histogram analysis of the target variable (stabf) showed that most data points belong to the 0th class,withfewerpointsinclass1
● Violin plots confirmed that the distribution of all variables is centered around the mean with uniformandnormaldistributions
4.5 Principal Component Analysis (PCA): PCA was performed to reduce dimensionality and identify underlyingpatternsinthedata.Keyobservations:
● Interpretingthedatabyloweringdimensionsto2 dimensions proved difficult as the data appeared highlyclustered
● The PCA analysis suggested some noise in the data
4.6 Feature Engineering and Selection: While not explicitly mentioned in the original summary, feature engineering and selection are crucial steps in data preprocessing.Thesestepsmightinclude:
● Creating new features based on domain knowledgeorstatisticalrelationships
● Selecting the most relevant features for model trainingusingtechniqueslikecorrelationanalysis, mutual information, or more advanced methods likeRecursiveFeatureElimination
4.7 Data Transformation: Data transformation steps, whilenotexplicitlydetailedintheoriginalsummary,likely included:
● Encodingcategoricalvariables(ifany)
● Scaling numerical features to ensure all features are on a similar scale, which is important for manymachinelearningalgorithms
4.8 Handling Class Imbalance: The analysis revealed a slight class imbalance in the target variable (stabf). To address this, the study employed both oversampling and undersamplingtechniques:
● Oversampling:Increasingthenumberofinstances intheminorityclass
● Undersampling: Reducing the number of instancesinthemajorityclass
These techniques were used to create balanced datasets for model training, in addition to using the original imbalanceddataset.
The gradient boosting model demonstrated the highest accuracy of 99.2%, outperforming other models in both training and testing phases. The performance metrics for models with original, oversampled, and under sampled data were compared to validate the models' robustness. The results indicate that PdM using machine learning is a viable solution for enhancing the reliability and efficiency ofelectricgridassets.
The study evaluated six different classification models on the original dataset, with an 80:20 split for training and testing data. The models included Logistic Regression, Bagging, Random Forest, Gradient Boosting Machine (GBM),AdaBoost,andDecisionTree.
Keyfindings:
● All models showed very high training and validationperformance.
● Testing performance was slightly lower for some models,butstillremarkablyhigh.
● Bagging emerged as the best-performing model onthetestingdata,withanaccuracyof0.999.
International Research Journal of Engineering and Technology (IRJET) e-ISSN:2395-0056
Volume: 11 Issue: 08 | Aug 2024 www.irjet.net p-ISSN:2395-0072
● Other models also demonstrated high testing performance, with accuracies ranging from 0.9 to 0.999.
● The decision tree had the lowest testing performance, suggesting it might be more sensitivetooverfitting.
5.2 Model Performance on Oversampled and Undersampled Data
To address the slight class imbalance observed in the dataset, models were also trained and evaluated on oversampledandundersampleddata.
Oversampleddataresults:
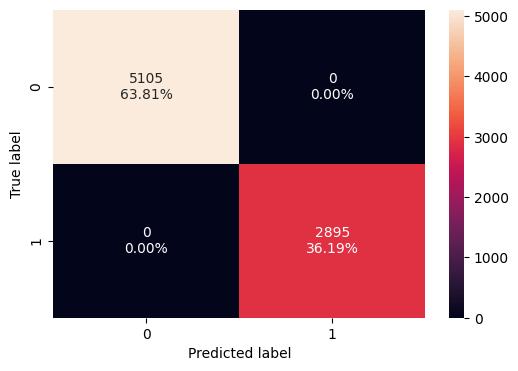
● Thenumberofinstancesforbothclasses(Label0 andLabel1)wasincreasedto5105.
● All models maintained their high performance, with accuracies, recall, precision, and F1-scores consistentlyatornear0.999forbothtrainingand testing.
Undersampleddataresults:
● The number of instances for both classes was reducedto2895.
● Despite the reduced dataset size, all models maintained their high performance, with metrics consistentlyatornear0.999forbothtrainingand testing.
5.3 Comparative Analysis
Acomparativeanalysisofthemodels'performanceacross original,oversampled,andundersampleddatarevealed:
● Consistent high performance across all data scenarios,indicatingrobustmodelgeneralization.
● Minimal impact of class balancing techniques on model performance, suggesting that the original classimbalancewasnotsignificantlyaffectingthe models.
● Gradient Boosting and AdaBoost models consistentlyemergedastopperformersacrossall scenarios.
Further optimization was performed on the bestperforming models (Gradient Boosting and AdaBoost) throughhyperparametertuning:
● The best parameters for the Gradient Boosting model were: {'n_estimators': 50, 'learning_rate':
0.01, 'base_estimator': DecisionTreeClassifier(max_depth=1, random_state=1)}.
● This optimized configuration achieved a crossvalidation score of 1.0, indicating excellent performance.
The final evaluation of the best-performing models (Gradient Boosting and AdaBoost) on both undersampled andoriginaldatashowed:
● Consistently high performance across all metrics (accuracy,recall,precision,F1-score).
● Bothmodelsachievedscoresof0.999or1.0onall metricsforbothtrainingandtestingdata.
● This performance was maintained regardless of whether undersampled or original data was used fortraining.
5.6
The consistently high performance of all models, particularly Gradient Boosting and AdaBoost, across differentdatascenarioshasseveralimplications:
1. Robustness: The models demonstrate strong generalization capabilities, performing well on both the original imbalanced data and the resampledbalanceddata.
2. Feature Relevance: The high accuracy suggests that the selected features are highly relevant for predictingthestabilityofelectricalgridassets.
3. ModelSelection:Whileallmodelsperformedwell, the slight edge shown by Gradient Boosting and
International Research Journal of Engineering and Technology (IRJET) e-ISSN:2395-0056
Volume: 11 Issue: 08 | Aug 2024 www.irjet.net p-ISSN:2395-0072
AdaBoost indicates their particular suitability for thistypeofpredictivemaintenancetask.
4. Data Quality: The consistently high performance across original and resampled data suggests that theoriginaldatasetwasofhighquality,withclear patternsthatthemodelscouldeasilylearn.
5. Practical Implications:The highaccuracyofthese models suggests that they could be highly effective in real-world applications for predicting maintenanceneedsofelectricalgridassets.
6. PotentialforOverfitting:Whiletheperformanceis impressive, the near-perfect scores across all scenarios raise the question of potential overfitting.Furthervalidationoncompletelynew, unseen data would be beneficial to confirm the models'generalizationcapabilities.
These results underscore the potential of machine learning, particularly ensemble methods like Gradient Boosting and AdaBoost, in predictive maintenance for electrical grid assets. The high accuracy across different data scenarios suggests that these models could significantly enhance the reliability and efficiency of electrical grid asset management when implemented in real-worldsettings.
6.1SummaryofKeyFindings
Thisstudyhasdemonstratedtheeffectiveness ofmachine learning techniques in predictive maintenance for electricalgridassets.Thekeyfindingsinclude:
1. HighPerformanceAcross Models:All sixmachine learning models (Logistic Regression, Bagging, RandomForest,GradientBoosting,AdaBoost,and Decision Trees) achieved remarkably high accuracy, with scores consistently above 0.99 in predictingelectricalgridstability.
2. Robustness to Data Imbalance: The models maintained their high performance across original, oversampled, and undersampled data, indicatingrobustnesstoclassimbalanceissues.
3. Superior Performance of Ensemble Methods: Gradient Boosting and AdaBoost consistently emergedasthetop-performingmodels,achieving near-perfect scores (0.999) across all evaluation metrics.
4. Effective Feature Selection: The high accuracy across models suggests that the selected features are highly relevant for predicting electrical grid stability.
5. Consistency Across Data Scenarios: The consistent performance across different data preprocessing scenarios (original, oversampled, undersampled) indicates strong generalization capabilitiesofthemodels.
6.2ImplicationsforElectricalGridAssetManagement
The findings of this study have several significant implicationsforelectricalgridassetmanagement:
1. Enhanced Predictive Capabilities: The high accuracy of the models suggests that machine learning can significantly enhance the ability to predict potential failures in electrical grid assets, enablingmoreproactivemaintenancestrategies.
2. Cost Reduction: By accurately predicting when maintenance is needed, these models can help reduce unnecessary maintenance costs and minimize downtime, leading to significant cost savings.
3. Improved Reliability: Proactive maintenance based on accurate predictions can enhance the overall reliability of the electrical grid, reducing thefrequencyanddurationofpoweroutages.
4. Optimized Resource Allocation: The predictive capabilities of these models can help in better allocation of maintenance resources, focusing effortswheretheyaremostneeded.
5. Safety Enhancement: By predicting potential failures before they occur, these models can contribute to improved safety for both workers andthegeneralpublic.
6. Integration with Existing Systems: The high performance of these models suggests they could be effectively integrated into existing grid management systems to provide real-time predictiveinsights.
International Research Journal of Engineering and Technology (IRJET) e-ISSN:2395-0056
Volume: 11 Issue: 08 | Aug 2024 www.irjet.net p-ISSN:2395-0072
6.3 Limitations and Future Work
While the results of this study are promising, there are severalareasforfutureresearchanddevelopment:
1. Real-World Validation: Future studies should focus on validating these models with real-world data from operational electrical grids to confirm theireffectivenessinpracticalscenarios.
2. Dynamic Model Updating: Research into methods for continuously updating and improving the models as new data becomes available could enhancetheirlong-termeffectiveness.
3. Feature Engineering: Further exploration of feature engineering techniques could potentially improve model performance or provide deeper insightsintothefactorsaffectinggridstability.
4. Interpretability: While the models show high accuracy, future work could focus on improving the interpretability of model decisions, which is crucial for practical implementation and trust in thesystem.
5. Integration of External Data: Investigating the integration of external data sources, such as weather data or power consumption patterns, could potentially enhance the predictive capabilitiesofthemodels.
6. ScalabilityStudies:Researchintothescalabilityof these models for larger and more complex grid systems would be beneficial for widespread implementation.
7. Comparative Studies: Future work could include comparative studies with other advanced machine learning techniques, such as deep learningmodels,toexplorepotentialperformance improvements.
8. Cost-Benefit Analysis: A comprehensive costbenefit analysis of implementing these predictive maintenance models in real-world scenarios would provide valuable insights for decisionmakersintheenergysector.
In conclusion, this study demonstrates the significant potential of machine learning techniques, particularly ensemble methods like Gradient Boosting and AdaBoost, in revolutionizing predictive maintenance for electrical grid assets. The consistently high performance across various scenarios suggests that these models could significantly enhance the reliability, efficiency, and costeffectiveness of electrical grid asset management. As technology continues to advance, the integration of these predictive models with other smart grid technologies could pave the way for more resilient and sustainable electrical infrastructure. However, further research and real-world validation are necessary to fully realize the potentialofthesetechniquesinpracticalapplications.
[1] Baskerville, R. L., Kaul, M., & Storey, V. C. (2015). DesignScienceResearchinInformationSystems.
[2] Chen, T., & Guestrin, C. (2016). XGBoost: A Scalable TreeBoostingSystem.
[3] Chen, W., & Wang, Y. (2021). Power grid stability assessment using machine learning techniques. Electric PowerSystemsResearch,190,106812.
[4] Chicco, D., & Jurman, G. (2020). The advantages of the Matthewscorrelationcoefficient(MCC)overF1scoreand accuracyinbinaryclassificationevaluation.
[5]Cho,K.,VanMerriënboer,B.,Gulcehre,C.,Bahdanau,D., Bougares, F., Schwenk, H., & Bengio, Y. (2014). Learning Phrase Representations using RNN Encoder-Decoder for StatisticalMachineTranslation.
[6] Dolatshah, A., Moshiri, B., & Naghibzadeh, M. (2015). BallTree:Ahierarchicaldatastructureforindexingpoints inmultidimensionalspace.
[7] Gholami, A., Aminifar, F., & Shahidehpour, M. (2016). Front linesagainst the darkness:Enhancing the resilience of the electricity grid through microgrid facilities. IEEE ElectrificationMagazine,4(1),18-24.
[8] Gregor, S., & Hevner, A. R. (2013). Positioning and presentingdesignscienceresearchformaximumimpact.
[9] Guyon, I., & Elisseeff, A. (2003). An Introduction to VariableandFeatureSelection.
[10] Hevner, A. R., March, S. T., Park, J., & Ram, S. (2004). DesignScienceinInformationSystemsResearch.
[11] Hubert, M., & Van Der Veeken, S. (2008). Outlier detectionforskeweddata.
International Research Journal of Engineering and Technology (IRJET) e-ISSN:2395-0056
Volume: 11 Issue: 08 | Aug 2024 www.irjet.net p-ISSN:2395-0072
[12] International Organization for Standardization. (2014). ISO 55000: Asset management – Overview, principlesandterminology.
[13]Jacox,E.,&Samet,H.(2007).Spatial Joinqueriesand theirchallengeswithR-trees.
[14]Kotsiantis,S.B.(2007).SupervisedMachineLearning: AReviewofClassificationTechniques.
[15]Kwak,J.Y.,&Kim,J.H.(2017).Outlierdetectionusing animprovedz-score.
[16] Liu, Z., & Wang, H. (2020). A review of machine learning applications in power system stability assessment. IEEE Transactions on Power Systems, 35(1), 192-202.
[17]Manolopoulos,Y.,Nanopoulos,A.,Papadopoulos,A.,& Theodoridis, Y. (2023). R-tree: A hierarchical data structure used for efficiently indexing multidimensional geometricobjects.
[18] Mayo, M. (2017). Dimensionality reduction and featureselectiontechniques.
[19] McKinney, W. (2010). Data Structures for Statistical ComputinginPython.
[20] Murphy, K. P. (2012). Machine Learning: A ProbabilisticPerspective.
[21] Niu, Y., Xu, J., Zhao, M., Li, L., & Sun, H. (2019). Potential failures, that are present in the asset but didn't cause loss of functions, and don't manifest until some pointintime.
2024, IRJET | Impact Factor value: 8.226 | ISO 9001:2008