
International Research Journal of Engineering and Technology (IRJET) e-ISSN:2395-0056
Volume: 11 Issue: 08 | Aug 2024 www.irjet.net p-ISSN:2395-0072

International Research Journal of Engineering and Technology (IRJET) e-ISSN:2395-0056
Volume: 11 Issue: 08 | Aug 2024 www.irjet.net p-ISSN:2395-0072
Gde Agung Ramanda Pinangguh1, I Wayan Gede Sedana Yoga2, Lutfi Suhendra3
1,2,3DepartmentofAgroindustrialTechnology,Faculty ofAgriculturalTechnology, UdayanaUniversity,Indonesia
Abstract - Productivity is the value given to the production capability of a company. XYZ Company is one of the producers of Balinese robusta coffee powder that has been established for more than 50 years. Nowadays the company has problems meeting the increasing market demand. This study aims to measure and analyze the company's productivity using productivity indicators that are considered important by experts so that they can be used as a benchmark for improving productivity in the company's production department. The objective matrix (OMAX) method is used to measure productivity helped with analytical hierarchy process (AHP) as tools to weighting the productivity indicators and Fault Tree Analysis (FTA) method to analysis the roots of productivity problem. Based on analysis using Trafict Light System (TLS) method, the company's productivity index in 2023 was categorized as low with an average score of 3,105 that caused by the low performance of all five productivity indicators. These indicators are the main factors contributing to the low company productivity index, with a total potential increase in the productivity index of 222.08%. The problems that cause the company's low productivity value are roasting machine downtime and the number of days of leave taken by production staff. To significantly increase productivity, the company is recommended to replace the current machine with a modernone, provide training for production staff,andutilize informationtechnology(IT).
Key Words: fault tree analysis, objective matrix, productivity,robustacoffee
Productivity is a value used to measure the performance of individuals, organizations, and companies [1]. Therefore, productivity is a crucial factor in determining the sustainabilityof a companyinthe future. It involves the utilization of resources (inputs) as efficiently as possible to produce or increase outputs in the form of goods and services effectively [2], [3]A company'sproductivityneedstobemeasuredperiodically to determine whether the company's performance level has met the established targets or standards[4]. One method that can be used to measure productivity is the objective matrix (OMAX) method. The objective matrix methodisapartialproductivitymeasurementmethodthat
is easy to implement, easy to understand, and flexible so that it can be adapted to the company's conditions and needs[5],[6].TheOMAXmethodcanprovideanoverview of how effective the production process is and how efficienttheutilizationofresourcesisbythecompany[7]
XYZ Company is one of the producers of powdered robusta coffee in Bali Province that has been established for more than 50 years. The company has experienced difficulties where the increasing level of market demand hasbecomedifficultforthecompanytomeet.Accordingto [1], if a company experiences high profitability but is not balanced with high productivity, the company will not be abletomaintainthatlevelofprofitabilityinthelongterm becauselowproductivitycanerodethecompany'sprofits. To determine the factors that affect productivity, productivity measurement can be carried out using the Objective Matrix (OMAX) method. In the OMAX method, a method is needed to determine the weight of each productivity indicator. The Analytical Hierarchy Process (AHP) method is used in this weighting to prevent misinterpretation of the importance of each indicator. Indicators that show the accumulation of the worst performance figures are analyzed using the fault tree analysis(FTA)methodtofindtherootoftheproblem.
Measuring the productivity index at XYZ Company has several objectives. The objectives of this study are to determine the value of the productivity index of XYZ Company, to identify the factors that most influence the low performance value of the production department of XYZ Company, and to provide recommendations for improvements that XYZ Company must make to improve theproductivityofitsproductiondepartment.
Productivity is a value assigned to the production capacityofanindividual,organization,orcompany[1].[8] states that productivity is defined as the result obtained from each production process that uses one or more productionfactors.Productivityisusuallycalculated asan index or ratio of output to input and can be expressed in physical and financial measures. A similar opinion was
International Research Journal of Engineering and
Volume: 11 Issue: 08 | Aug 2024 www.irjet.net p-ISSN:2395-0072
also expressed by [9], productivity implies the concept of effectivenessandefficiency.Inthisregard,Anorganization issaidtobeproductiveifitachievesitsgoals,andachieves thembycarryingoutthetransformationprocessofinputs into outputs at the lowest cost. Based on the explanation, thegreatertheratiobetweentheoutputproducedandthe input or commonly called the production factor of a productionsystem,thehighertheproductivityvalueofthe company.
The Objective Matrix (OMAX) productivity measurement model was developed by Prof. James L. Riggs (Department of Industrial Engineering at Oregon State University). Objective Matrix (OMAX) is a partial productivity measurement system developed to monitor productivity in each part of a company with suitable productivityindicators[6],[10]
Table-1: Objective Matrix Productivity Measurement
The Objective Matrix (OMAX) categorizes the performance of each productivity indicator into 11 levels, rangingfromlevel0tolevel10.Thereferencelevelsare0, 3,8,and10.Thefollowingformulaisusedtocalculatethe valueofeachlevel:
- Level0(Thelowestachievement)
Thelevelisfilledwiththelowestachievementvalueof eachproductivityindicator.
- Level3(Theaverageachievement)
Thelevel isfilledwiththeaverageachievementvalue ofeachproductivityindicator.
- Level8(Company’stargetachievement)
The level is filled with the company's normal target achievement, which is 30% of the average indicator’s achievementvalueoftheproductivityindicator.Level 8canbecalculatedusingthefollowingformula:
Level8=(Averageachievementvalue×0,3)+average achievementvalue
- Level10(Maximumachievement)
Thelevelisfilledwiththecompany'smaximumtarget achievement, which is 30% of the highest indicator’s achievementvalueoftheproductivityindicator.Level 10canbecalculatedusingthefollowingformula:
Level 10 = (Highest achievement value × 0,3) + averageachievementvalue
- Level1-2,4-7,9
The level is filled using the interpolation formula between the reference level values above and below. These levels can be calculated using the following formula:
Level1-2 =((Level3-Level0))/(3-0)
Level4-7 =((Level8-Level3))/(8-3)
Level9 =((Level10-Level8))/(10-8)
According to [9],the OMAX model is simple and easy tounderstand,consistingofseveralparts,namely:
1. Productivity indicators: Show activities and factors thatsupportproductivityandareexpressedasratios.
2. Indicator performance: Performance value of each productivityindicators
3. Achievement level: The value of each indicator performance determined by considering the highest, average,andlowestproductivityvalues.
4. Indicator Achievement: These values are converted intovaluesatthecorrespondinglevel.
5. Weights: Each indicator has a different influence on thelevelofproductivitybeingmeasured,therefore,a percentageofimportancemustbeincluded.
6. Achievement value: The sum of the indicator level valuemultipliedbytheweightinacertainperiod.
7. Productivityindex:Thesumofindicatorachievement incorrespondingperiod.
The Analytical Hierarchy Process (AHP) is a decision support method developed by Dr. Thomas L. Saaty in 1970.AHPisamethodformeasuringfactorsarrangedina hierarchical structure for decision-making using a feedback assessment method [11] Productivityindicators selected by experts are then weighted by distributing questionnaires to experts to determine the priority value comparison between one productivity indicator and another. The results of the questionnaire are arranged in the form of a pairwise comparison matrix to calculate the eigenvalue and eigenvector. The eigenvalue of each pairwise comparison matrix from the assessment is calculatedbydividingeachcellineachmatrixbythetotal comparison value in the same column as that cell. The eigenvectoriscalculatedbysummingalleigenvaluevalues in the same row and then dividing the result by the total number of productivity indicators. For the weighting results to be used, consistency testing and iteration must be carried out first. Productivity weights are considered consistent if the Consistency Ratio (CR) is less than 10%.
International Research Journal of Engineering and Technology (IRJET) e-ISSN:2395-0056
Volume: 11 Issue: 08 | Aug 2024 www.irjet.net p-ISSN:2395-0072
TheConsistencyIndex(CI)andConsistencyRatio(CR)can becalculatedusingthefollowingformula:
- CI=((λmax–n))/(n-1)
Description:
λ max = The sum of the multiplication of each indicator'seigenvectorandthesumofcellvalueofthe correspondingindicator.
n=Thenumberofproductivityindicatorsused.
- CR =CI/RCI
Description:
RCI=RandomConsistencyIndex.
The productivity indicator is considered reliable, and we can proceed to the next step if the Consistency Ratio (CR) is less than 10% (0.1). If the CR exceeds 10%, we kindly request the respondent to reconsider their answers. The corresponding random consistency index (RCI) values for different matrix sizes are provided in Table2.
The TrafficLight System(TLS)isa methodthatsimplifies theassessmentofcompanyperformanceusingthreecolor categories: red, yellow, and green. These color categories are determined based on discussions with the company and are used to evaluate performance against set targets. The definitions for each color, as established by the company,areasfollows:
- Red: Scores/levels between 0 and 3, indicating performancebelowtargetandunsatisfactory.
- Yellow: Scores/levels between 4 and 7, indicating adequate performance but not reaching the maximumtarget.
- Green: Scores/levels between 8 and 10, indicating verygoodperformancethathasmetorexceededthe maximumtarget.
Faulttreeanalysis(FTA)isananalyticalmethodused toexploretheoccurrenceofundesiredeventswiththeaim of identifying the root cause. A root cause analysis using FTA method will be conducted if the company's productivity index is deemed suboptimal. [12] Building a faulttreeinvolvessixstagesasfollows:
1. Determiningtheundesiredevent.
2. Understandingthesystemoperation
3. Constructingthefaulttree
4. Collectingquantitativedata
5. Evaluatingtheprobabilityinthefaulttree
6. Analyzingthecalculationresults.
After passing the consistency test, all pairwise comparisonmatricesfromtheexperts'assessmentscanbe used to calculate the weights of the productivity indicators. All pairwise comparison matrices are combined by calculating the geometric mean. The geometric mean is the result of multiplying each corresponding priority comparison value from the experts,thentakingtherootoftheproducttothepowerof the number of matrices. The geometric mean can be calculatedusingthefollowingformula:
Geomean= √
The resulting geometric mean values will be used to createa newpairwisecomparisonmatrix,fromwhichthe eigenvalue and eigenvector will be calculated. The eigenvector can then be used as the weight of the productivity indicator after iterating until there is no difference between the obtained eigenvector and the eigenvectorfromthepreviousiteration.
Considering that a fault tree is a graphical representationoftherelationshipbetweenspecificevents and the top undesirable event, the creation of a fault tree willrequireseveralcommonsymbolsasdepictedinTable 3below

International Research Journal of Engineering and Technology (IRJET) e-ISSN:2395-0056
Volume: 11 Issue: 08 | Aug 2024 www.irjet.net p-ISSN:2395-0072
1
5
6
7
8
ThisresearchwasconductedatXYZCompany,located in Buleleng Regency, Bali Province. Data was collected by accessing the company's historical data and conducting interviews with three experts: the factory supervisor, the company'sgeneralmanager,andanacademicexpertinthe field of productivity. Productivity indicators were determined through brainstorming with the experts, and the performance ofthese productivityindicators was then calculated on a monthly basis based on the company's historical data for 2023. The performance values of each productivity indicator were processed and analyzed using the Objective Matrix (OMAX) method to determine the monthly performance of each productivity indicator and obtainthecompany'sproductivityindexvaluein2023.The OMAX method was integrated with the Analytical HierarchyProcess(AHP)method,whichwasusedasatool to weight each productivity indicator. The level of achievement of the productivity index will be evaluated using Traffic Light System (TLS) method to determine whether corrective actions are needed for the company's productionprocess,andthenananalysisoftherootcauses of the low performance values of each indicator was conductedusingFaultTreeAnalysis(FTA).Solutionstothe root causes of the company's low performance or productivity will be sought by conducting a literature review.
Productivity indicators employed in the Objective Matrix (OMAX) methodology are selected based on the availabilityofhistoricalinputandoutputdata.Aliterature review and expert brainstorming were conducted to determine the most suitable indicators. Table 4 presents the specific productivity indicators and their correspondingfunctionsusedinthisresearch.
Table 4. Productivity Indicators
The data used to calculate the monthly performance of each productivity indicator at XYZ Company is the historical output and input data for the robusta coffee powder production process from January to December 2023. Table 5 presents the data used for calculating the company'sproductivity
Table 5. Productions Input and Output Data in 2023
Method
Theweightingiscarriedoutbydistributingapairwise comparison questionnaire to several experts and then processed using the Analytical Hierarchy Process (AHP) method. Table 6 shows the calculation results from the expert’s judgement regarding the importance of each productivity indicator, in the form of eigenvalues and eigenvectors.
6.
After obtaining the eigenvalues and eigenvectors, calculations were performed to determine the CR value. The calculation results show that the CR value of the pairwise comparison matrix in Table 5 is 0.0150. This CR value,whichisbelow10%,indicatesthattheeigenvectoris consistent and can proceed to the iteration stage. The eigenvector value can be used when it shows consistent numbers after three iterations of eigenvector calculation. Table7showsthe results ofthe eigenvectorcalculationin the third iteration, which is used as the weight for each productivityindicator.
The monthly indicator performance of each indicator is calculated based on the company's historical data in
Volume: 11 Issue: 08 | Aug 2024 www.irjet.net
2023. Table 8 shows the performance values of each productivityindicator.
Table 8. Performance of Each Productivity Indicator in 2023.
Month
May
June
4.4. Calculation of the Value of Each Level and Productivity Index Using the Objective Matrix (OMAX) Method
The value of each level in the objective matrix is calculated based on the monthly performance values of productivity indicators. These values are considered to calculate the productivity index of XYZ Company. The indicator achievement of each indicator is obtained by consideringitsachievementlevel.Theproductivityindexis obtained by summing the achievement value of each indicator. The achievement value of an indicator is the result of multiplying the indicator achievement of each indicatorbyitsweight.BelowisTable9,whichshowsone of the monthly productivity index calculations using the ObjectiveMatrix(OMAX)method.
Table 9. Productivity Measurement in January 2023
Table 10. Achievement Value
Based on the analysis using the Traffic Light System (TLS), the average productivity index of the production department stands at 3,1048, indicating a productivity performance as it falls within levels 3 and 4. However, given its proximity to level 3, there is a need for improvements to optimize productivity. Consequently, a Fault Tree Analysis (FTA) should be conducted on all productivityindicatorstopinpointtherootcausesoftheir suboptimalperformance.
The low productivity index of the company in 2023 was identified as the top event (TE) and its root causes were sought from each productivity indicator, which served as intermediate events (IE). A brainstorming session with experts involved in previous stages was conducted to identify these causes. Two basic events (BE) were found to be the root problems: the number ofleaves taken by production staff (BE1) and the downtime of the roasting machine (BE2). The hierarchical relationships betweentheseeventswerestructuredintoanFTAdiagram and their probabilities were calculated. Table 11 presents the data on the number of leaves of production staff, working days of production staff, downtime hours, and roasting machine usage hours, which were used to calculate the probabilities of basic event 1 (BE1), basic event2(BE2),andthetopevent(T).
All productivity values of each period in 2023 were calculated using the Objective Matrix (OMAX) method and thencompiledintoatable.Table10isacompilationofthe achievement values of each indicator per month, which is used todetermine whetheran analysis tofind root causes oftheproblemisnecessary.
The data used to calculate the probability of (BE 1) wastheroastingmachinedowntimedataandthemachine
International Research Journal of Engineering and Technology (IRJET) e-ISSN:2395-0056
Volume: 11 Issue: 08 | Aug 2024 www.irjet.net
usage time. The following is the calculation of the probabilityvaluefor(BE1):
P(BE1) =270/5.200 =0,0519
Thedatausedtocalculatetheprobabilityof(BE2)was the number of leaves taken by production staff and the numberofworkingdaysofproductionstaff.Thefollowing isthecalculationoftheprobabilityvaluefor(BE2):
P(BE2) =275/2652 =0,1037
After obtaining the probability values for each basic event(BE),theprobabilityforeachintermediateevent(IE) was calculated. The value of IE is obtained by calculating the probability value of the related BE. An IE related to a single BE will have the same probability value as that BE, whereas an IE related to more than one input will be calculatedaccordingtothelogicgatecalculation.Since(IE 2) and (IE 5) are only related to (BE 1), the probability valueof(IE2)and(IE5)is0.0519.(IE1),(IE3),and(IE4) are related to both (BE 1) and (BE 2) using an OR logic. Therefore, their probability values are the sum of the probabilityvaluesof(BE1)and(BE2).Thefollowingisthe calculation of the probability values for (IE 1), (IE 3), and (IE4):
IE1=0,0519+0,1037
IE3=0,0519+0,1037
IE4=0,0519+0,1037
After obtaining all data, including the hierarchical arrangement of all events and their interrelationships, a Fault Tree Analysis (FTA) diagram can be constructed. Figure 5 presents the FTA diagram for the company’s low productivityindex.
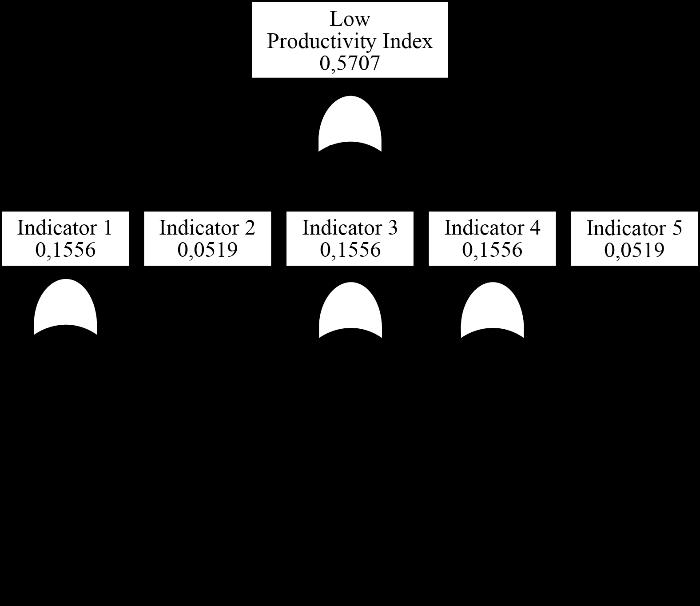
Based on the data in Figure 1, the fault tree analysis diagramresultingfrom brainstorming with experts,itcan
p-ISSN:2395-0072
be seen that all productivity problems identified from the fiveproductivityindicatorsexaminedoriginatedfromtwo basic events or primary factors: roasting machine downtime and the number of leaves taken by production staff.Thehighdowntimeisduetotherelativelyoldageof the roasting machine currently in use, resulting in many parts of the machine no longer functioning optimally or being damaged. Therefore, the machine requires frequent maintenance, causing downtime. Frequent downtime can causeproductionstafftobeunproductive,especiallythose working in the roasting section. The number of leaves taken by production staff is also a root problem because the staff working in the factory are burdened with productivity targets and take overtime due to reduced production capacity as a result of staff taking leave. High working hours cause employees to experience fatigue, which has a negative impact on the physiological and mental health of the workforce, leading to a decrease in productivity[13]
After identifying the root causes of the low productivity index, the next step is to find solutions to address these problems. Problem-solving is done by brainstorming and conducting a literature review to find solutions relevant to the company's conditions. The following are recommendations for improving the company'sproductionprocess:
1. The problem of downtime on the roasting machine can be overcome by replacing the current roasting machine with a modern one. This technological upgrade can reduce downtime due to machine maintenance and repairs. This can happen because spare parts and expert technicians for newer machines are easier to find than for the current machine.Accordingto[14],theutilizationofeffective technology can increase productivity. Modern machines with the latest technology are more efficient in terms of energy, raw materials, and labor in the production process because modern technology is already supported by automation systems, so it can produce products that meet the expectedqualityandquantity.
2. The problem of a large number of leaves taken by factory staff can be addressed by providing training and development for production staff. According to [15],providingtrainingtotheworkforcecanincrease company productivity due to an increase in the workforce's ability to carry out production activities and handle various problems faced in the field. The distribution of training must be done fairly to be effective in achieving the desired performance level. In addition, the company must also utilize information technology (IT) such as enterprise resource planning (ERP) and artificial intelligence (AI). The utilization of IT can significantly increase
International Research Journal of Engineering and Technology (IRJET) e-ISSN:2395-0056
company productivity as it can facilitate communication, decision analysis, and completing repetitiveandtime-consumingtasks[16].
Iftheproblemsofdowntimeontheroastingmachine and the large number of leaves taken by factory staff can be optimally resolved, the company's productivity index has the potential to increase by 222.08% in the following years.
Based on the measurement and analysis of productivityinthecompany'sproductionprocessusingthe Objective Matrix (OMAX) method, the following conclusionsandrecommendationscanbedrawn.
5.1. Conlusion
1. The productivity index values of the production department in company XYZ from January to December 2023 were as follows: 2,400, 1,313, 2,206, 2,618, 4,324, 1,973, 3,967, 3,458, 4,095, 3,763, 4,072, and3,067.Thehighestproductivityachievementwas in May, while the lowest was in June. The average productivityindexfor2023was3,105.
2. Factors affecting the low productivity of the production department were downtime of the roasting machine and the number of leaves taken by production staff. High downtime disrupted the company's production process as it could cause production staff to be unable to carry out production activities. Production staff taking leave could burden theworkingstaff,therebyincreasingovertimehours.
3. Recommended Improvements for the Company: To mitigate the recurring issue of roasting machine downtime,itisrecommendedthatthecompanyinvest in a modern, technologically advanced replacement for thecurrentaging machine. Thisstrategic upgrade is expected to enhance overall production efficiency and effectiveness, ensuring consistent output that adheres to quality and quantity standards. Additionally, to optimize labor productivity, particularly during periods of staff absence, the implementation of information technology solutions, such as Enterprise Resource Planning (ERP) and Artificial Intelligence (AI), is strongly suggested. Concurrently, a comprehensive training and development program for production staff should be established to elevate their capabilities and overall performance.
5.2. Suggestion
Based on the findings of this research, it is recommended that the company implement the recommended productivity improvements and
Volume: 11 Issue: 08 | Aug 2024 www.irjet.net p-ISSN:2395-0072 © 2024, IRJET | Impact Factor value: 8.226 | ISO 9001:2008
continue to conduct periodic productivity measurements and analyses. These results can then be used as a reference for future productivity planning.
[1] V. Gasperz, Manajemen Produktivitas Total Srategi Peningkatan Bisnis Global. Jakarta: PT Gramedia PustakaUtama,1998.
[2] N. I. Douw, M. S. Maarif, and L. M. Baga, “Peningkatan produktivitas kerja karyawan development di tambang bawah tanah DMLZ (Deep mill level zone) PT. Freeport Indonesia,” Jurnal Aplikasi Bisnis dan Manajemen, vol. 7, no. 2, pp.316–329,2021,doi:10.17358/jabm.7.2.316.
[3] T.Coelli,D.S.P.Rao,C.J.O’Donel,andG.E.Battese, An introduction to efficiency and productivity analysis, 2nd ed. New York: Springer New York, 2005.doi:https://doi.org/10.1007/b136381.
[4] P. Fithri and R. Yulinda Sari, “Analisis pengukuran produktivitas perusahaan alsintan CV. Cherry Sarana Agro,” Jurnal Optimasi Sistem Industri, vol. 14, no. 1, pp. 138–155, 2015, doi: https://doi.org/10.25077/josi.v14.n1.p138155.2015.
[5] Adianto, A. Saryatmo, and A. Gunawan, “Analisis pengukuran kinerja perusahaan dengan metode performance prism dan scoring objective matrix (OMAX)padaPT.BPAS,” SINERGI,vol.18,no.2,pp. 61–70, 2014, doi: https://dx.doi.org/10.22441/sinergi.
[6] D. Fajar and A. Nugroho, “Pengukuran produktivitas lantai produksi menggunakan metode objective matrix (OMAX) dan fault tree analisis (FTA),” Jurnal Ilmiah Teknik Mesin, Elektro dan Komputer,vol.3,no.2,pp.165–179,Jul.2023, doi:10.51903/juritek.v3i2.1674.
[7] N. Damariandini, B. A. Harsojuwono, and I. K. Satriawan,“Analisisproduktivitasproduksikeripik tempe ‘sagu’ UD. Arya Putra Surabaya dengan menggunakan metode objective matrix (OMAX),” Jurnal Rekayasa dan Manajemen Agroindustri ,vol. 11, no. 3, pp. 443–455, 2023, doi: https://doi.org/10.24843/JRMA.2023.v11.i03.p12.
[8] Eric Louis Kohler, Kohler’s Dictionary for Accountants.1983.
[9] W. Minto, Produktivitas untuk teknik industri. Sidoarjp:DianSamudra,2008.
International Research Journal of Engineering and Technology (IRJET) e-ISSN:2395-0056
Volume: 11 Issue: 08 | Aug 2024 www.irjet.net p-ISSN:2395-0072
[10] D. Avianda and Y. Yuniati, “Strategi peningkatan produktivitas di lantai produksi menggunakan metode objective matrix (OMAX),” Reka Integra, vol.1,no.4,pp.202–213,2014.
[11] T. L. Saaty, “The modern science of multicriteria decisionmakinganditspracticalapplications: The AHP/ANP approach,” Oper Res, vol. 61, no. 5, pp. 1101–1118, Sep. 2013, doi: 10.1287/opre.2013.1197.
[12] N. A. Wessiani and F. Yoshio, “Failure mode effect analysis and fault tree analysis as a combined methodology in risk management,” in IOP Conference Series: Materials Science and Engineering, Institute of Physics Publishing, Apr. 2018.doi:10.1088/1757-899X/337/1/012033.
[13] K. F. Kodrat, “Hubungan kelelahan dengan produktivitas tenaga kerja pabrik kelapa sawit PT. X Medan,” Jurnal Intelektualita: Keislaman, Sosial dan Sains, vol. 11, no. 2, pp. 181–186, Sep. 2022, doi:10.19109/intelektualita.v11i2.13689.
[14] S. R. Ningsih, “Pengaruh teknologi terhadap produktivitas tenaga kerja di Indonesia,” Benefit: Journal of Bussiness, Economics, and Finance,vol.2, no. 1, pp. 1–9, Feb. 2024, doi: 10.37985/benefit.v2i1.341.
[15] G. Gumilar, “Pengaruh pelatihan terhadap peningkatan produktivitas kerja karyawan pada PT. Raya Sugarindo Inti Tasikmalaya,” Jurnal Ilmiah Manajemen dan Bisnis,vol.19,no.1,pp.55–63,Apr.2018,doi:10.30596/jimb.v19i1.1804.
[16] A. G. Abri and M. Mahmoudzadeh, “Impact of information technology on productivity and efficiency in Iranian manufacturing industries,” Journal of Industrial Engineering International, vol. 11, no. 1, pp. 143–157, Mar. 2015, doi: 10.1007/s40092-014-0095-1.
AUTHORS BIOGRAPHY
First Author – Gde Agung Ramanda Pinangguh is a final year student of Agroindustrial Technology, Faculty of Agricultural Technology, Udayana University, Bali, Indonesia.
Second Author –IWayanGedeSedanaYoga,S.TP.,M.Agb. ia a lecturer of Department of Agroindustrial Technology, Faculty of Agricultural Technology, Udayana University, Bali,Indonesia.
Third Author – Dr.Ir.LutfiSuhendra,M.P.isalecturerof Department of Agroindustrial Technology, Faculty of Agricultural Technology, Udayana University, Bali, Indonesia.