
International Research Journal of Engineering and Technology (IRJET) e-ISSN: 2395-0056
Volume: 11 Issue: 08 | Aug 2024 www.irjet.net p-ISSN: 2395-0072

International Research Journal of Engineering and Technology (IRJET) e-ISSN: 2395-0056
Volume: 11 Issue: 08 | Aug 2024 www.irjet.net p-ISSN: 2395-0072
Krishna Kant Bhardwaj
Birla Institue of Tecnology and Science
Pilani Rajasthan, India
Abstract - An This Paper address two major problems that are faced in the software development projects. Basically, when defects are detected in testing phase, we have to perform Root causal analysis to find out the root cause whether it is injection or removal root cause and then accordingly we perform the preventive and the corrective actions. However, the causal analysis takes significant amount of effort and time of development team. So, using textual analysis we find out the root cause of various defects and accordingly categories defects and take preventive actions. Another problem is that in testing phase if in last phase we found that the defects are more than the expected count and due to which there is a chance of delay in milestone/release of the product so in order to address this issue. We will be using the dataset of defects of previous 5 years products and using ANN model will be trained to predict risky requirements based on various factors, like design complexity, code changes, side case or coverage area of changes, developer’s skill. For example, bigger code changes near the release may risk in quality. Also, one of the factors would be the relevant functionality module. Based on the predicted risky requirements, effort in testing could be increased and also development team will also take action in the relevant module. We will also try using ML algorithm Gradient Boost on same dataset and compare the performance with ANN
Key Words: ANN, ML, Gradient Boost, Softmax, SME, SMOTE
Requirement Engineering is the efficient and systematic approach for gathering user’s requirements to implement software solution. It is a process of describing, understandingandmaintainingrequirementsintheprocess ofengineeringdesign. Mostlyallthesoftwaresavessome basicfeaturesandtheyarebasicallytherequirementswhich needtobedevelopedbytheprojectteam.QCDdependson the requirements of a project directly or indirectly. In the developmentsomeoftherequirementsharestraightforward and easy for the development team to understand and implementhoweverinsomerequirementstheresomeissues orapsorcomplexitywhichmaketheserequirementsrisky forthesuccessoftheproject.Whenwesayriskythatmeans theeitherprojectKPIQuality/Costortimeisgoingbeyond target.
If these risks are not captured and mitigated timely, the projectmaysufferalot.Theserisksmustbeeliminatedand dilutedtocontrolthesoftwarecostandschedule.Becausein thetestingphasebeginning,wehavealreadyimplemented the requirements and the cane requests or any other possible factors causing risk is already known to developmentteamandsoitisbesttimeforforecastingrisks atthisstage.Thismayimprovisesoftwareproductivityand quality while reducing the probability of project disaster. Whenrisksareappropriatelymitigatedortheircontingency plan is available then, it helps to reduce the possibility of softwareprojectfailure.Therearemanysolutionsavailable toprovidethepredictionofsoftwareriskatdifferentphases inSDLC.however,asthereislotofvariationofdataandit depends on the project nature as well. So still there is a scope of improvement in the model implementation. Whereasourtimingsareapttopredictriskyrequirements.A Riskpredictionmodelincludesclassificationmethodsthat areprojectedtopredictrisksontheSoftwareSpecifications oftheproject.
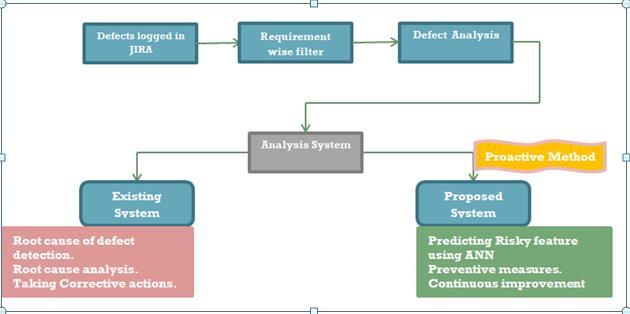
As we have been working for this client for more than 5 yearsandwehavedeliveredseveralprojectsforthesame base source code. We have the entire data of the requirementsalongwiththeirdefects. Wehavedatasetof around250differentrequirementsdevelopedtilldate.We havetakeninputsfromSMEsabouthowtoestimatedefects in a particular feature. There arefew factors identified by SMEsandbasedtheimpactofthesefactorsthedefectsare estimated.Ifa featureishavinghigherthan the estimated defects, then that requirement is considered risky requirementand accordingly the testing team takes some corrective action by proactively planning of testing that
International Research Journal of Engineering and Technology (IRJET) e-ISSN: 2395-0056
Volume: 11 Issue: 08 | Aug 2024 www.irjet.net p-ISSN: 2395-0072
feature.InthispaperweuseANNtoanalyzeRiskandpredict theresult.
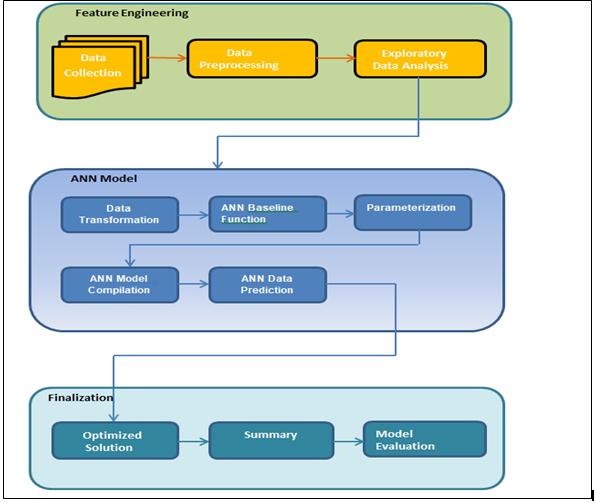
WearegoingtouseMultilayerPerceptronwhichisbasicof the neural networks (NN). Basically, it consists of are an inputlayerandminimumonehiddenlayerfollowedbyan outputlayer.WhenInputdataisgivenastheinputlayerin toaNN,theneuronsinthelayerbecomesactivelayerand thepassestheoutputtothenextlayeruntilanoutputvalue is produced at each of the output layers neurons. Before passingthedatatomodelthedatacollectionandcleaningis alsorequiredwhichispartoffeatureengineering.
We have taken defects data from JIRA for the last 7 years developed model and we analyze all those defects, during the fixing of defect development team put the feature/ requirement ID in the Jira’s so during the retrospection we were able to find out that which requirement results the exceeding defect counts from the definedgoalofKPI.Totaldefectcountswere~7000defects whichweremanuallyanalyzedbySMEs.Thedatasetnameis risky_requirementswhichishavingalmost10,000records. Thereistotal~250uniquerequirementswhicharerelated to these defects and based on these defect analysis the differentinfluencingfactorswereidentified

Table1:SampledataoffeaturingDataandTarget
At the very first stage in the risk prediction model, this is conducted using a checklist. SRS requirements having the influencing factors as identified by SMEs in last 7 years historicalbaseddata.Thereareseveralfactorshoweveronly some could be applicable in a project so accordingly the factorsaremarked.Thefactorswereidentifiedafteranalysis thedefectsinthepreviousyear’sprojects.
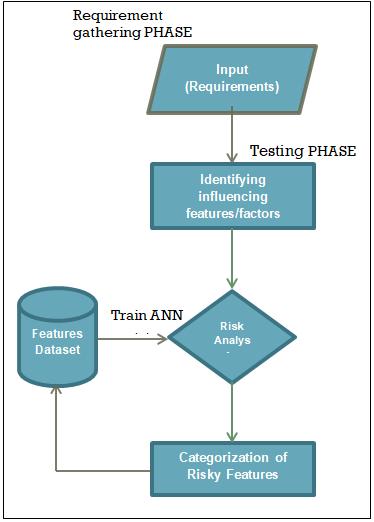
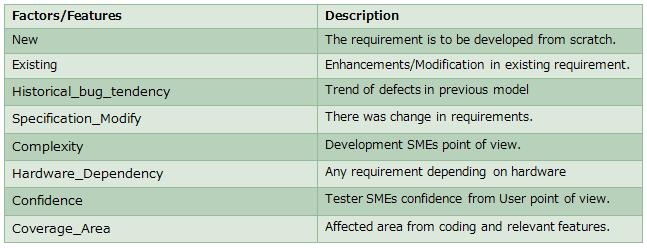
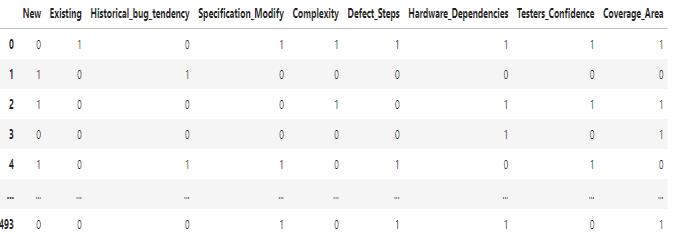
Table3:PreprocessedTrainingdata
International Research Journal of Engineering and Technology (IRJET) e-ISSN: 2395-0056
Volume: 11 Issue: 08 | Aug 2024 www.irjet.net p-ISSN: 2395-0072
Target label as 3 different Labels High_risky_feature, Medium_risky_feature, Low_risky_feature, so we need to converttheselabelsintonumericvaluessothatthemachine can understand it. We perform feature encoding as the followingtable.Featuresandrequirementsaresame.
3.4 One hot Encoding
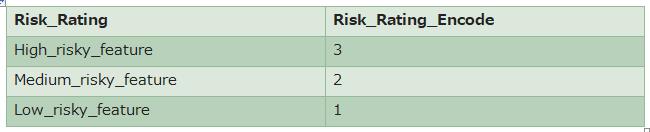
Table4:FeatureEncodingonTarget
IntheMulticlassclassification,itisrequiredtocreatetarget variableintomatrixoftheclasssize.Forexampleinourcase it would be [1,0,0],[0,1,0],[0,0,1] corresponding to each of thetargetvalue.
4. ANN IMPLEMENTATION
Inthisimplementationwehave9inputswith1hiddenlayer and1outputlayerwith3outputs. Wewillhave18neurons infirsthiddenlayerand3neuronsinsecondlayer.Thisisour basicfunctionwhichwewillbechanginginthefinetuningto improvetheaccuracy.Theactivationfunctionusedforthe firsthiddenlayeris ReLU;thereasonoftakingthe ReLU is thatincurrentneuralnetworks,theusageofrectifiedlinear unitor ReLU isrecommended.
Functiong(z)=max{0,z}
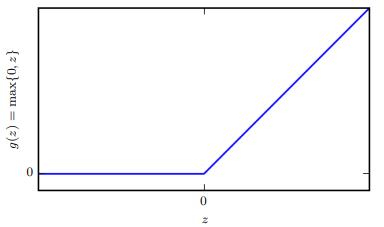
Figure4:ReLUactivationfunction
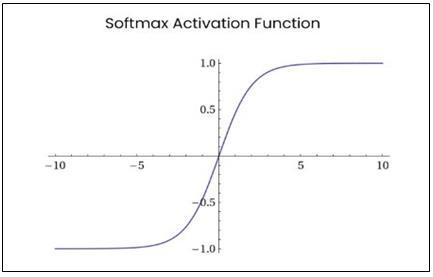
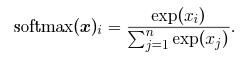
In the output layer will be having Softmax as activation functionthereasonofusing Softmax hereisaswehaveto predicttheprobabilityofanyofthreetargets.Asitisamulticlass classification so the output would be in terms of probabilitywhichisbetween[0,1]Softmaxforavectorxis calculatedaspertheformulabelow
exp(x)/Sum(exp(x)
The categorical cross entropy is used in multiclass classification.Iteasilydistinguishes between two different probabilitydistribution.
Two parameters were analyzed. Suppose we have probabilitiesp1,p2,p3,p4………pnofdifferentvariablesand variablesZ1,Z2,……….Znareunnormalizedprobability.We define Softmax function Qi as below with exponentiation, divisionandsummationoperations.
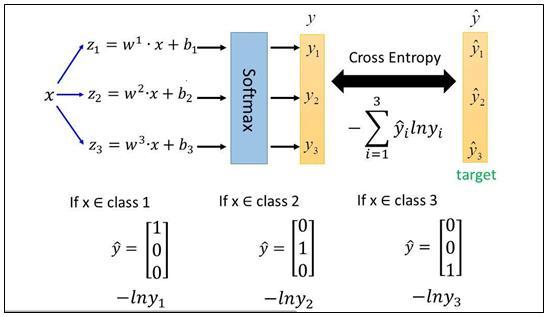
6:ANNModel
InasituationwhenallXiisequaltoaconstantC.Analytically alltheoutputshouldbeequalto1/n.
WeconstructacrossentropylossJ=-∑iPilogQi
Dataset
We have used another evaluation metric named K-fold cross validation which creates a process where every sample in the data is included in the dataset in the set at some test. K represents a number of folds, usually in rangesof3to10.Thedatawassplitinto K equalfoldsand
International Research Journal of Engineering and Technology (IRJET) e-ISSN: 2395-0056
Volume: 11 Issue: 08 | Aug 2024 www.irjet.net p-ISSN: 2395-0072
theirdeviationsforeachrunningwereanalyzed.Wefound thatdatasetwasnotimbalanced.Datadistribution
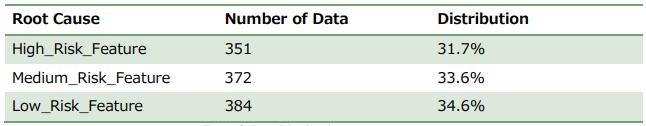
Table5:DataDistribution
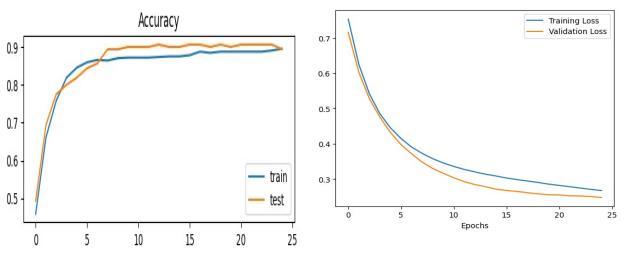
Wehaveruntreedifferentsetsfordifferentcombinationsof epochandthebatchsizesalsowithinputandoutputnumber ofneurons.Wehavecomparedtheaccuracyandprecisionof themodelfortheprobabilityoftheoutputofthefeatures.
Followingresultisbasedon 25 epochs and batch size 32 with 64 input neurons
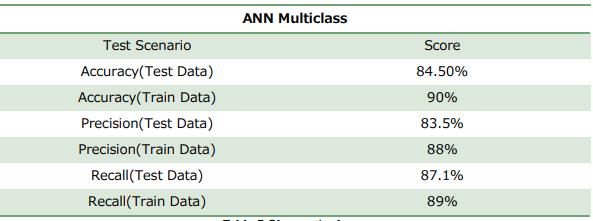
Table6:Observation(WithoutTuning)
4.2
Followingfinetuningapproacheswereadoptedtoimprove theaccuracyofANN
Number of hidden layers
Wecantakeevenasinglehiddenlayerwithmanyneurons thisalsocanhelpusinextractingpatterninthedataset.It’s always better to have multiple layers with neurons than singlelayerwithhigherneurons.Sincedeeplearningworks ontherepresentinglayermechanism,sofirstlayercaptures primitivefeaturesandthennextlayerlinksfactorsandthen next layer identifies pattern. This also uses transfer learning.Wecanaddhiddenlayeruntiloverfittingdoesnot occur.
Numberofneuronsislikeinpyramidshape,meansfromthe initial hidden layers to the output layer the neuron count decreases.Like 64->32->16 Asnumberofprimitivefeatures is more and then they make complex patterns which are lesserincountandfurtherreduced.However,itisnothaving anyimpactontheperformancesoeverylayercanhavesame numberofneuronsornodes,howeverthenumbersshould besufficient.Inthehiddenlayerweneedtohavesufficient numberofneurons/nodes.
a) Batch gradient decent All rows and then weights are updatedslowTraining
b) Stochastic gradient decent Afterone rowtheweights areupdated.VeryFast
c) Mini Batch gradient decent We decide the batch size, afterhowmanyrowstheweightswouldbeupdated.After how many rows traversal the weights would be updated. Maximum we can have been 8192, however the best is to havesmallerbatchsizelike8,24or32.
Sigmoidgivesvanishinggradientproblem.However,inour caseitisunavoidableaswehave multi-class classification problem.
Early stopping implementation, it automatically stops the modeltrainingorepoch’swhenitfindsthatthereisnomore improvement.Using Keras callback APIs.
Followingresultisbased on 200 epochs and batch size 8 with 64 input neurons
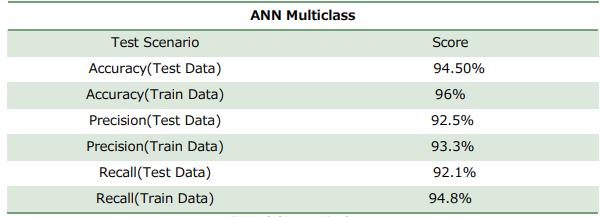
Table7:Observation(AfterTuningModel)
We have used ML based XG BOOST method on same dataset.
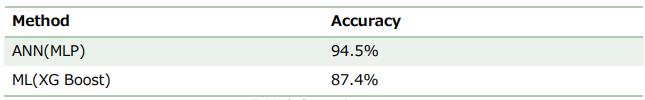
Table8:Observation(Comparison)
Volume: 11 Issue: 08 | Aug 2024 www.irjet.net p-ISSN: 2395-0072
The presented approach automatically predicts the risky feature for a project. There are few factors identified by SMEsandbasedonthepresenceofthesefactorsthedefects are estimated. If a feature is having higher than the estimated defects, then that features is considered risky feature and accordingly the testing team takes some corrective action by proactively planning of testing that feature.InthispaperwetrainANNModelbasedonthisdata andanalyzesRiskandpredictstheresult.Thisinformation can be used by the development team to choose a proper preventive action. It can also be used by testing team to create a test suite or design for that specific feature. In addition, this approach could be utilized for building benchmarks of specific bug types. The dataset size was almost 1000 records with 3 outputs, in particular, High_risky_feature, Medium_risky_feature, and Low_risky_feature. 64 hidden nodes and batch size of 32 with 25 epochs for the initial condition was used in this method.Whenevaluatedusingthecategoricalcrossentropy andk-foldcrossvalidation,thismethodhasanaccuracyof 90%andif200epochswasused,theaccuracyincreasedto approximately95%.XGBoostwasusedtocomparewiththe current method it has an accuracy of 87%. The ANN Multiclassoutperformsthismethodandhasanoutstanding precision score of 94%. It can be concluded that the ANN method is more stable in terms of how the network is supposedtorespondtoaparticularinput.Howeverfurther exploration could be done with respect to XG BOOST accuracyascompareoMLP.
Threats to validation
Duringthemanualclassification,wehavenoticedrecurring faultpatterns.Manuallycategorizingtherootcausemightbe error-proneandthetruerootcauseofthebugcanonlybe determinedbytheoriginalprogrammer.Weindicatedthe confidencelevelforeachbugwecategorizedandexcluded bugswithalowconfidencelevel.
[1] Assim,Marwa, Qasem Obeidat,andMustafaHammad. "Software defects prediction using machine learning algorithms."In2020Internationalconferenceondata analytics for business and industry: way towards a sustainableeconomy(ICDABI),pp.1-6.IEEE,2020.
[2] Shah, Mitt, and Nandit Pujara. "A review on software defects prediction methods." arXiv preprint arXiv:2011.00998(2020).
[3] Hirsch,Thomas,andBirgitHofer."Rootcauseprediction based on bug reports." In 2020 IEEE International Symposium on Software Reliability Engineering Workshops(ISSREW),pp.171-176.IEEE,2020.
[4] Bhanage,DeepaliArun,AmbikaVishalPawar,andKetan Kotecha."Itinfrastructureanomalydetectionandfailure handling: A systematic literature review focusing on datasets, log preprocessing, machine & deep learning approachesandautomatedtool."IEEEAccess9(2021): 156392-156421.
[5] Tan, Lin, Chen Liu, Zhenmin Li, Xuanhui Wang, Yuanyuan Zhou, and Chengxiang Zhai. "Bug characteristics in open-source software." Empirical softwareengineering19(2014):1665-1705.
[6] Herzig,Kim,SaschaJust,andAndreasZeller."It'snota bug, it's a feature: how misclassification impacts bug prediction." In 2013 35th international conference on softwareengineering(ICSE),pp.392-401.IEEE,2013.
[7] Mahmud,MahmudulHoque,MdTanzirulHaqueNayan, Dewan Md Nur Anjum Ashir, and Md Alamgir Kabir. "Softwareriskprediction:systematicliteraturereview onmachinelearningtechniques."AppliedSciences12, no.22(2022):11694.
[8] Elzamly,Abdelrafe,andBurairahHussin."Classification and identification of risk management techniques for mitigating risks with factor analysis technique in software risk management." Review of Computer EngineeringResearch2,no.1(2015):22-38.
[9] Gouthaman, P., and Suresh Sankaranarayanan. "PredictionofRiskPercentageinSoftwareProjectsby Training Machine Learning Classifiers." Computers & ElectricalEngineering94(2021):107362.