
International Research Journal of Engineering and Technology (IRJET) e-ISSN:2395-0056
Volume: 11 Issue: 08 | Aug 2024 www.irjet.net
p-ISSN:2395-0072

International Research Journal of Engineering and Technology (IRJET) e-ISSN:2395-0056
Volume: 11 Issue: 08 | Aug 2024 www.irjet.net
p-ISSN:2395-0072
Swetha, A. N1., M. S. Ayyanagowdar2, B. S. Polisgowdar3, Prasad, S. Kulkarni4, B. K. Desai5 and Ravi, M. V6 .
1 Ph D scholar, Department of Soil and Water Engineering, CAE, UAS, Raichur,
2 Dean (Ag Engg), CAE, UAS, Raichur.
3 Rtd. Professor, Department of Irrigation and Drainage Engineering, CAE, UAS, Raichur.
4 Assistant Professors, Department of Irrigation and Drainage Engineering, CAE, UAS, Raichur.
5 Directorate of Research, UAS, Raichur.
6 Professor of Soil Science and Extension Leader, Agriculture Extension Education Center (AEEC), Koppal, UAS, Raichur, ***
Abstract
An attempt has been made to analyze soils physically by determining the soil texture, bulk density, infiltration rate, hydraulic conductivity and chemically by determining the soil pH, EC and the soil micro and macronutrients using standard laboratory procedure for the selected three distributaries (D-17, D-65 and D-95) of TLBC command area, Raichur,Karnataka.Theresultsreveledthat,thesoilsoftheselecteddistributariesofthecommandareawereclassifiedas clayeysoilswithmorethan35percentofclayfractioninthesoil.Themeansoilbulkdensityof1.52,1.68and2.1gcc-1,the averagebasicinfiltrationrateof2.30,3.53and2.10cmhr-1,theaveragehydraulicconductivityof0.185,0.203and0.136 mday-1 wasobservedinhead(D-17),middle(D-65)andtail(D-95)reachesoftheTLBCcommandarearespectively.The soilpHvariedfrom8.21to8.53,8.11to8.18and7.46to8.23,theelectricalconductivityrangedfrom0.911to1.13dSm-1 , 0.85 to 1.28 dS m-1 and 0.76 to 0.9 dS m-1 respectively fordistributary D-17, D-65 and D-95. The average organic carbon contentintheselecteddistributariesofTLBCcommandarea viz., D-17,D-65andD-95wereestimatedas0.58,0.6and0.61 per cent respectively. The available macro and micro nutrient status of the soils in the selected distributaries were analyzed According to the soil test rating of primary, secondary and cationic micronutrients, the Available Nitrogen was mediumintheD-17andlowintheD-65andD-95),theAvailablePhosphorousandAvailablePotassiumwereinmedium range. The soils of all the selected distributaries were found to be low in Available Sulphur content, and high in exchangeableMagnesium,Copper,IronandZinccontent.
Keywords: Soil physical and chemical properties, micro and macro nutrients, distributaries, TLBC command area.
Land and water are finite natural resources, which are diminishing due to indiscriminate and unscrupulous exploitation.Duetoincreasingpopulationpressure,situationbecomesmoreseriousandcallsforefficientandproductive utilizationofresources.Increasingpopulationleadstooverexploitationofproductivelandswhichcreatesseriousproblem ofloweringthefertilitystatusofsoilanditleadstodeteriorationofsoil.Thedeficiencyofnutrientsdirectlyaffects onthe growth of crops and crop response become poor. Hence it is necessary to assess the fertility status of soil with the consideration of available micro and macro nutrients in soils and to recommend the specific nutrients for the proper managementofsoil.Informationonsoilfertilitystatusincropfieldisveryimportantandusefulforfertilizerrequirement and also to the specific management of the crop and soil (Bai et al., 2017). Soil salinity and water logging are the twin problems of Tungabhadra Project (TBP) command due to unscientific land and water management and violation of cropping pattern over the decades. As reported by Rashid et al., (2004) even though micronutrients are required in relatively smaller quantities for plant growth, they are as important as macronutrient in rice production to obtain optimumyieldandbalancednutrition.Mostmicronutrientsareusuallypoorlyavailableinsaltaffectedsoils,afactwhich isgenerallyattributedtothehighsoil pHand saltstress.Generally,thesolubilityofcationictrace elementsdecreasesas pH increases, while the solubility of the anionic trace elements increases as the pH increases. Therefore, micronutrients such as copper (Cu), iron (Fe), manganese (Mn) and zinc (Zn) exhibit low levels of solubility in sodic soils, which may result in micronutrient deficiencies. It is reported that presence of major nutrients affects crop uptake of micronutrient dueto either negative orpositiveinteractions(Shridhar et al., 2019).Informationonthecharacterizationof saltaffected
International Research Journal of Engineering and Technology (IRJET) e-ISSN:2395-0056
Volume: 11 Issue: 08 | Aug 2024 www.irjet.net p-ISSN:2395-0072
soils through ground truth in the command area at distributary scale is meagre or lacking and particularly no such information on micronutrient status is available for soils of three selected distributaries D-17, D-65 and D-95 of TLBC commandarea.Hence,inviewoftheabovethepresentstudywasundertaken.
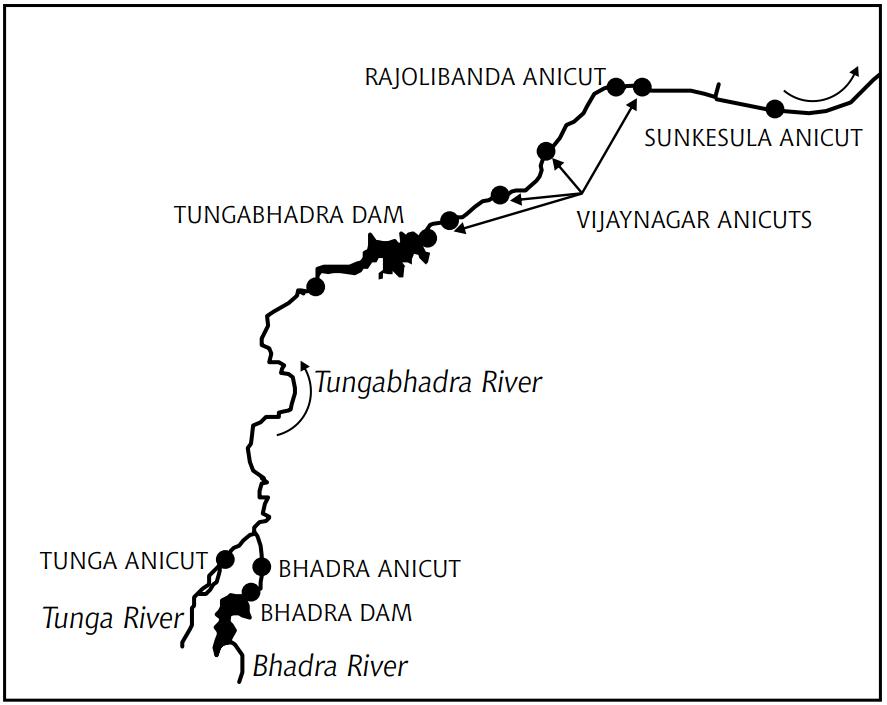
TheriverTungabhadraisasacredriverinsouthernIndiawhichflowsthroughthestateofKarnatakaandAndhra Pradesh.TheriverTungabhadraderivesitsnamefromtheTunga,andtheBhadra,formedbytheconfluenceoftworivers, theTungaandtheBhadra,whichflowdowntheeasternslopeoftheWesternGhatsinthestateofKarnatakaatanaltitude of about 1,196 m. Major tributaries are the Bhadra, Haridra, Vedavati, Tunga, Varda and Kumdavathi (Brochure 2019, River Basin Profile Tungabhadra Sub-Basin Karnataka).Tungabhadra irrigation project is an inter-state multipurpose projectwhichisconstructedacrosstheTungabhadraRiveratMallapurvillageabout5kmsfromHospettown,Vijayanagar district,Karnataka (Fig. 1).TheTungabhadra projectwasbuilt toprovide waterto thearea of5.23lakhhectares.Inthat 3.63lakhhectaresisgiventoKarnatakastateand1.6lakhhectaresisforAndhraPradesh.
ThepresentresearchstudywasfocusonTungabhadraLeftBankCanal(TLBC)commandareawhichliesfrom15° 15.50'46"N,76°19'43"Eand16°10.27'26"N, 77°19'50"Eatanelevationof402-516mabovethemeansea level. The irrigation water is supplied from the Tungabhadra dam through 227 km long main canal to 106 distributaries havingthetotalcommandareaof244,000ha.
The selection of the sample (distributary) was based on stratified sampling, the strata being distributary, outlet, villageandfarmhouseholds’sizeofthedistributaryintermsofdesigneddischarge ofwater,area irrigated,cropsgrown andextent of area affected by waterlogging,salinity andalkalinityandthe presenceofa WUA were themaincriteria for selectiontheoutlet.Basedonthesecriteria,threeoutletsunderthedistributarynumber17,65,and95fromTungabhadra LeftBankCanal(TLBC)attheupper,middleandlowerreachesofthemaincanalwereselected.
The three distributaries namely, D-17 (distributary-17) near Gangawathi, D-65 (distributary-65) near Halapur and D-95 (distributary-95) near Atnur village of TLBC command area were selected for the detailed study of water productivity and are presented in Fig. 2 and the geographical locations arial extent of selected distributaries of TLBC commandareaarepresentedinTable1
International Research Journal of Engineering and Technology (IRJET) e-ISSN:2395-0056
Volume: 11 Issue: 08 | Aug 2024 www.irjet.net p-ISSN:2395-0072
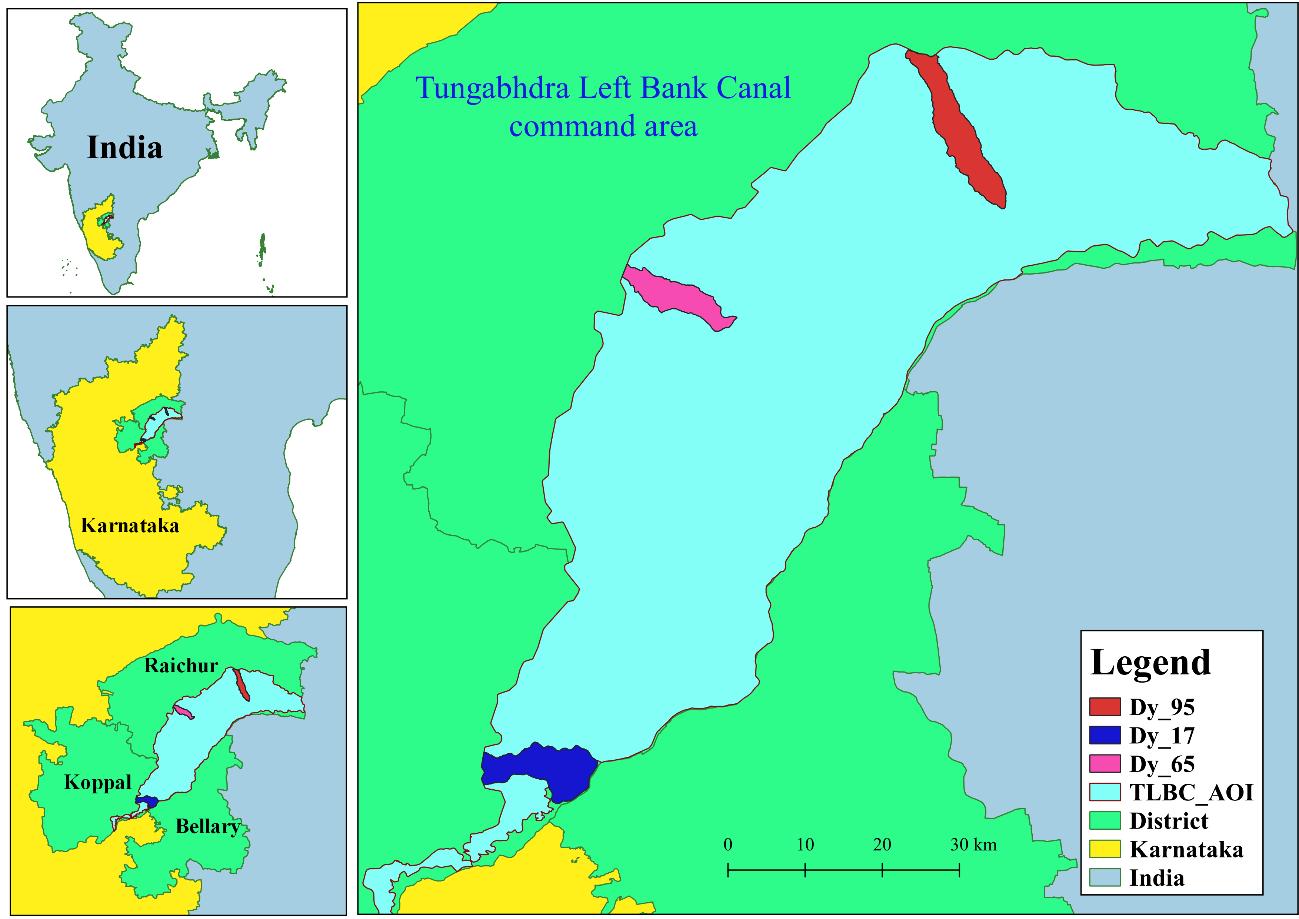
Fig. 2. Location map of selected distributaries of TLBC command area
Table 1. Details of geographical location of selected distributaries of TLBC command area
*ActualdischargedataprovidedbytheTungabhadraboard,Annualreport,2020-21.
The climate of the command area is characterized by oppressive hot weather in the summer season extending fromthemiddleofFebruarytomiddleofJune.Theaverageannualrainfalloftheareais650-700mm.However,theactual rainfallisconsiderablylesserthanthis.Thenumberofrainydaysisverylesswithhardly 29daysonanaverage. TheperiodfromJulytoSeptemberishavingsurpluswaterwhileremainingmonthoftheyearareunderwaterdeficit.The major part of the command area is dominated by black cotton soils. The other soils include like reddish sandy soil, light grey loamy soil and the reddish-brown soil. In Irrigated areas, paddy is grown in the entire command area, where as in Rabi theheadandmiddlereachfarmersgoforthepaddy(secondcrop)andintailreachesofthefarmersgrowthecotton, maizeandothercrops.Therainfedcropsduring Rabi includescereals,pulsesandoilseeds.
International Research Journal of Engineering and Technology (IRJET) e-ISSN:2395-0056
Volume: 11 Issue: 08 | Aug 2024 www.irjet.net p-ISSN:2395-0072
The characterization of soil and water was done to know the different soil properties which are responsible for the plant growth and development and water characteristics to increase the crop yield, crop productivity and water productivity. The characterization of soil and water includes the analysis of soil physically and chemically by using standardprocedure.ThesoilsamplingwascarriedoutinthestudyareabasedonGlobalPositioningSystem(GPS)reading. Atotalofninesoilsamplesateachsideofthedistributarywerecollectedatdifferentdepthof30,60,90and120cm.The soil samples were air dried in the shade, ground in wooden pestle and mortar and passed through 2 mm sieve. The soil sampleswereanalyzedphysicallyandchemicallybyusingfollowingthestandardmethods.
The samples are analyzed for physical such as soil texture, bulk density, hydraulic conductivity, infiltration rate, andchemicalpropertiessuchassoilpH,electricalconductivity(EC),organiccarbon(OC),mineralnitrogen(N),Available Phosphorous and Potassium. Micronutrient analysis for the other micro and beneficial elements are analyzed in the pesticideresidueandfoodqualityanalysislaboratory.
A. Soil texture
Textural classification of soil was carried out by the international pipette method using sodium hexametaphosphate as a dispersing agent described by Piper (1966). The results were reported as clay, silt and sand on moisturefreebasisandtexturalclasswasdeterminedbyUSDAtexturalclassification.
B. Bulk density
Bulkdensity(BD)isasimplemeasureofsoilstructure,withmeasurementsmadeoverthecourseofmanyroutine soilsurveystodeterminesoilcompactionandporosity.BDisdefinedastheratioofthemassofanoven-driedsoilsample to its bulk volume. Bulk density is classically evaluated with the core method, which consists of sampling the soil by pressingordrivingasteelcylindertoadesireddepth,thencarefullyremovingthecylindertoobtainanexactvolumetric sample.0
C. Infiltration rate and hydraulic conductivity
The infiltration rates are measured at selected locations of each distributary by using double ring infiltrometer. Infiltrometer and inverse auger hole methods based on similar hypothesis and are employed for measuring in-situ saturatedhydraulicconductivityofsoil.Infiltrometermethodissuitableformeasurementofvertical saturatedhydraulic conductivity of surface soil while inverse auger hole method is suitable for determination of horizontal saturated conductivityofsubsoil.
Hydraulic conductivity is measured by digging the hole into the soil to a certain depth below the water table. When equilibrium is reached with the surrounding groundwater, a part of the water in the hole is removed. The water seeps into the hole again, and the rate at which the water fall in the hole is measured and then converted by a suitable formulatothehydraulicconductivity(K)forthesoil.
where,
K=Hydraulicconductivity,mday-1
t=Timesincethestartingofmeasurements,s
ht =Heightofwatercolumnintheholeattime‘t’,cm
ho =Heightofwatercolumnattime‘to’,cm
r=Radiusofthehole,cm
International Research Journal of Engineering and Technology (IRJET) e-ISSN:2395-0056
Volume: 11 Issue: 08 | Aug 2024 www.irjet.net p-ISSN:2395-0072
Soil organic carbon was determined by Walkley and Black’s wet oxidation method using potassium dichromate andsulphuricacid.(Jackson,1973).
The soil samples are collected in selected distributaries areas based on the Global Positioning System (GPS) readings.Thesoilsamplesareairdriedintheshade,groundinwoodenpestleandmortarandpassedthrough2mmsieve. The soil samples are analyzed for electrical conductivity (EC), soil reaction (pH), N, P and K by following the standard methods.
The pH meter was calibrated using pH 7 buffer solution. The pH of buffer solutions of 4.0 and 9.2 was adjusted. Then20gofsoilwasweighedandtransferredinto100mlbeaker. 50mldistilledwaterwasaddedandstirredwellwith aglassrod.Thisisallowedtostandforhalfanhourwithintermittentstirring.Tothesoilwatersuspensioninthebeaker, theelectrodewasimmersed andpHvaluewasdeterminedfromtheautomaticdisplayofthepHmeter.Thesoilsamples wereanalyzedforpHin1:2.5soilwatersuspensionusingdigitalpHmeterandthereadingswerenoted.
The soil samples collected at different distributaries during the study period were analyzed for soil salinity by weighingthe20gair-dried,groundedsoilsamples.Thenaddingthedistilledwatertoeach20gsoilsampleintheratioof 1:2.5 soil to water. The soil water mixture was shaken vigorously for five minutes and was left to stand for 24 h in containers.TheECoftheextractwasmeasuredusingtheECmeterandthereadingswerenoted.
C. Available Nitrogen
The Available Nitrogen was determined by alkaline potassium permanganate method (Hesse, 1971). A known weight of soil was treated with excess of 0.32 per cent potassium permanganate with 25 per cent NaOH solution. The liberatedammoniawastrappedinboricacidmixedindicatorsolutionanddeterminedbytitrationagainststandardH2SO4 TheAvailableNitrogencontentofthesoilwascalculatedusingequation.
N(kgha-1)= (2)
D. Available Phosphorous
Available phosphorus in soil was extracted by Olsen’s extractant and phosphorus is determined by stannous chloridemolybdophosphoricbluecolourmethod(Hesse,1971).AvailablePhosphorusinsoilwasextractedbyusing0.5M NaHCO3.The bluecolour wasdeveloped by chloromolybdicacidandintensity of bluecolour wasdeterminedat660 nm. TheAvailablePhosphoruscontentofthesoilwascalculatedusingequation.
P(kgha-1) (3)
E. Available Potassium
Available potassium was extracted with neutral normal ammonium acetate solution and was determined using flame photometer as described by Jackson (1973). The Available Potassium content of the soil was calculated using equation.
K(kgha-1)= (4)
2.3 Micronutrient and pesticide residue analysis
TheAvailablemicronutrientspresentinsoilswasestimatedbythemethoddevelopedbyLindsayandNovellusing DTPA (Diethyl Triamine Penta Acetic Acid) which was found useful for separating soils into deficient and non-deficient categoriesformicronutrientsbyusingatomicabsorptionspectrophotometer(Nigam et al., 2014).Thestepbyprocedure involvedintheestimationofsoilnutrientsinsoil Theresultsobtainedfromtheanalysisarecomparedwithinternational agriculturalstandards(Table2)andpermissiblelimitsforsoilmicroandmacronutrientsanddiscussed.
International Research Journal of
Volume: 11 Issue: 08 | Aug 2024 www.irjet.net
Thesoilsamplesfromthethree(D-17,D-65andD-95)selecteddistributariesofthestudyareawereanalysedfor different soil physical properties such as soil texture, bulk density, hydraulic conductivity, infiltration rate chemical properties viz., soil reaction, soil salinity, micro and macro nutrients of the soil were determined based on standard procedures.TheTable3showsthePercentageofsand,siltandclayandtheresultsofPhysico-chemicalpropertiesofthe soilsintheselecteddistributariesofthestudyareaispresentedinTable4.
Source:Alloway(1990)17NGVS:No.guidelinevalueset
A. Soil textural classification
The average percentage of sand, silt and clay in the D-17 was 36.9, 19.6 and 43.5 0-30 cm depth, 32.6, 20.5 and 46.9at30–60cmdepth,30.4,17.2and 52.4percentat60-90cmdepthand31.7,19.8and48.5percentat90120cmdepthrespectively.
Theaveragepercentageofsand,siltandclayintheD-65was35.5,17.6and 46.6percentat0-30cm depth,33.6,18.2and48.2percentat30–60cmdepth,34.3,14.5and51.2percentat60-90cmdepthand35.5,15.6and 48.9percentat 90-120cmdepthrespectively.Theaveragepercentageofsand,siltandclayinthedistributary D-95was35.5,16.1and48.4percentat0-30cmdepth,34.3,15.9and49.8percentat30-60cmdepth,33.1,15.2and51.7 percentat60-90cmdepthand34.4,16.7and48.5percentat90to120cmdepthrespectively.
International Research Journal of Engineering and Technology (IRJET) e-ISSN:2395-0056
Volume: 11 Issue: 08 | Aug 2024 www.irjet.net p-ISSN:2395-0072
Table 3. Percentage of sand, silt and clay in selected distributaries of study area
As per the textural triangle diagram according to ISSS system of classification of soil particles, the soil contains morethan35percentofclayfractionthesoilscanbeclassifiedasclayeysoils,Phogat et al., (2016).Theresultsshowthat, thesoilsofthestudyareaareclassifiedasclayeysoiloffinetexturedsoil.SimilarresultswerereportedbyRajkumar et al., (2019)at0-30,30-60and60-90cmdepthinthesoilsofD-17ofTungabhadracanalcommandarea.
B. Bulk density
It is an indirect measure of pore space within a soil. The higher the bulk density, more compact is the soil and smalleristheporespace.ThebulkdensityoftheselecteddistributariesD-17,D-65andD-95was1.27to1.74gcc-1,1.26 to1.76gcc-1 and1.28to1.71gcc-1respectively.SimilarresultswerereportedRajkumar et al., (2018and2019)overTBP commandarea.
C. Infiltration rate and hydraulic conductivity
The infiltration rate of the soils of the selected distributaries varied from 0.32 to 4.29 cm hr-1 for the distributary D-17, while it varied from 2.02 to 5.04 cm hr-1 for D-65 and 0.29 to 3.92 cm hr-1 for D-95 respectively. Accordingtotheguidelinesforbasicinfiltrationrateforvarioussoiltypes,thesoilsofthestudyareacouldbeclassifiedas veryslowtoslowinfiltrationratesoil,SrinivasanandPoongothai(2013).Rajkumar et al., (2018)alsoreportedthesimilar resultsforinfiltrationrateinthesoilsofTBPcommandarea.
Table 4. Physico-chemical properties of the selected distributaries of the study area
International Research Journal of Engineering and Technology (IRJET) e-ISSN:2395-0056
Volume: 11 Issue: 08 | Aug 2024 www.irjet.net p-ISSN:2395-0072
The hydraulic conductivity is a measure of the water transmitting capacity of soils. The Hydraulic conductivity rangedfrom0.112to0.259mday-1 inthesoilsof D-17,0.121to0.286mday-1 inthesoilsofD-65and0.042to 0.231 m day-1 in the soils of D-95 respectively. Similar results were reported by Manjunatha et al., (2004) for the TBP commandarea.
D. Soil reaction
The reaction of a soil refers to its acidity or alkalinity. It is an important indicator of soil health. It can be easily measured and is usually expressed by the pH value. The average soil pH of the selected distributaries of the TLBC command varied from 8.21 to 8.53 for D-17, 8.11 to 8.18 for D-65 and 7.63 to 8.23 for D-95 indicating that the soils are slightlytomoderatelyalkaline.Yeledalli et al., (2008)and Rajkumar et al., (2019)reportedthesimilaraverage pH value 8.2 for Tungabhadra canal command area. The variation in soil pH was related to the parent material, and topography. Relatively higher pH value in black soils was due to the accumulation of the high amounts of exchangeable basesinsodiumastheyarepoorlydrained(DasogandPatil,2011).
E. Electrical conductivity (ECe)
Theelectricalconductivityvaluesforthestudyareavaried from0.911to1.13inthesoilsofD-17,0.85to1.28in thesoilsofD-65and0.76to0.9dSm-1 inthesoilsof D-17. Theelectricalconductivityrangedfrom0.76to1.28dSm-1 withmeanvalueof1.02dSm-1.Allofthesoilsamplesareunder1dSm-1.Itindicatesthatthesoilsaresalineinnatureas suggested by Muhr et al., (1963). The prolonged waterlogging condition, high application of fertilizers and pesticides, takingupofsamecropcontinuouslywithoutanymixedcroppingmethodsandhigherevaporationleadstoaccumulation ofsaltonthesurfaceofthesoilinfluencestheincreaseinelectricalconductivityinthestudyarea.
F. Organic carbon:
Soil organic carbon is a measurable component of soil organic matter. Organic matter makes up just 2 to 10 per centofmostsoilsmassandhasanimportantroleinthephysical,chemicalandbiologicalfunctionofagriculturalsoils.Soil organiccarbontendstobeconcentratedinthetopsoil.Topsoilrangedfrom0.5percentto3.0percentorganiccarbonfor most upland soils. The average organic carbon content in the selected distributaries of TLBC viz., D-17, D-65 and D-95 were0.58percent,0.6percentand0.61percentrespectively.SimilarOCof0.5to0.6percentwereobtainedbyYeladalli et al., (2008),Rajkumar et al., (2018)overTBPcommandarea.Manjunath et al., (2004)alsoreportedthepresenceof0.5 percentorganiccarboncontentoverTBPintheLBMCcommandonD-36/1distributarycanal.
3.2 Available Macro and micro nutrient status in the study area
Macronutrients(N,PandK)andMicronutrients(Fe,Mn,Zn,andCu)areimportantsoilelementsthatcontrolssoil fertility.Topsoilconfinehumus,animportantfoodresourceforplants,whichincreasebiologicalactivity,soil fertilityand controltheairandwatercontentofsoil.Table5showsthenutrientcontentinthesoilsoftheselecteddistributariesofthe TLBCcommandarea.
Table 5 Nutrient status in the selected distributaries of the study
International Research Journal of Engineering and Technology (IRJET) e-ISSN:2395-0056
Volume: 11 Issue: 08 | Aug 2024 www.irjet.net p-ISSN:2395-0072
Nitrogen is an important factor to increase the soil fertility. The Available Nitrogen content in the soil of the selecteddistributariesofthecommandareawas 288.51,270.95and270.32kgha-1 forD-17,D-65andD-95respectively. Accordingtothesoiltestratingofprimary,secondaryandcationicmicronutrients,theNitrogenavailableforplantgrowth intheD-17wasmediumandlowintheD-65andD-95.ThedeficiencyofNitrogenshowsuniformyellowingofolderleaves includingveins,leavesthatwilleventuallyturnbrownanddie.ThelowNitrogencontentwasreportedbyYeledhalli et al., (2008)over TBPcanal commandarea.Prasad et al., (2020),SrinivasanandPoongothai(2013),andBinitha et al., (2009) reported low to medium Nitrogen content in their respective study area and quoted the that, more volatilization occurs duetohightemperatureinsemi-aridclimateresultsinlowNitrogencontentinthesoils.
B. Available Phosphorus
Phosphorusisthesecondmostcriticalplantnutrientwhichisessentialforthegrowthofplantsduringflowering stage. It is estimated that 0.1 per cent of the total weight of the soil is from phosphorus. But only one per cent of it is availabletoplants.Theavailablepartis50percentmadeupfromorganicmatter.TheAvailablePhosphorusstatusinthe selected distributaries of the study area was 37.4, 34.27 and 29.79 kg ha-1 for D-17, D-65 and D-95 respectively. The Phosphorus content is medium range in the study area. Yeledhalli, et al., (2008) reported low to medium rate of phosphoruscontentanddecreasedconsiderablywithdepth.ThePhosphorouscontentcanbeincreasedbycultivationand phosphorusfertilization,Binitha et al., (2009).
C. Available Potassium
Potassium is involved in water control and the transport of reserve chemicals in plants. It improves photosynthesis, strengthens cell tissue, and promotes nitrate absorption. The available Potassium content in selected distributariesofthestudyareawas164.42148.85and147.63kg ha-1forD-17,D-65andD-95respectively.TheAvailable Potassiumstatus inthestudyarea wasmedium. Yedalli et al., (2009)reportedthe mediumto high potassium content in the TLBC command area. Since the soils of the TLBC command area are derived from granite-gneisses parent rock containing Potassium bearing minerals like mica and feldspars. Binitha et al., (2009) and Prasad et al., (2020) reported mediumtohighPotassiumcontentinthesoilsoftheirstudyareaandconfirmedthat,theadequateamountofPotassium inthesoilsattributedtotheprevalenceofPotassium-richmineralslikeIlliteandFeldsparsintheInceptisols,Alfisolsand Vertisols.
D. Sulphur
IthelpsintheformationofChlorophyll,requiredforphotosynthesisandtissuedevelopment.Theconcentrationof Sulphurintheselecteddistributariesofthestudyarea was228.3mgkg-1,215.1mgkg-1 and213.5kgha-1 forD-17,D-65 andD-95respectively.TheSulphurcontentwaslowinthestudyarea.
E. Calcium
Itisessential forcell developmentandgrowth.Calciumhelpsinthemineral retentioninthesoilaswell astheir transferandalsohelpsinseeddevelopment.TheCalciumcontentinthesoilsamplesforD-17,D-65andD-95was83.14, 2596.69 and 2338.63 mg kg-1 respectively. The low Calcium content was observed in the D-17 and high Calcium content was observed in the D-65 and D-95. Ananthanarayana, 1978 reported higher exchangeable Ca and Mg content can be obtainedinblacksoilsasthesoilsarecalcareoussoilsthanredandlateritesoils.
F. Magnesium
Magnesium plays an active role in plant growth and metabolism. It regulates the ATP enzymes, carbon dioxide fixation,cellularpHcontrol,chlorophyllcontent,chloroplastpigmentationandmanyotherfunctionsofcropdevelopment (Imran et al., 2010). The Magnesium content in the selected distributaries D-17, D-65 and D-95 were 436.6 mg kg-1 ,
International Research Journal of Engineering and Technology (IRJET) e-ISSN:2395-0056
Volume: 11 Issue: 08 | Aug 2024 www.irjet.net p-ISSN:2395-0072
3148.43 mg kg-1 and 3062.98 mg kg-1 respectively. The Magnesium content was high (more than 120 mg kg-1) the study area.SimilarresultwasreportedbyBinitha et al., (2009).
G. Manganese
Itactivatesenzymesinvolvedinrespiration,photosynthesisNitrogenmetabolism.Itsplitsthewatermoleculeto liberatetheoxygenduringphotosynthesis.TheaverageconcentrationofManganeseintheD-17,D-65andD-95wasfound tobe73.13,218.79and283.73mgkg-1.AccordingtoInternationalagriculturalsoilstandards,thesoilsamplesoftheD-17 were found within the permissible maximum limits of 100 mg kg-1 whereas the D-65 and D-95 showed higher concentration. Srikanth et al., (2008) reported that higher Available Manganese content in soils originated from granite genesis parent material with semiarid climate. High concentration of Manganese in soils can cause swellings of cell wall, weatheringofleavesandbrownspotsonleaves.
H. Zinc
PlantsobtainZincintheformofZn2+ ions.Itactivatesenzymesintheprocessofcarboxylases.Theconcentration ofZincwasfoundtobein17.02mgkg-1,16.35mgkg-1and19.22mgkg-1forD-17,D-65andD-95respectively.Onthebasis of Soil test rating of primary, secondary and cationic micronutrients, the Available Zinc concentration was high (greater than1.2mgkg-1)inallthedistributariesofthecommandarea.SimilarresultswereobtainedbyImran et al., (2010).The soilhavinggreatersurfaceareaarecapableofabsorbingagreaternumberofionsandionexchangethusitcancontribute togreaterDTPA-extractableformsofmetalionsPrasad et al., (2020).
Copperdoesnotbreakdownintheenvironmentandcanbeaccumulatedinplantsandanimalswhenitisfoundin soil.Itisabsorbedascupricions(Cu2+).Itisessentialfortheoverallmetabolisminplants.ThevalueofCopperinthesoil samples was found to be 2.14, 7.74 and 7.36 mg kg-1 for the D-17, D-65 and D-95 respectively. Similar analysis for the estimationofCopperdonebyArokiyaraj et al., (2017)overTamilnadu,Meena et al., (2017)andreportedthattheincrease inAvailableCoppercontent inthesoilincrease withincreasein claycontent,which mightbeduetotheimprovementin soilstructureandaerationconditionsofsoilswithincreaseinfinerfractionsinsoilmass.Thus,thesoilsofthestudyarea havehigheramountofCoppercontent.
J. Iron
It is required for the formation of chlorophyll in plant cells and serves as an activator for biochemical processes such as respiration, photosynthesis and symbiotic Nitrogen fixation. The Available Iron content in in the selected distributariesD-17, D-65andD-95was4083.45,7116.59and6931.21mgkg-1respectively.Onthebasisofcritical limits,thesoilsofthestudyareaarehighinIroncontent.
4. Conclusion
Thesoilsofthecommandarea wereclassifiedasclayeysoils,non-salineto salinewithpHandECe rangingfrom 7.63 to 8.53 and 0.85 to 1.13 dS m-1 with very slow to slow infiltration capacity. The soils have medium to high concentration of micro and macro nutrients in the study area. All these said nutrients decreased with depth. Therefore, using the soils according to their potential and suitability and by applying the required management would optimize agriculturalproductioninasustainablemanner.Specialemphasisshouldalsobegiventosoilorganicmattermanagement asitplaysamajorroleinsoilphysical,chemical,andbiologicalquality.Additionally,integratedsoilfertilitymanagement shouldbeimplementedintheareatooptimizeandsustaincropproduction.
Acknowledgement
TheauthorsaregratefultoCSIRHRDG,New DelhiforprovidingthefinancialsupportinpursuingPh.D.research workinthedepartmentofsoilandwaterengineering,CAE,UASRaichur.
References
Alloway,B.J.(1990)HeavyMetalinSoils.JohnWileyandSons,NewYork,NY,USA.
Ananthanarayana, R., 1978, Dynamics of Mg in relation to crops in soils of Karnataka Ph. D. Thesis, University of agriculturalsciences,Bangalore(India).
International Research Journal of Engineering and Technology (IRJET) e-ISSN:2395-0056
Volume: 11 Issue: 08 | Aug 2024 www.irjet.net p-ISSN:2395-0072
Arokiyaraj,S.,Vincent,S.,Saravanan,M.,Lee,Y.,Oh,Y.K.,andKim,K.H.2017,Greensynthesisofsilvernanoparticlesusing Rheum palmatum root extract and their antibacterial activity against Staphylococcus aureus and Pseudomonas aeruginosa. Artificial Cells Nanomedicine and Biotechnology.45:372-379.
Bai,R,M.,Vidyavathi,G.Y.,Yadahalli,G.S.,Rajesh,N.L.andRudramurthy,H.V.,2017,Soilfertilitystatusofpannurnorth-3 microwatershedofManvitaluk,Raichurdistrict, Karnataka International Journal of Chemical Studies. 5(5):19491955.
Binita, N. K., Dasog, G. S.and Patil, P. L. 2009, Soil fertility mapping in Ghataprabha left bank canal command area of north Karnataka bygeographic informationsystemtechnique. Karnataka Journal Agricultural Sciences. 22(1):7376.
Imran, M., Khan, A., Hassan, A., Kanwal, F., Liviu, M., Amir, M. and Iqbal, M.A., 2010, Evaluation of physico-chemical characteristics of soil samples collected from Harrapa-Sahiwal (Pakistan). Asian Journal of Chemistry. 22 (6):4823-4830.
Jackson,M.L.,1973,Soilchemicalanalysis.PrenticeHallofIndiaPvt.Ltd.,NewDelhi,pp.183-192.
Manjunatha, M. V., Oosterbaan, R. J., Gupta, S. K., Rajkumar, H., Jansen, H., 2004, Performance of subsurface drains for reclaiming waterlogged saline lands under rolling topography in Tungabhadra irrigation project in India. Agricultural Water Management. 69:69–82.
Meena, R. S. and Mathur, A. K., 2017, Available micronutrients in relation to soil properties of Ghatol Tehsil, Banswara DistrictofRajasthan,India. International Journal of Current Microbiology and Applied Sciences. 6(7):102-108.
Muhr,G.R.,Datta,N.P.,ShankaraSubraney,N.,Dever,F.,Lecy,V.K.andDonahue,R.R.,1963.SoilTestinginIndia.USAID MissiontoIndia.
Nigam,G.K.Pandey,V. K.,Tripathi,M. P.,and Sinha,J., 2014,Assessment ofMacro and MicroNutrientsofSoil ina Small AgriculturalWatershed. International Journal of ChemTech Research,6(7):3658-3664.
Phogat,V.K.,Tomar,V.S.andDahiya,R.,SoilPhysicalProperties.1-39.
Piper,C.S.,1966,Soilandplantanalysis.TheUniversityofAdelaide,Australia.pp. 65-66.
Prasad, P. N. S., Subbarayappa, C. T., Ramamurthy, V. and Sathis A., 2020, Quantifying and Mapping of Major, Secondary and Micronutrient Status of Tomato Growing Soils in Kolar District, Karnataka Using GIS and GPS Approach. International Journal of Plant and Soil Science. 32(14):14-27.
Rajkumar,R.H.,Dandekar,A.T.Anand,S.R.,Vishwantha,J.,Karegoudar,A.V.,Kuchnur,P.H.andSingh,Y.K.,2018,Effectof Precision Land Levelling, Zero Tillage and Residue Management on Yield and Water Productivity of Wheat (Triticum aertivum L.) under Saline Vertisols of Tungabhadra Project Command. International Journal of Current Microbiology and Applied Sciences. 7(10):2925-2935.
Rajkumar,R.H.,Nemichandrappa,M.,Dandekar,A.T.,Ayyanagowdar,M.S.,Polisgowdar,B.S.,Rao,S.andVishwanatha,J., 2019,Effectofdifferentirrigationmethodsandsalinewateronsoilpropertiesintomato(Solanumlycopersicum) cropundervertisolsofTungabhadraprojectcommand. International Journal of Chemical Studies.7(4):2952-2957.
RashidA,YasinM,AshrafM,MannRA.Borondeficiencyincalcareousreducesonriceyieldandimpairsgrainquality.Int. RiceRes.Notes.2004;29:58-60.
Shridhar,Vishwanath,J.,Balanagoudar,S.R.,Veeresh,H,andAnand,S.R.,2019,Micronutrientstatusofsaltaffectedsoils ofHospettalukinTBPirrigationcommandarea. Journal of Pharmacognosy and Phytochemistry,8(5):1015-1021
Yeledhalli, N. A., Prakash, S. S. and Ravi, M. V., 2008, Productive Potential of Soils of Tungabhadra Project Area for Bt Cotton. Karnataka Journal of Agricultural Sciences. 21(1):35-37.