
International Research Journal of Engineering and Technology (IRJET) e-ISSN: 2395-0056
Volume: 11 Issue: 08 | Aug 2024 www.irjet.net p-ISSN: 2395-0072

International Research Journal of Engineering and Technology (IRJET) e-ISSN: 2395-0056
Volume: 11 Issue: 08 | Aug 2024 www.irjet.net p-ISSN: 2395-0072
Prit J. Kanadiya1 , Pramila M. Chawan2
1Final Year B. Tech, Department of Computer Engineering and Information Technology, VJTI Mumbai, Maharashtra, India
2 Associate Professor, Department of Computer Engineering and Information Technology, VJTI Mumbai, Maharashtra, India ***
Abstract – In this study, we introduce a novel hybrid approach for house price prediction by integrating K-Nearest Neighbors (KNN) with Linear Regression. Our method leverages the strengths of both models to enhance predictive accuracy. Initially, we evaluate the effectiveness of geospatial features in Linear Regression and K-Nearest Neighbors for predicting house prices in Mumbai. We utilize two distinct datasets: one containing traditional features such as the number of bedrooms, square footage, and other property characteristics, and another incorporating geospatial data represented by latitude and longitude. Building on this analysis, we propose a method that first identifies the K nearest houses usingKNN, andthenapplies LinearRegression on this localized subset to predict the price of a test property. Our hybrid model demonstrates significant improvements in predictiveperformance, highlightingthecriticalroleofspatial information in real estate valuation.
Key Words: House price prediction, Hybrid Prediction Model, Geospatial features, Predictive analysis, Feature Engineering, Machine learning
Predicting house prices is a key challenge in machine learning with broad applications in real estate and urban planning. Despite significant advancements in this field, accuratelyforecastingpropertyvaluesremainsdifficultdue tothenumerousfactorsthatinfluenceprices.Traditionally, housepricepredictionmodelsrelyonfeaturessuchasthe numberofbedrooms,thesizeofthepropertyinsquarefeet, andthebuilding’sage.However,thesefactorsaloneoftenfail tocapturethefullpictureofpropertyvalue.
Onecrucialaspectthattraditionalmodelsmightoverlookis the exact location of a property. Location, represented by latitudeandlongitude,cansignificantlyimpacthouseprices byreflectingfactorslikeconnectivity,neighborhoodquality, and proximity to amenities. For example, the value of a house in a well-connected area with good schools and nearby public transport can differ greatly from a similar house located in a less desirable area. It might not be possibletocapturethesefeaturesexplicitly.Thelocationofa house implicitly models all these features. This spatial
information can provide insights into aspects like accessibilityandlocalservicesthataredifficulttoquantify butcrucialforaccuratepricepredictions.
Inthisstudy,weproposea newmethodthatcombines KNearestNeighbors(KNN)withLinearRegressiontoenhance house price prediction. We test this hybrid approach by comparing it with Linear Regression and KNN. Using two datasets onewithtraditionalfeatureslikethenumberof bedrooms and property size, and another with geospatial featuressuchaslatitudeandlongitude weaimtoassess howincorporatinggeospatialdataimprovestheaccuracyof housepricepredictions.
Our research is structured as follows: Section 2 reviews relatedliteraturetocontextualizeourapproach. Section 3 providesdetailsonthemethodologywhichinvolvesdataset, feature engineering, evaluating the impact of geospatial features, and describing our proposed hybrid model. The results of our studies are presented and interpreted in Section4,andthepaper'sconclusionanddiscussionofthe ramificationsofourfindingsarecoveredinSection5.
House price prediction can be modeled as a supervised learningproblem,wherethegoalistopredictthepriceofa housebasedoncertaincharacteristics.Mathematically,we have a dataset D = {(Xi, Yi) | i = 1, 2, ...,n}, where Xi ∈ Rm represents the feature vector of the i-th house and Yi ∈ R denotesthecorrespondinghouseprice.Ourgoalistolearna hypothesisfunctionthataccuratelymodelsthehouseprices bymappingthefeaturesofthehousei.e.XitoitspriceYi.We needtofindtheoptimalhypothesisfthatminimizesthecost functionrepresentedasJ(θ).

Here, ℓ(f(Xi), Yi)representsthelossfunctionthatmeasures theerrorbetweentheactualprice Yi.andthepredictedprice f(Xi).
International Research Journal of Engineering and Technology (IRJET) e-ISSN: 2395-0056
Volume: 11 Issue: 08 | Aug 2024 www.irjet.net p-ISSN: 2395-0072
Theoptimizationprobleminvolvesselecting f suchthat J(θ)is minimized,therebyprovidingthebestpossiblepredictionsof housepricesbasedontheinputfeatures.
Linear Regression and K-Nearest Neighbors (KNN) are popular algorithms to solve this problem. Each of these modelshasitsownassumptionsandcharacteristics,which wewilldiscussinthissection.
Linear regression is a common method for predicting continuousvalues,suchashouseprices,byfittingastraight linethroughthedata
Linear regression makes two core assumptions about the data. First, it assumes a linear relationship between the featuresandthelabel.Forexample,housepricemighthavea linear relationship with the area of the house. The second assumption is that the noise, indicated by ε, follows a Gaussian distribution. This means the data points will be scattered around the true linear regression line in a bellshapedcurve.
MathematicalFormulation:Givenadataset D ={(Xi,Yi)| i =1, 2,...,n},where Xi ∈ Rm representsthefeaturevectorofthe i-th houseand Yi ∈ R isthetargetedprice,andtheaimistofind thelinethatbestfitsthedata
HypothesisFunction:f(Xi)=θ0 +θ1Xi1 +θ2Xi2 +···+θmXim whereθ0,θ1,...,θm areparameterstobelearned.
Cost Function (Mean Squared Error): The objective is to minimizeJ(θ)tofindtheoptimalparametersθ.

Linearregressionworkswellfortraditionalfeatureslikethe number of bedrooms or the square footage of a house, as theseoftenhavealinearrelationshipwithhouseprices.
ThecoreassumptionthatKNNmakesisthatinstancesthat arenearinthefeaturespacehavesimilartargetvalues Thus, thetargetvalueofanewinstanceislikelytobethesameas itsnearestneighbors.Inthismodel,thealgorithmlooksatthe pricesoftheknearesthouses(its"neighbors")andtakesthe average of their prices when predicting the price ofa new property.
MathematicalFormulation:Givenadataset D ={(Xi,Yi)| i =1, 2, ...,n},where Xi ∈ Rm representsthefeaturevectorofthe i-th houseand Yi ∈ R denotesthecorrespondinghouseprice,and
anewquerypointX,weneedtofindtheaverageofthetarget valuesoftheknearestneighbors.

where Yi1, Yi2,...,Yik are the target values of the k nearest neighborsofquerypointX.
This model works well in real estate, especially because houses in the same area often have similar prices. For example,housesinthesamelocalityinMumbaiarelikelyto have prices that are close to each other or that follow a commontrend.
Thissectionoutlinesthemethodologyusedforobtainingthe proposed solution and explains the algorithm for the new solution. First, we cover the dataset and the feature engineering steps. Next, we evaluate the influence of geospatial features on existing machine learning models. Finally,weproposeourhybridalgorithm.
We utilized the Mumbai House Prices dataset on Kaggle, which contains house prices for several locations across Mumbai.Thedatasetincludesessentialfeaturessuchasthe numberofbedrooms(BHK),typeofhouse,locality,region, areainsquarefeet,price,andadditionalattributessuchas whetherthehouseisneworresaleandwhetheritisreadyto moveinorstillunderconstruction.Thedatasetconsistsof 76,038instances.
Although the dataset includes valuable geospatial information,suchaslocalityandregion,thisinformationis notdirectlyusableinitsrawform.Additionally,severalfields, such as the type of house, are categorical and require conversion to numerical values before applying machine learningalgorithms.Tomakethedatamoreapplicabletoour analysis,weperformedseveralstepsoffeatureengineering.
1.AddingGeographicalCoordinates
Tointegratelocationinformationintoouranalysis,weadded latitudeandlongitudecoordinatesforeachpropertybased on its region. We identified 228 unique locations and convertedtheseintolatitudeandlongitudeusinggeocoding. Weexperimentedwithtwogeocodinglibraries,Nominatim andGeocoder.Geocoderprovedtobemoreeffective,offering support for more regions and providing more accurate results.Somelocations,suchas“Khar,Mumbai,India”and
International Research Journal of Engineering and Technology (IRJET) e-ISSN: 2395-0056
Volume: 11 Issue: 08 | Aug 2024 www.irjet.net p-ISSN: 2395-0072
“Belapur,Mumbai,India,”wereincorrectlymapped.Forthese cases,wemanuallycorrectedthelatitudeandlongitude.
Although we considered using both locality and region to define unique locations, this approach resulted in 9,842 unique locations, which requires more processing without significantlyenhancingperformance.Therefore,wechoseto useregionaloneforgeocoding,whichsimplifiedtheprocess whilestilleffectivelyincorporatinggeospatialfeatures.
2.EncodingOrdinalData
Some features in our dataset are categorical and have a natural order or ranking. To employ these categorical featuresinmachinelearningmodels,weneedtofirstconvert them into numerical values. Here's how we handled these features:
We assigned numerical values to different house characteristicstosimplifytheirrepresentationinthemodel. Forthetypeofhouse,therearefivecategories,rangingfrom a"StudioApartment,"whichiscodedas0,toa"Penthouse," codedas1. TheintermediatecategoriessuchasApartment, IndependentHouse,andVillaarecodedas0.25,0.5,and0.75 respectively.
Similarly,theageofthehousewasrepresentednumerically, with"Resale"codedas0,"New"as1,and"Unknown"as0.5. Thehousestatuswasalsotranslatedintonumericalvalues, where"UnderConstruction"wasassignedavalueof0and "ReadytoMove"wasassignedavalueof1.
By encoding these categorical features in this way, we preserve their inherent order or ranking, which helps our machine learning models understand and use this informationeffectively.
3.ConvertingPriceDatatoaCommonUnit
Thedatasetfeaturespricesintwodifferentunits:Lakhsand Crores. To ensure consistency, we converted all prices to Crores.Forinstance,ifapricewaslistedinLakhs,wedivided itby100toconvertittoCrores.
4.RemovingUnnecessaryColumns
Columnssuchas“locality”and“region”areredundantsince latitude and longitude effectively describe the geospatial featureofahouse.Additionally,the“price-unit”columnwas nolongernecessaryafterthepriceconversion.Weremoved these columns to streamline the dataset and focus on the mostrelevantfeatures.
3.1.2
Afterfeatureengineering,ourdatasetincludesthefollowing fields: BHK, type, area, price, status, age, latitude, and longitude. This enhanced dataset, which integrates both traditional features and geospatial information is used for trainingandevaluatingourmachinelearningmodels.
Theentirepreprocessingandfeatureengineeringprocessis executedusingPython,andthefinaldatasetwassavedfor furtheranalysis.
Tables1and2showtheperformanceofLinearRegression andK-NearestNeighbors(KNN)ontraditionaldatasetsand geospatial datasets, respectively. Both the models are compared using MAE, MSE, and R-squared score. The traditionaldatasetincludesonlytraditionalfeatureslikethe numberofbedroomsandsquarefootage,whilethegeospatial dataset also adds geospatial features, such as latitude and longitude
Table -1: ModelPerformanceonTraditionalDataset LinearRegression
Table -2: ModelPerformanceonGeospatialDataset
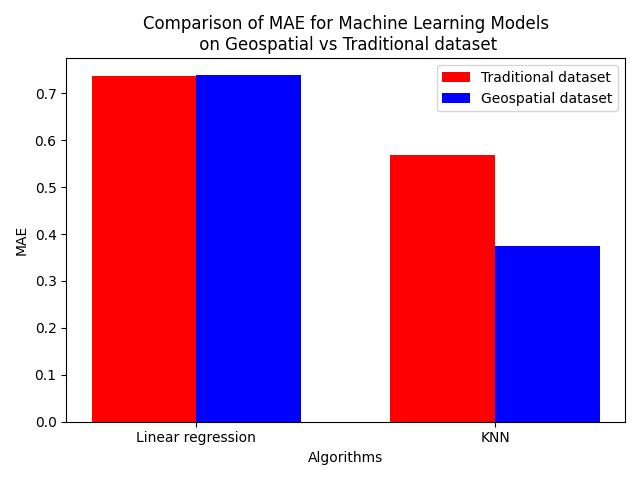
Chart1illustratestheMAEforeachmodel across thetwo datasets. Red bars represent performance with the traditional dataset, while blue bars show results with the geospatialdataset.KNNnotablybenefitsfromtheinclusion ofgeospatialfeatures,withasubstantialreductioninMAE. This indicates that KNN effectively captures the spatial proximityofhouses.
The higher errors observed with KNN on the traditional dataset suggest that traditional features alone are insufficient for accurate predictions in urban areas like Mumbai,wherespatialfactorsplayacrucialrole.
Linear Regression shows almost the same MAE for both datasets, implying that the model does not significantly benefitfromtheadditionalgeospatialdata.Infact,theMAE for the traditional dataset is slightly lower than for geospatialdataset.ThismaybebecauseLinearRegression struggleswithnon-linearrelationshipsinspatialdata.Since house prices do not necessarily follow a linear pattern relative to geographic location, incorporating latitude and longitude does not substantially improve its predictive performance.
International Research Journal of Engineering and Technology (IRJET) e-ISSN: 2395-0056
Volume: 11 Issue: 08 | Aug 2024 www.irjet.net p-ISSN: 2395-0072
-1:ComparisonofMAE
Chart2,whichdepictstheMSE,supportstheMAEfindings. ThegeospatialdatasetconsistentlyresultsinlowerMSEfor KNNcomparedtothetraditionaldataset.LinearRegression showsminimalimprovementinMSEwiththeinclusionof geospatialfeatures,reinforcingtheideathatlinearmodels donoteffectivelyutilizespatialdatafornon-linearproblems.
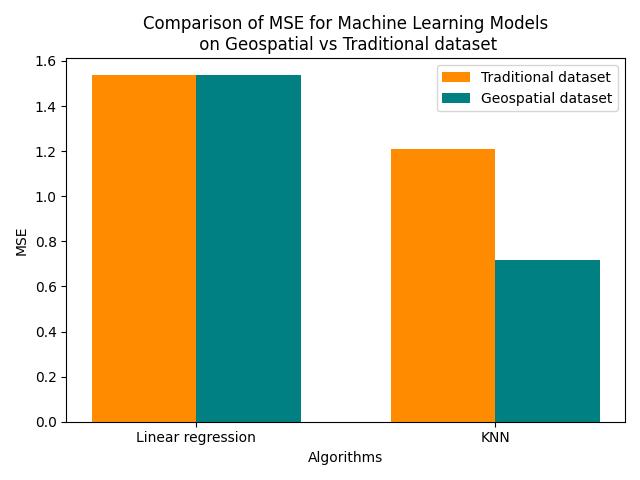
Chart -2:ComparisonofMSE
Chart3displaystheR-squaredscoresforbothmodels.KNN demonstratesahigherR-squaredscorewiththegeospatial dataset, indicating a better fit for the variability in house prices.Thescoreforlinearregressiononlyimprovesslightly aftertheadditionofgeospatialfeatures.
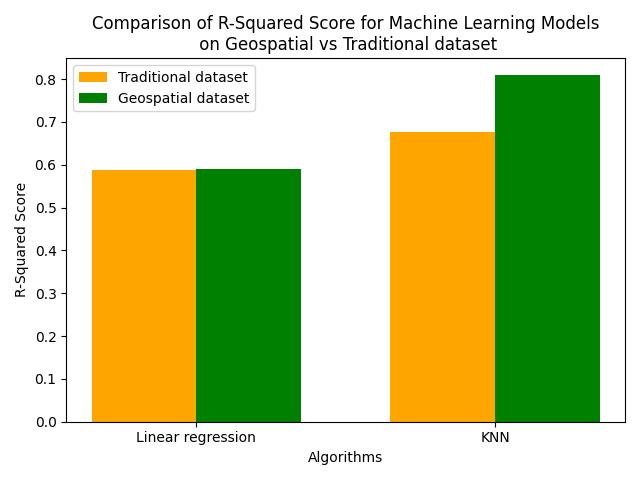
-3:ComparisonofR-SquaredScore
These results indicate that KNN is most benefited when geospatialfeaturesareincluded.Weonlyobserveamarginal improvementinthelinearregressionmodelafteraddingthe geospatialfeatures.
BothLinearRegressionandK-NearestNeighbors(KNN)have their own advantages and limitations. From the results in Section3.2,weobservethatgeospatialfeaturessignificantly enhance the performance of KNN. While KNN excels at capturing the impact of location, Linear Regression offers benefits,especiallyincaseswherethetestandtrainingdata differsubstantiallyincertainfeatures,suchasthenumberof bedrooms.
One drawback of Linear Regression is its reliance on the mean,whichmakesitsensitivetooutliers.Thischaracteristic couldexplainitsweakerperformancecomparedtoKNNin house price prediction tasks, where outliers can skew predictions.Insuchcases,themedianoftenprovidesabetter representationoftypicalvalues.Overall,whileKNNbenefits greatlyfromincorporatinggeospatialdata,LinearRegression shows limited improvement, highlighting its limitations in capturingcomplex,non-linearspatialrelationships.
We provide a hybrid method that incorporates the best features of both models in order to overcome these drawbacks. Our approach integrates KNN's ability to incorporate spatial information with Linear Regression's capability to model relationships between traditional featureslikepropertysizeandnumberofbedrooms.
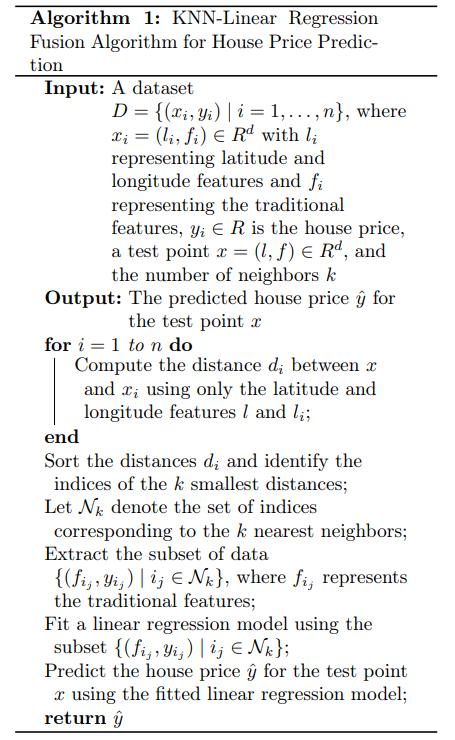
Let D = {(xi, yi)| i =1,...,n}represent the dataset, where xi = (li,fi)∈Rd isavectorcontainingthefeaturesofthe i-thhouse, with li ∈R2representingthegeospatialfeatures(latitudeand longitude),and fi ∈Rd 2representingthetraditionalfeatures. yi ∈Risthehouseprice.Thegoalistopredicttheprice yˆfor anewhouse x =(l, f).
International Research Journal of Engineering and Technology (IRJET) e-ISSN: 2395-0056
Volume: 11 Issue: 08 | Aug 2024 www.irjet.net p-ISSN: 2395-0072
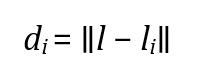
For each house i in the dataset, calculate the Euclidean distancebetweenthegeospatialfeatures l ofthetesthouse andthoseofthe ith house,denotedas li.
Sort the distances {di} in ascending order and select the indicesofthe k smallestdistances,denotedasNk ={i1,i2,...,ik}, where k isthenumberofnearestneighbors.
Next,weextractthesubsetofdatacorrespondingtotheKnearestneighbors
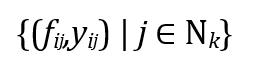
Here, fij representsthetraditionalfeaturesofthe jth nearest neighborand yij isthecorrespondinghouseprice.
Wenowhaveasubsetoftheoriginaldatathatislocatednear point x. This subset of data is what we utilize to build the linearregressionmodel.Thefollowingistheexpressionfor thelinearregressionmodel:
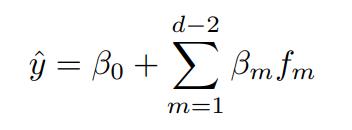
where fm arethetraditionalfeaturesofthetestproperty,and β0,β1,...,βd 2aretheregressioncoefficientsestimatedusingthe nearestneighbors’data.
Thepredictedhousepriceforthetestproperty x isobtained by applying the trained linear model to the traditional features f ofthetestproperty.
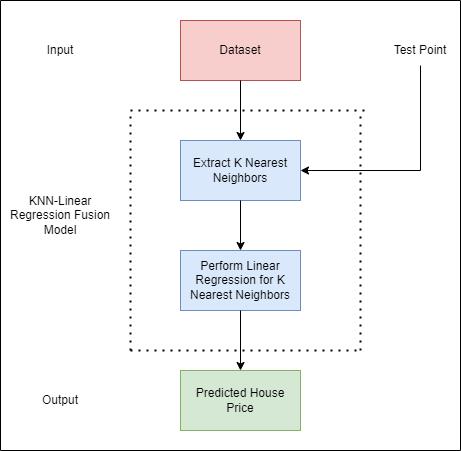
The pseudocode for the algorithm is outlined in Figure 1. Figure 2 displays the algorithm's flowchart. The algorithm consists of two main steps: the KNN step and the Linear Regressionstep.
Thishybridapproachcapturesthespatialinfluencethrough KNNwhilemodelingthepricebasedontraditionalfeatures usingLinearRegression.Byfirstleveraginglocation-based neighborsand then applying regression on these localized data points, the algorithm balances spatial context with traditional house features to provide more accurate predictions.
Research
Volume: 11 Issue: 08 | Aug 2024 www.irjet.net p-ISSN: 2395-0072
4.1
Inthisstudy,wecomparetheperformanceofthreemodels: LinearRegression,K-NearestNeighbors(KNN),andahybrid KNN-linearregressionmodel.Thedatasetusedcomprises 76,038instances,whicharedividedintotraining,validation, and test sets. Specifically, the test and validation set each consist of 5% of the total dataset, that is 3,801 instances each.Toensurethereproducibilityofourexperiments,we setafixedrandomstateof42,whichallowsforconsistent samplingofthetestandvalidationsets.FortheKNNmodel, weselectthehyperparameterKKKas17.Inthecaseofthe hybrid KNN-linear regression model, the hyperparameter KKKissetto201.TheLinearRegressionmodelutilizesthe Ordinary Least Squares (OLS) method for estimating parameters. All the hyperparameters are tuned over the validationset,andthefinalresultsarereportedbasedonthe testset.
Table3presentsacomparativeanalysisofourhybridmodel againstLinearRegressionandK-NearestNeighbors(KNN) usingthreeevaluationmetrics:MeanAbsoluteError,Mean SquaredError,andR-squaredscore.
Table -3: Comparisonofmodels
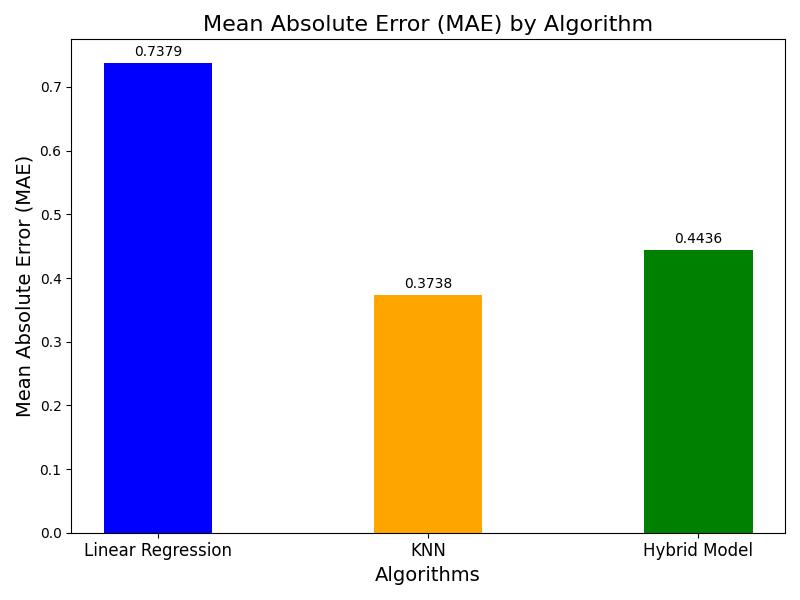
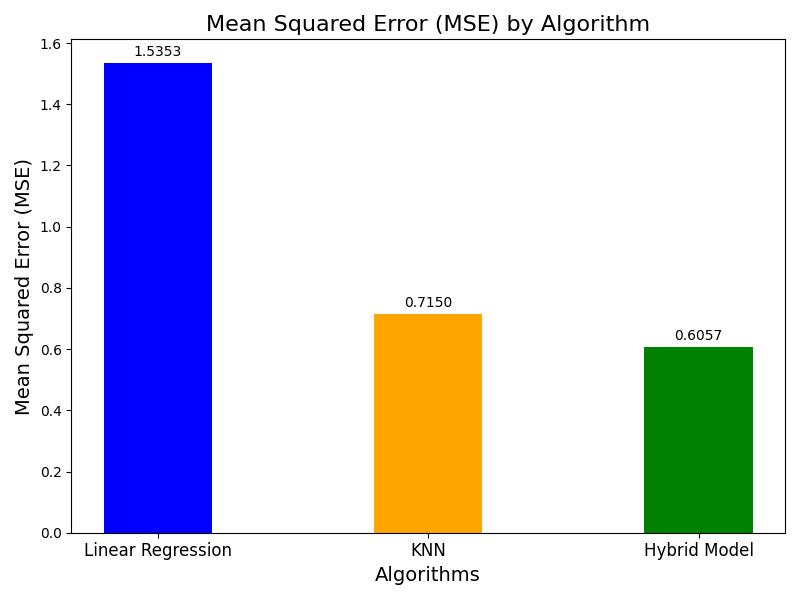
Chart 4 illustrates that KNN attains the lowest MAE, indicatingthesmallestaverageerror.However,ourhybrid model exhibits an MAE only marginally higher than KNN, demonstratingitscompetitiveperformance.
Chart 5 illustrates that our hybrid model significantly outperforms all other models in terms of MSE. The hybrid model achieves a lower MSE compared to both Linear Regression and KNN, highlighting its superior accuracy in errorminimization.
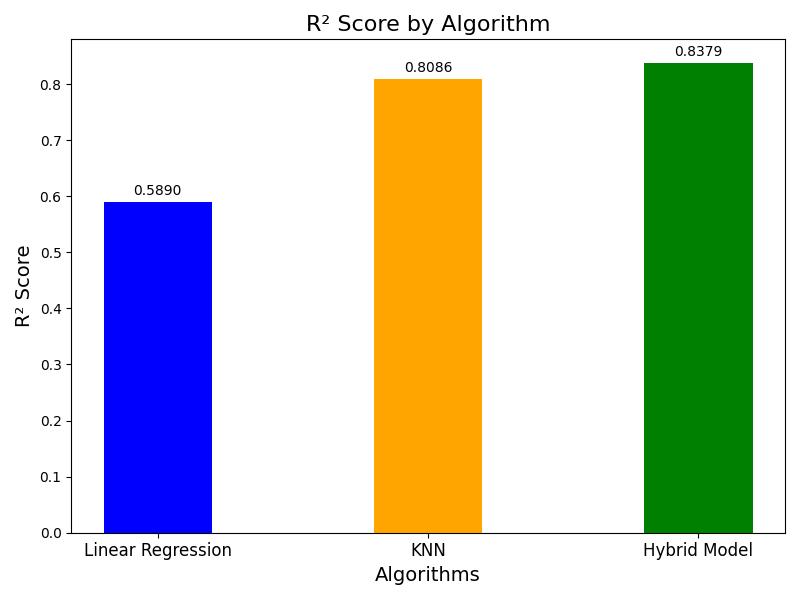
Chart 6 reveals that our hybrid model has the highest RSquaredscoreamongthemodelstested.Thisindicatesthat our model explains the greatest proportion of variance in houseprices,thusprovidingthebestfittothedata.
Our hybrid model demonstrates superior performance comparedtobothLinearRegressionandKNN.DespiteKNN having the lowest MAE, our hybrid model achieved the lowestMSEandhighestR-Squaredscore.Thisindicatesthat thehybridapproachnotonlyreducespredictionerrorsmore effectively but also provides a better fit to the data. Thus, incorporatingtheadvantagesofbothofthemodelsallowsus toenhanceaccuracyinhousepriceprediction.
International Research Journal of Engineering and Technology (IRJET) e-ISSN: 2395-0056
Volume: 11 Issue: 08 | Aug 2024 www.irjet.net p-ISSN: 2395-0072
In this study, we developed a new hybrid approach for predictinghousepricesbycombiningK-NearestNeighbors (KNN) with Linear Regression. Our goal was to see if this combined method could provide better predictions than usingeithermodelalone,particularlywiththeinclusionof geospatialfeatureslikelatitudeandlongitude.
Our results show that although KNN achieved the lowest Mean Absolute Error, our hybrid model outperformed it overall.IthadthelowestMeanSquaredErrorandthehighest R-squaredscore,meaningitwasthemostaccurateandbest at explaining the variability in house prices. This suggests thatourhybridmethodismoreaccurateatpredictinghouse pricesthanusingLinearRegressionorKNNalone.
Thesuccessofourhybridmodelhighlightstheimportanceof incorporatinggeospatialdataintothepredictionprocess.By combiningKNN’sstrengthinhandlinglocaldatawithLinear Regression’sabilitytomodelrelationshipsbetweenfeatures, wecreatedamodelthattakesadvantageofbothapproaches.
Insummary,ourhybridapproachoffersanewalgorithmto predicthousepricesmoreaccurately.Futureresearchcould build on this work by combining the advantages of more models or including additional types of data, such as economicindicatorsormarkettrends,toseeifwecanmake evenbetterpredictions.
[1] Mohd,T.,Jamil,N.S.,Johari,N.,Abdullah,L.,Masrom,S. (2020). An Overview of Real Estate Modelling Techniques for House Price Prediction. In: Kaur, N., Ahmad,M.(eds)ChartingaSustainableFutureofASEAN in Business and Social Sciences. Springer, Singapore. https://doi.org/10.1007/978-981-15-3859-9_28
[2] Guangliang Gao, Zhifeng Bao, Jie Cao, A. K. Qin, and Timos Sellis. 2022. Location-Centered House Price Prediction:AMulti-TaskLearningApproach.ACMTrans. Intell. Syst. Technol. 13, 2, Article 32 (April 2022), 25 pages.https://doi.org/10.1145/3501806
[3] G.Naga Satish, Ch.V.Raghavendran, M.D.Sugnana Rao, Ch.Srinivasulu “House price prediction using machine learning”.IJITEE,2019.
[4] David Emmanuel Aniobi, Chukwuemeka Oluebube Ochuba, Saater Benedicta Nguideen “House price prediction: comparative analysis of regression-based machinelearningalgorithms”,InternationalJournalfor ResearchinAppliedScience&EngineeringTechnology (IJRASET),Volume11IssueXOct2023
doi: https://doi.org/10.22214/ijraset.2023.56232
[5] Sarkar Snigdha Sarathi Das, Mohammed Eunus Ali, Yuan-Fang Li, Yong-Bin Kang, Timos Sellis “Boosting House Price Predictions using Geo-Spatial Network Embedding”, arXiv:2009.00254
doi:https://doi.org/10.48550/arXiv.2009.00254


Prit Jignesh Kanadiya, B.Tech.ComputerEngineering, Veermata Jijabai Technological Institute(VJTI),Mumbai
Prof. Pramila M. Chawan, is workingasanAssociateProfessor in the Computer Engineering Department of VJTI, Mumbai. She has done her B.E.(Computer Engineering) and M.E.(Computer Engineering)fromVJTICollegeof Engineering, Mumbai University. She has 28 years of teaching experienceandhasguided85+M. Tech. projects and 130+ B. Tech. projects. She has published 143 papers in the International Journals, 20 papers in the National/ International Conferences/Symposiums.Shehas worked as an Organizing Committee member for 25 International Conferences and 5 AICTE/MHRD sponsored Workshops/STTPs/FDPs.Shehas participated in 16 National/International
International Research Journal of Engineering and Technology (IRJET) e-ISSN: 2395-0056
Volume: 11 Issue: 08 | Aug 2024 www.irjet.net p-ISSN: 2395-0072
Editor on – JEECER, JETR,JETMS, Technology Today, JAM&AER Engg. Today, The Tech. World Editor–JournalsofADRReviewer -IJEF,InderscienceShehasworked as NBA Coordinator of the ComputerEngineeringDepartment ofVJTIfor5years.Shehadwritten a proposal under TEQIP-I in June 2004 for ‘Creating Central Computing Facility at VJTI’. Rs. EightCroreweresanctionedbythe WorldBankunderTEQIP-Ionthis proposal. Central Computing FacilitywassetupatVJTIthrough this fund which has played a key role in improving the teaching learningprocessatVJTI.Awarded by SIESRP with Innovative & Dedicated Educationalist Award Specialization : Computer Engineering & I.T. in 2020 AD Scientific Index Ranking (World Scientist and University Ranking 2022) – 2nd Rank- Best Scientist, VJTI Computer Science domain 1138th Rank- Best Scientist, ComputerScience,India.