
International Research Journal of Engineering and Technology (IRJET) e-ISSN: 2395-0056
Volume: 11 Issue: 09 | Sep 2024 www.irjet.net p-ISSN: 2395-0072


International Research Journal of Engineering and Technology (IRJET) e-ISSN: 2395-0056
Volume: 11 Issue: 09 | Sep 2024 www.irjet.net p-ISSN: 2395-0072
Mousumi Manna1 , Bodhisattwa Mahata2, Srijan Mukherjee3
1Student (B.Tech), Department of Civil Engineering, OmDayal Group of Institutions, West Bengal, India.
2Student (B.Tech Department of Civil Engineering, OmDayal Group of Institutions, West Bengal, India
3Assistant Professor, Department of Civil Engineering, OmDayal Group of Institutions, West Bengal, India ***
Abstract – Uncontrolled Road intersections encounter with unique challenges for traffic management and safety. Understanding the volume of traffic and the resulting level of service at these intersections are crucial for effective transportation planning and decision-making. The study utilizes a comprehensive data collection process, including classified traffic volume counts, video recording of traffic movements, and manual observations, to gather information on traffic volume and geometric design parameters at selected uncontrolled road intersection. Classified volume count survey was conducted during peak hours using the videography method. This project aimed to determine the capacity and level of service (LOS) provided by the road to the users and also to identify the causes of congestion problems in this intersection. By assessing critical gap, follow-up time, conflicting flow rate, heavy vehicle percentage and various others traffic parameters and analyzing these data, the study intended to provide insights into the existing traffic conditions and also to determine the level of service experienced by road users as per HCM 2010 in Indian condition. This information can guide the development of effective strategies to improve traffic flow and also to reduce congestion in the area.
Key Words: Critical gap, Follow-up time, Conflicting traffic flow, Movement capacity, Control delay, Capacity, Level of service (LOS)
Unsignalized intersections are defined as the intersections where traffic operates on the basis of the priority of traffic movements.Capacityatunsignalizedintersectionsisdefinedasaresultofthebasiccapacitywithinidealtrafficconditions relatedtovariousadjustmentandcorrectionfactors,whichincludedtheimpactofroadenvironment,geometricdesign,and trafficconditions.Theright-turningmovement(incontrastwiththethroughorleft-turnmovements)fromtheminorstreethas thelowestpriorityaccordingtothecorrespondingtrafficlawsincountrieslikeIndia.Theperformanceofanunsignalized intersectionisstronglyinfluencedbythedelaycausedbylow-prioritymovementsonminorroads.Inthisprojectouraimisto studythetrafficmovementfromallapproachesintheselecteduncontrolledroadintersection.Variousparametersthatinfluence thecapacityandLevelofServicewillalsobeanalyzedindetail.Finally,theTrafficFlowConditionwillbeevaluatedalongwith capacityunderconflictingflowsforanuncontrolledintersectioninIndianCondition.
The scopes of the work carried out are:
•ToevaluatethePotentialCapacityandLevelofServiceintermsofControlDelayofthestudiedroadintersection.
•TocalculatetheMovementCapacityoftheintersectionsfromCriticalGapandFollowuptimecalculationusingHighway CapacityManual2010
•Toobservetheconditionoftheintersectionunderheterogeneoustrafficflow.
A 3-legged road intersection is to be selected after map study and reconnaissance survey as the part of the preliminary objectiveoftheproject.Afterwards,videographicdatashouldalsobecollectedalongwiththeGeometricdataoftheselecting intersection.Followingparametersaretobecomputed:
•Hourlyturningmovementvolumes.
•Heavyvehiclepercentagesandpedestriandata.
•Conflictingtrafficflowrateasperthepriorityrankofthemovements.
•CriticalgapandFollowuptimeasperHCM.
LaneCapacity(veh/hr)andLevelofServiceintermsofControlDelay(s/veh)ofthestudiedroadintersectionaretobeworked out.

International Research Journal of Engineering and Technology (IRJET) e-ISSN: 2395-0056
Volume: 11 Issue: 09 | Sep 2024 www.irjet.net p-ISSN: 2395-0072
AccordingtoHighwayCapacityManual [1] (2010)eachmovementataTwoWayStopControlIntersection(TWSC)facesa differentsetofconflictsthataredirectlyrelatedtothenatureofthemovement.TheConflictingFlowRate,(Vc,x)formovement x,thatisthetotalflowratethatconflictswithmovementx(veh/hr).JohnM.Samuelsetal [2] (2002)analyzedtheminimum timeintervalinthemajor-streettrafficstreamthatallowsintersectionentryforoneminorstreetvehicle.Alsoobservedthat CriticalGapcanbemadeonthebasisofobservationofthelargestrejectedandsmallestacceptedgapforagivenintersection.B PrasantaKumarBhuyanandKVKrishnaRao[3](2011)adoptedHCM(2000).P.G.Kumaretal [11] (2020)studiedLOSofUrban andruralroadsinBhimavaram.Thevehicleswereclassifiedintosixcatagories.TheydefinedLOSmainlybyusingV/Cratio andaveragespeedinselectedcorridorsasfollows.B.SomeswaraRao,T.Rambabuetal [9](2017)derivedthatthemaximum capacityi.e.,900veh/hrduringmorningandeveningpeakhoursandhashighestperformancewithLOSAandthecapacityof minorrightisvaryingbetween293veh/hrto456veh/hrinthemorningpeakhouranditisreducedto235veh/hrto384 veh/hrduringeveningpeakhourswhencalculatedwithfourcriticalgapmethods.Thecapacityofminorleftturnisalmost 1000veh/hrinthemorningandpeakhoursandminorrightandmajorrighthavecapacityisvaryingbetween900to1000 veh/hr.ThisintersectionhashighestperformancewithLOSAwhencomparedtoothertwointersections.
After obtaining permission for video data collection from the competent authorities, an important step in conducting a comprehensiveanalysisofthetrafficmovementsatthechosenintersectionhasbeenperformed.Thecollectedvideodatafor themorningpeakhours(9.30amto12.30pm)andeveningpeakhours(4.00pmto6.00pm)providesvaluableinsightintothe traffic patterns during these crucial periods. In addition, collected geometric details also contributed to a more accurate analysis.Theinformationoncarriagewaywidth,shoulderwidth,gradationofapproachroad,numberoflanes,andthenorth directionhelpedinunderstandingthelayoutoftheintersection,whichiscrucialforassessingtrafficoperations.Withthe combinationofvideodataandgeometricdetails,subsequentstepsoftheanalysisareaccomplished,suchasdetermininglevels ofservice,computingcontroldelays,flowrates,identifyingconflictingtrafficflows,andcalculatingqueuelengths.
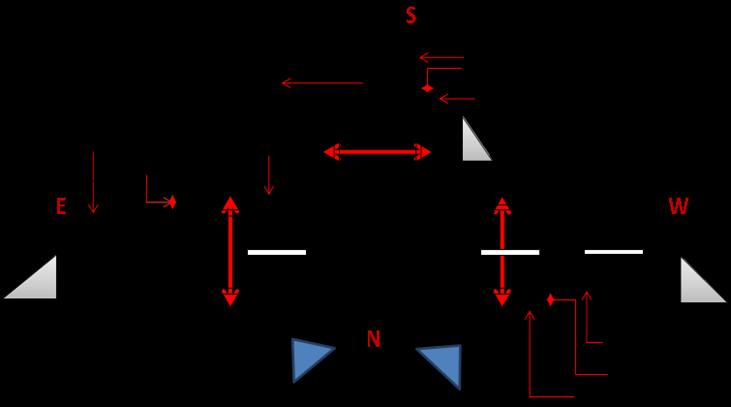
Priority order of Traffic Movements of a 3-legged or T-intersection in Indian condition is demonstrated in the following diagram: StopcontrolledsignisconsideredintheSouthboundMinorStreetapproach.

International Research Journal of Engineering and Technology (IRJET) e-ISSN: 2395-0056
Volume: 11 Issue: 09 | Sep 2024 www.irjet.net p-ISSN: 2395-0072
Table -1: DetailsoftheTrafficandPedestrianmovementsareasfollows
Movement Number
Types of Movement 2-5
MajorTrafficMovements 7,9
MinorTrafficMovements 13-15
PedestrianMovements
Table -2: PriorityorderofTrafficMovementsinIndianCondition
Priority order or Rank
Traffic Stream 1
2,4,5,15 2
3,13,14,7 3 9
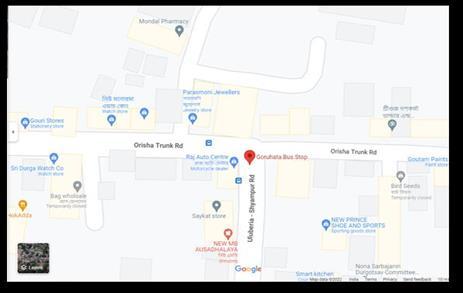
AnuncontrolledT-intersectionsatGoruhataMore,Uluberia,Howrahhasbeenchosen.FollowingaretheMajorandMinor roadsinthisintersectionforcollectingthevideographictrafficdata:
Majorroad:“NH7-UluberiaPoliceStationRoad”and Minorroad:“Shyampur-Gadiararoad”.
Detailsoftheco-ordinateofthisintersection: Latitude-22.468404232405494,Longitude-88.10417879162601
5.1 Geometric Data of the Intersection
• Towards Shyampur Road: Carriagewaywidth-7.106m,Shoulderwidth-0.274m,MarginalStrip-0.173m,Totalroad width-8.0m.,Gradeat8.96%
• Uluberia Station Road: Carriagewaywidth-6.178m,Shoulderwidth-0.305m,MarginalStrip-0.106m,Totalroad width-7.0m.,Gradeat8.96%
• Uluberia College Road: Carriagewaywidth-6.038m,Shoulderwidth-0.254m,MarginalStrip-0.127m,TotalroadWidth -6.8m.,Gradeat6.70%

International Research Journal of Engineering and Technology (IRJET) e-ISSN: 2395-0056
Volume: 11 Issue: 09 | Sep 2024 www.irjet.net p-ISSN: 2395-0072

6. OBSERVATION OF TRAFFIC VOLUME AND DATA EXTRACTION
ObservationofNumberofVehiclesfromeachapproach:Vehiculardataduringobservedpeaktimeperiodarerepresentedin thefollowingtabularform.
Table -3: TrafficDataofvariousmovementsforMajorandMinorRoadsat15mintimeintervals

International Research Journal of Engineering and Technology (IRJET) e-ISSN: 2395-0056
Volume: 11 Issue: 09 | Sep 2024 www.irjet.net p-ISSN: 2395-0072
Chart -1:TrafficMovementsforMinorLeftturn07,MinorRightturn09andMajorThrough02
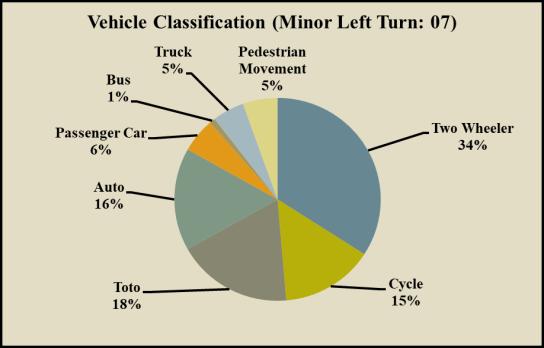
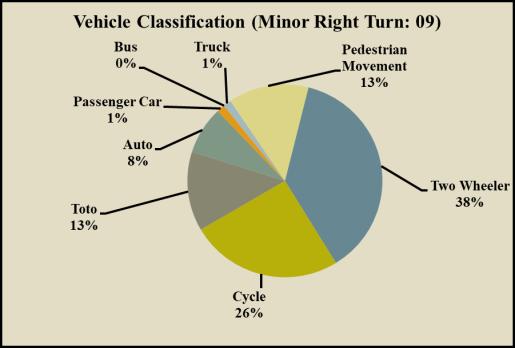
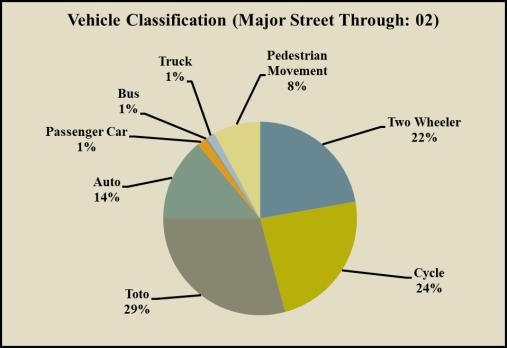
ThisGraphrepresentedtheVehicularandPedestriandatainpercentageformforthetotalobservationperiod.Followingare thenotableobservations-
i) TwowheelersarepredominanttrafficinSouthMinorLeftturn(07). ii) Significantnumberofpedestrianmovementsis observedacrossSouthMinorRightturn(09)and(04). iii) LargepercentageofToto’sandAutosaremovingalongWestBound MajorThrough(02)and(05)respectively. iv) PercentageofBusesandTrucksarecomparativelylowinalltheseapproaches duringtheobservationperiod.
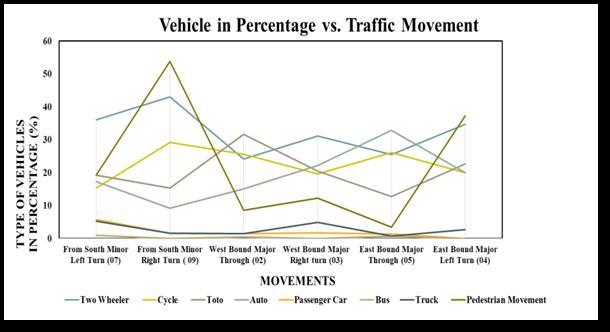
Chart -2:VehicleinPercentagevs.TrafficMovement

International Research Journal of Engineering and Technology (IRJET) e-ISSN: 2395-0056
Volume: 11 Issue: 09 | Sep 2024 www.irjet.net p-ISSN: 2395-0072
TrafficDataforthewhole5hoursobservationperiodhasbeenanalyzed.AlltheparameterslikeCriticalGap,Follow-up Time,havebeencalculatedandrepresentedinthefollowingtables:

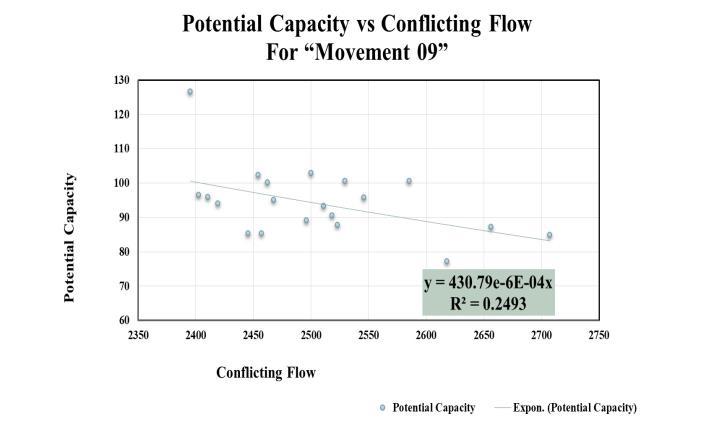
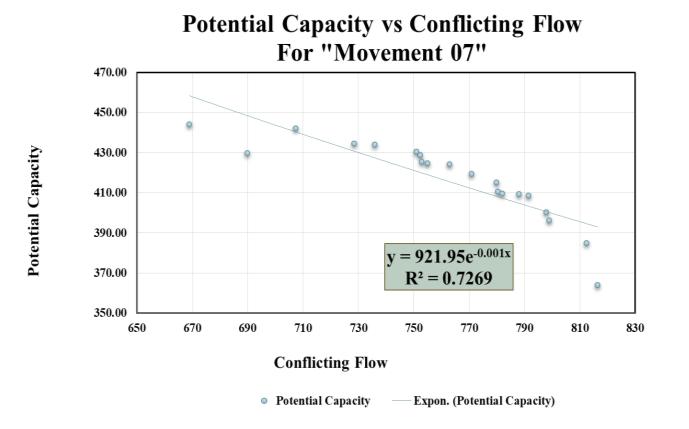

Chart -3 and Chart 4:ConflictingFlowrateandPotentialCapacityforMovement09and07respectively
Chart-3represented, i) Theconflictingflowrateincreasesasthepotentialcapacitydecreases. ii) Agraphisbeinggenerated usinganexponentialfunction iii) Theequationisbeingcreated.TheequationisY=430.79e (-6E – 0.4x) andalsoR2 valueis 0.2493 for minor street right turn “09”. iv) Similarly, from Chart- 4, the equation for minor street left turn “07” is also developed,Y=921.95e(0.001x) ,andtheR2valueis0.7238. v) Theequationformajorstreetrightturn“03”isY=149e(-6E-0.4x)and alsotheR2 valueis0.3608.
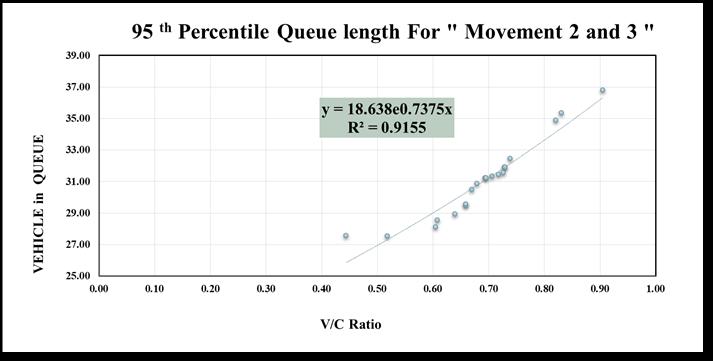
Chart -5:VolumeCapacityRatioandQueueLengthforMovement02and03
Chart-5represented, i) Asthevolume-to-capacityratioincreases,thequeuelengthalsoincreases. ii) Thevolume-to-capacity ratiobeginsbetween0.4and0.5,whilethequeuelengthstartsfromalmost27vehicles. iii) TheequationY=18.638e(0.7375x) representstherelationinbetweenthesetwoparametersandassociatedR2valueis0.9155. iv) Ithasalsobeendevelopedfor themovements“07”and“09”.Herethevolume/capacityratiostartsinbetween1.5to2andthequeuelengthsarevaryingin between14to15vehicles v) ThebestfitequationisY=12.244e(0.1185x) andtheR2 valueis0.8282.

International Research Journal of Engineering and Technology (IRJET) e-ISSN: 2395-0056
Volume: 11 Issue: 09 | Sep 2024 www.irjet.net p-ISSN: 2395-0072
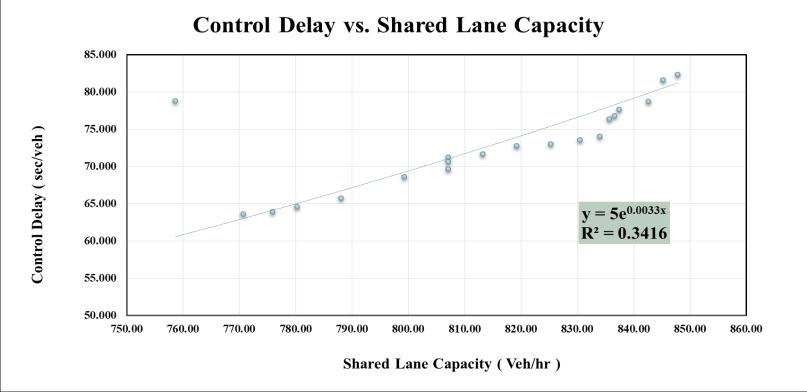

Chart -6:ControlDelayvs.SharedLaneCapacityfor“Movement07and09”
i) Here,itisobservedthatthecontroldelayrangesbetween60and85secondspervehicleformovements07and09. ii) Itisobservedthatthecontroldelaycanreachlevelsexceeding80secondsincertainsituations,forasharedlanecapacityof nearly850vehiclesperhour
iii) TheequationisY=5e(0.0033x)representstherelationinbetweencontroldelay(sec/veh)andSharedLaneCapacity(veh/hr) withR2value0.5992.Amorerobustmodelcouldbedevelopedwithanexpandeddatasetifthisstudyisextendedtoadditional intersections.
Based on the study conducted at Ghoruhata More, Uluberia, Howrah, West Bengal, the following conclusions are drawn: Approximately55%ofthetotalvolumeofvehiclesattheintersectioncomprises2-wheelersand3-wheelers.TheincreaseinErickshawmovementsignificantlyimpactstheoverallcapacityandlevelofserviceoftheseroads.Thestudyindicatesthatminor roadvehicleshaveaLevelofService(LOS)of"E,"withadelaytimerangingbetween35to45secondspervehicle,whilemajor roadvehicleshave a LOS of "F,"witha delaytimeofalmost80 secondsper vehicle.At the conclusion of the project,it is determinedthattheGhoruhataMoreintersectionprovidesaLevelofServicethatleadstounstableflow(LevelE)andforced flow(LevelF)conditions.Itisrecommendedthatthedevelopmentofmicro-simulationmodeling,coupledwithapedestrian, cyclist,andE-rickshawsafetyawarenessimprovementprogram,beimplementedtoenhancethecapacityandLevelofService ofthisintersection.
[1] HighwayCapacityManual,2010,andIndo-HCM,2012-17,TRB,NationalResearchCouncil,Washington,D.C.
[2] JohnM.Samuleset.al.,2002,‘NationalCooperativeHighwayResearchReport’,TRB,Washington,D.C.
[3] B.PrasantaKumarBhuyanandK.V.KrishnaRao,2011,‘ArticleonDefiningLevelofServiceCriteriaofUrbanStreets’in Indiancontext,formerResearchscholar,DepartmentofCivilEngineering,IndianInstituteofTechnologyBombay,Powai, Mumbai-400076,Maharashtra,India.
[4] VivekZalavadiyaret.al.,2009,‘InternationalJournalofResearchinEngineering,ScienceandManagement’,Volume-2, Issue-6,June-2019www.ijresm.com|ISSN(Online):2581-5792.
[5] SRajiet.al.,2020,‘LevelofServiceofUrbanandRuralRoads-ACasestudyinBhimavaram’,ShriVishnuEngineering CollegeforWomen(Autonomous),Vishnupur,Bhimavaram-534202,WestGodavariDist.,India.
[6] S. Venkatcharyulu et.al., 2020, ‘Traffic volume Analysis of Newly Developing semi- urban Road’ Assistant Professor GokarajuRangaRajuInstituteofEngineeringandTechnologyHyderabad,IndiaandResearchscholar,DepartmentofCivil Engineering,JNTUHCEH,Kukatpally,Hyderabad,India.Professor&HeadofcivilEngineering,GokarajuRangaRajuInstitute ofEngineeringandTechnologyHyderabad,India.
[7] MiraPatel,2014,‘InternationalJournalofAppliedEngineeringandTechnology’ISSN:2277-212X(Online)AnOpenAccess, OnlineInternationalJournalAvailableat2014Vol.4(1)January-March,pp.37-45/Patel.

International Research Journal of Engineering and Technology (IRJET) e-ISSN: 2395-0056
[8] N.G.Raval,Dr.P.J.Gundaliyaet.al.,2017,‘DevelopmentofRelationshipBetweenSaturationFlow&CapacityofMid-Block SectionofUrbanRoad-ACaseStudyofAhmedabadCity’.
[9] B.SomeswaraRao,T.Rambabu,2017,‘InternationalJournalofCivilEngineeringandTechnology’(IJCIET),Volume8,Issue 8,August2017,pp.181–190,ArticleID:IJCIET_08_08_020.
IndianHighwayCapacityManual(Indo-HCM),2012-2017,CentralRoadResearchInstitute,NewDelhi-110025.
Volume: 11 Issue: 09 | Sep 2024 www.irjet.net p-ISSN: 2395-0072 © 2024, IRJET | Impact Factor value: 8.315 | ISO 9001:2008
|