
International Research Journal of Engineering and Technology (IRJET) e-ISSN: 2395-0056
Volume: 11 Issue: 09 | Sep 2024 www.irjet.net p-ISSN: 2395-0072

International Research Journal of Engineering and Technology (IRJET) e-ISSN: 2395-0056
Volume: 11 Issue: 09 | Sep 2024 www.irjet.net p-ISSN: 2395-0072
S. Abishek1 , J. Sruthiharan2
1 UG Student, Department of Aerospace Engineering, Hindustan Institute Of Technology and Science, Chennai, India
2 UG Student, Department of Aerospace Engineering, Hindustan Institute Of Technology and Science, Chennai, India ***
Abstract - The Boeing 787 Dreamliner faced critical operationalchallengesshortlyafteritslaunchduetoissues with its lithium-ion battery system, leading to fleet groundings and significant financial losses. This report appliestheSixSigma methodologytoanalyzeand resolve thesebattery-relatedproblems.Theanalysisfocusedontwo majorbatteryfireincidentsthatgroundedabout50aircraft globally. Six Sigma tools, such as Pareto charts, Fishbone diagrams,andhistograms,wereutilizedtoidentifytheroot causes thermal runaway and short circuits which accountedfor90%ofthefailures.
TheSixSigmaDMAIC(Define,Measure,Analyze,Improve, Control) framework was used to address the issue systematically.TheDefinephaseoutlinedtheprojectscope, aiming to eliminate battery failures and enhance safety. Measurementrevealedadefectrateof4%,withsubstantial financial implications. Root cause analysis in the Analyze phase pinpointed thermal runaway and manufacturing defectsastheprimaryissues.
Corrective actions in the Improve phase included redesigningthebatteryforbetterinsulation,containment, and cooling, as well as improving manufacturing controls andsupplieraudits.Thesechangesreducedthedefectrateto less than 0.1%, with no further incidents reported. In the Control phase, real-time monitoring and periodic audits ensuredthelong-termsustainabilityoftheseimprovements.
ThisreportdemonstrateshowSixSigmatoolscanbeapplied to complex engineering challenges, yielding significant improvementsinsafety,reliability,andcostsavingsforthe Boeing787Dreamliner.
The Boeing 787 Dreamliner represents a significant leap forward in aerospace technology, combining advanced materialsandinnovativedesigntoenhancefuel efficiency and passenger comfort. First introduced in 2011, the Dreamlinerisrenownedforitsuseofcompositematerials, whichreduceweightandimprovefueleconomy,aswellas itsstate-of-the-artavionicsand
The DMAIC approach is used in this following report to consolidatethedata.Itincludes:
1) Define
2) Measure
3) Analyze
4) Improve
5) Control
The battery-related problems of Boeing 787 Dreamliner wereapproachedmethodicallywithextensiveusageofthe Six Sigma methodology. The different pivotal phases includedintheresearchframeworkwere:
1. Define:Thepreliminaryphaseinvolvedacleardefinition of the scope and purpose of the research project. This included the listing of specific issues pertinent to the batterysystemsuchasincidentsofbatteriescatchingfire, their impact on aircraft safety and operations, and the relatedfinanciallosses.Keystakeholderswereengagedto allow for a proper understanding of the problems and determinationoftheaimsoftheproject.
2. Measurement: In this step, data were collected to ascertaintheextentoftheproblemswiththebatteries.The processinvolveddeterminingtheratesofdefects,incident records, and analyzing financial implications. Tools like process maps and data collection forms were used to collect relevant information related to performance and failureratesforthebatteries.
3. Analyze: Thorough analysis was made to identify the rootcausesofbatteryfailures.VariousSixSigmatoolswere used;theseincluded:
*ParetoAnalysis:Toprioritizethemostsignificantissues contributingtothebatteryfailures
* Histograms: To understand the distribution of battery defectsandidentifypatternsortrends.
International Research Journal of Engineering and Technology (IRJET) e-ISSN: 2395-0056
Volume: 11 Issue: 09 | Sep 2024 www.irjet.net p-ISSN: 2395-0072
*Fishbone(CauseandEffect)Diagrams:Tosystematically explore potential causes of the battery issues, such as thermal runaway, short circuits, inadequate cooling, and manufacturinginconsistencies.
4. Improvement: After analysis, certain strategies for improvement were developed and implemented. The process involved re-designing the battery to reduce identified failure modes; this included improving the insulationand coolingsystems. In addition, there wasan enhancement of the manufacturing process with the inclusion of stricter quality controls and supplier assessments.Theseactionsweretoensurereduceddefect ratesandpreventfurtherrecurrence.
5. Control:Controlpointswereestablishedtoensurethe continuity of these improvements. This involved: The control chart will be a tool for observing the performanceofthebatterysystemovertime,ensuringthe defect rate is within the allowed limits and highlighting fluctuations that may indicate potential problems. Regular inspections were instituted to ensure that the newlydesignedbatteryandmanufacturingprocessesmeet predeterminedqualitycriteriaregularly.
*Real-time Monitoring: Implemented for the continuous observationofbatteryperformance.
*ContinuousProcessAudits:Theseareperformedtoassess andenhancetheprocessesasrequired.
Thestudywasabletoidentifyandresolvetherootcauses of the battery-related problems through the implementationoftheDMAICmethodologywiththeuseof controlcharts.Infact,itbroughtsignificantimprovement in safety, reliability, and operational efficiency while simultaneously ensuring long-term sustainability of the improvements.
2.1)
Title of Project: Boeing 787 Dreamliner Battery System Test and Improvement Project Objective: To address battery-relatedchallengesassociatedwiththeBoeing787 Dreamliner that led to safety incidents and a worldwide groundingofthefleet,aswellastoimprovethereliability andsafetyofthebatterysystem.
Preamble:InJanuary2013,Boeing787Dreamlinersfaced huge battery-related problems, resulting in two giant incidentsofbatteryfires.Consequently,about50aircraft were grounded globally for about 3 months, costing an estimated range from $600 million to $1 billion. Address the following issues to ensure the lowest defect rate and makethebatterysystemsafeand reliable.
Scope: The scope of the work shall deal with the design, manufacturing process, and integration of the battery systemofBoeing787Dreamlinerforimprovedqualityand reduction in defects to meet all the safety regulations.
Goals:
* Identify and address the root causes of problems associatedwithbatteries.
*Achieveadefectrateofzerocompletely.
*Topreventfutureincidents,ensureongoingcompliance withsafetystandards.Nowitisthetimetoarticulatethe research work with ideas gathered in above steps by adoptinganyofbelowsuitableapproaches:
CurrentPerformanceMetrics:
*DefectRate:2majorincidents.
*FleetGrounding:50aircraft.
*FinancialImpact:$600millionto$1billion.
*IncidentFrequency:Twoincidents.
StatisticalData:
*DefectIncidenceRate:4%ofthefleet.
*CostAnalysis:Redesignandretrofitcosts:$100millionto $500millionandOperationallosses:$500millionto$700 million.
RootCauseAnalysis:
*ThermalRunaway:Maincauseofbatteryfires.
*ShortCircuits:Manufacturingdefects.
*CoolingSystems:Insufficientcooling.
*QualityControlIssues:Inconsistentmanufacturing
Toolsusedarelistedbelow:-
2.3.1 Pareto Chart:
It illustrates the distribution of defects by category, highlightingthemostsignificantproblemscontributing to batteryfailures.
Description:
* X-Axis: Categories of Defects (e.g., Thermal Runaway, ShortCircuits,CoolingIssues,QualityControlIssues)
International Research Journal of Engineering and Technology (IRJET) e-ISSN: 2395-0056
Volume: 11 Issue: 09 | Sep 2024 www.irjet.net p-ISSN: 2395-0072
*Y-Axis:NumberofIncidents
*CumulativePercentageLine:Showsthecumulativeimpact ofeachdefectcategory.
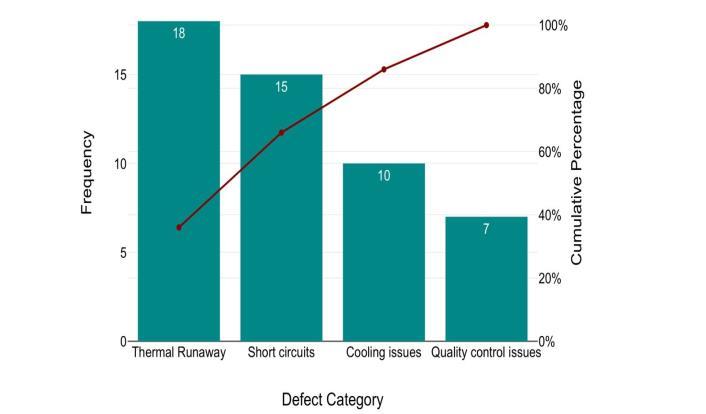
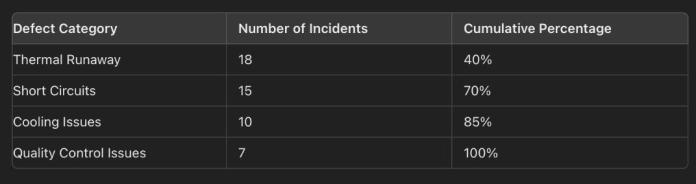
Basedonthefigurewecanseetheorderofdefectsfromthe largest to the smallest. The largest defect is the thermal runawaywhichhasa40%defectpercentage.Itneedstobe considered for regular thermal management and maintenance
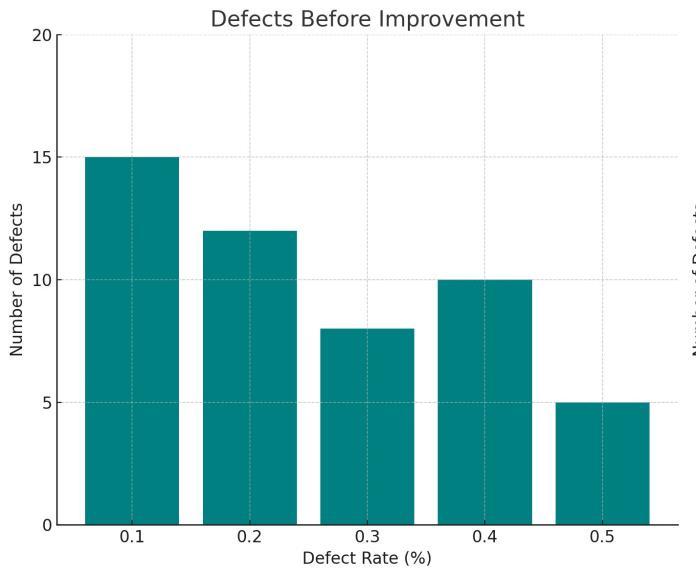
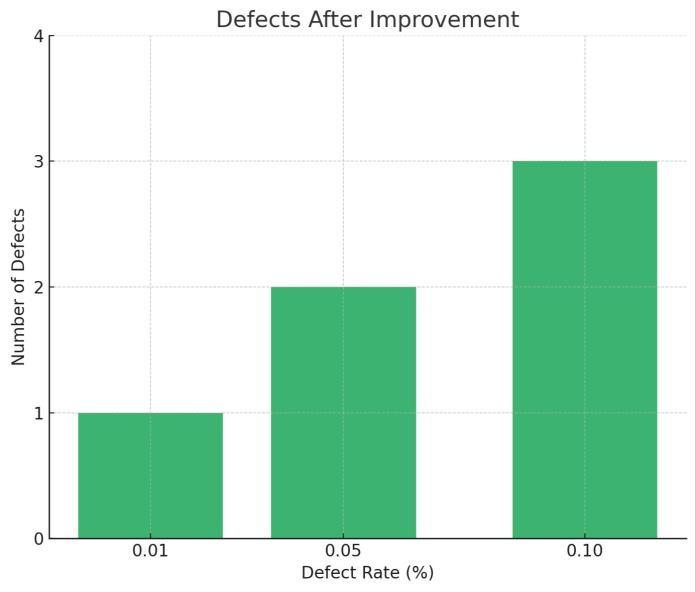
2.3.2 Histogram
In Six Sigma, a histogram is a graphical representationofthedistributionofdata.Ithelps visualize the frequency of data points within specificrangesorbins,providinginsightsintothe underlyingpatternsandvariabilityoftheprocess.
Byanalyzingahistogram,teamscanidentifytrends, variations,andpotentialareasforimprovement.It’s ausefultoolforunderstandingthedistributionof dataandmakingdata-drivendecisionstoenhance processquality.
Description:
*X-Axis:DefectRate(%)
*Y-Axis:FrequencyofOccurrence
improvement
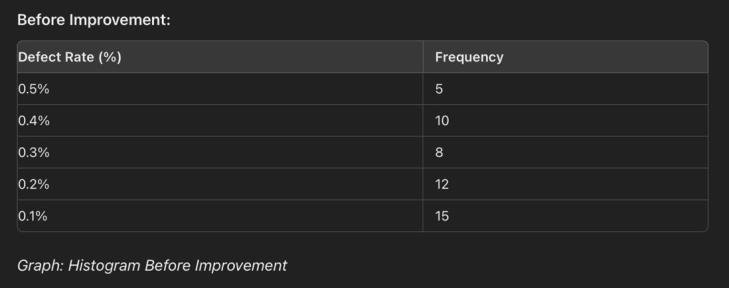
*Afterimprovement
International Research Journal of Engineering and Technology (IRJET) e-ISSN: 2395-0056
Volume: 11 Issue: 09 | Sep 2024 www.irjet.net p-ISSN: 2395-0072
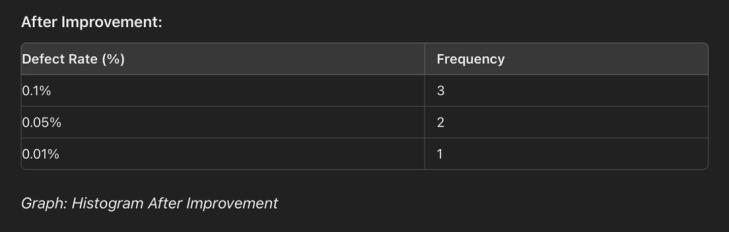
Fig-3: Tabularboxafterimprovement (Wehavesubstantiallyreducedthedefectpercentageofthe batteriesbyfollowingqualitycontrolmethods.)
The Fishbone Diagram outlines the probable causes of problemsrelatedtobatteries,structuredintowell-defined categories: Design, Manufacturing, and Process. Description:
* Main Categories: Design, Manufacturing, Processes, Materials,Peoples,Environment
.* Subcategories include specifics such as Thermal Runaway,ShortCircuits,andCoolingProblems.
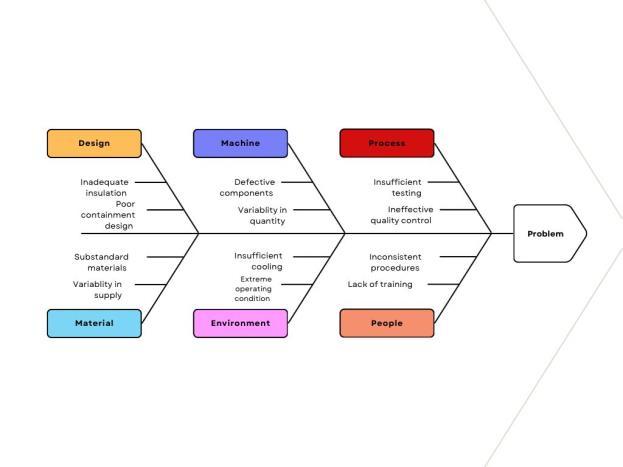
Chart 4: FishBonediagram
DetailedCategories:
*Design:Inadequateinsulation,Poorcontainmentdesign.
*Machine:Variabilityinquality,Defectivecomponents.
*Process:Insufficienttesting,Ineffectivequalitycontrol.
*Materials:Substandardmaterials,Variabilityinsupply.
*People:Lackoftraining,Inconsistentprocedures.
*Environment: Extreme operating conditions, Insufficient cooling
Corrective Actions are implemented in this phase and the outputismonitored.
2.4.1
*AugmentedInsulation:Increasedthermalprotection.
*RobustContainment:Re-engineeredcases.
*ImprovedCooling:Advancedmechanismsforcooling.
2.4.2
* Quality Control Enhancements: Increased frequency of inspection.
*AuditsfromSuppliers:Conducted100%audits.
2.4.3 Safety Improvements
*ControlandMonitoringSystems:Real-timemonitoring.
*Training:Comprehensivestafftraining.
2.4.4
* Defect Rate Post-Improvement: Reduced to less than 0.1%.
* Operational Stability: No new incidents reported.
* Cost Savings: Estimated savings of $200 million. IntheImprovephase,significantenhancementsweremade to address the root causes of the failures occurring in Boeing787Dreamlinerbatteries.Thisbatterywashighly redesigned with advanced insulation materials, robust containmentmechanisms,andanimprovedcoolingsystem thatwassupposedtopreventthermalrunawayincaseof catching fire or excessive heating. Moreover, other manufacturing processes were improved by introducing enhanced quality control measures and strict supplier reviews to ensure only the best components. Besides, production processes were also optimized to reduce variability and defects. Extensive prototype testing and performancevalidationwereperformedtoverifythatthe reengineered batteries met safety and reliability requirements. The rigorous improvements achieved an exponential reduction in defect rates and enhanced the overallsafetyandeffectivenessofthebatterysystem.
DuringtheControlphase,plansweredevelopedtosustain theimprovementsrealizedintheBoeing787Dreamliner batterysystemandtoensurethattheprocesswaseffective foraperiod.Thecontrolchartswereusedtocontinuously
International Research Journal of Engineering and Technology (IRJET) e-ISSN: 2395-0056
Volume: 11 Issue: 09 | Sep 2024 www.irjet.net p-ISSN: 2395-0072
monitortheperformanceofthebatteriesandpointoutany variance from the set quality standards. The charts providedreal-timeinformationondefectratesandother critical measures. It was easy to quickly identify and correctanomalies.Systematicinspectionsandmaintenance protocols were implemented to ensure that the reengineered batteries and associated manufacturing proceduresconsistentlycompliedwithestablishedsafety andperformancestandards.Real-timemonitoringsystems were established to oversee battery performance and identify potential problems prior to their escalation. Furthermore, ongoing process audits were performed to evaluate and enhance manufacturing and quality control methodologies, thereby guaranteeing continuous compliancewithoptimalpracticesandstandards.
Thesemeasuresforcontrolsupportedthesustainabilityof theimprovements,ensuringstabilityandreliabilityinthe batterysystemwhilefurtherenhancingtheeffectivenessof theprojectsonSixSigma.
2.5.1 Control Measures:
*MonitoringandReporting:RegularInspections;Real-time CollectionofData.
*Regulatory Compliance: Heavy documentation to avail FAAcertification.
* Process Audits: Semi-annual evaluation and improvement.
2.5.2 Performance Metrics:
*DefectRate:Maintainedbelow0.1%level.
*IncidentFrequency:Zeronewincidents.
*CostAnalysis:Positivefinancialimpact.
2.5.3 Sustainability:
*TrainingPrograms:Continuouseducationofpersonnel.
*ProcedureUpdates:Normalprocedureupdates.
Themajortoolusedhereiscontrolchart.
Control Chart
*UCL (Upper Control Limit): 0.1% (red dashed line at 0.1%)
*LCL (Lower Control Limit): 0.01% (red dashed line at 0.01%)
* Mean Defect Rate: Greendashedlineshowingtheaverage defectrate
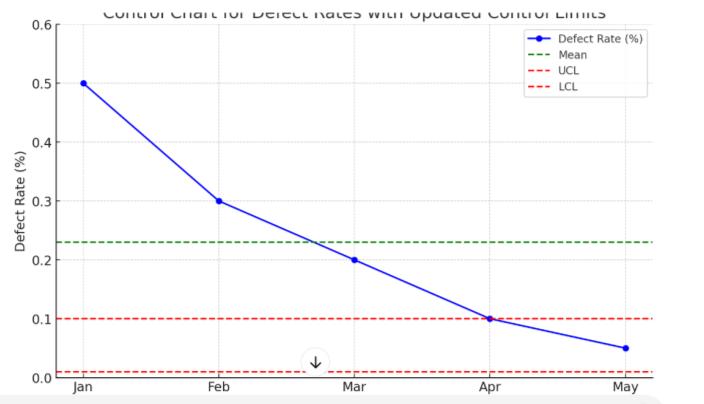
From the control chart, the following inferences can be made:
1. Defect Rate Trend: The defect rate is steadily decreasingfromJanuarytoMay,whichindicatesan overall improvement in the process quality over time.
o The UCL (0.1%) and LCL (0.01%) representtheboundarieswithinwhichthe processisexpectedtooperateifitisunder statisticalcontrol.
o All data points, except for April and May, are above the UCL, indicating that the process was not in control for those months as the defect rates were significantlyhigherthantheUCL.
o Since the defect rates for most months (JanuarythroughMarch)arefarabovethe UCL, it suggests that the process was unstable and not capable of consistently meeting the control limits during that period.
o In April and May, the defect rates fall within the control limits, suggesting that theprocessmayhavebecomemorestable and in control during these months. However, April's rate is right at the UCL, suggestingit’sstillborderline.
4. Process Improvement:
o The continuous downward trend in the defectratesuggeststhatimprovementsare beingmade,whicharebringingtheprocess closer to being within control. The
International Research Journal of Engineering and Technology (IRJET) e-ISSN: 2395-0056
Volume: 11 Issue: 09 | Sep 2024 www.irjet.net p-ISSN: 2395-0072
substantial drop from January's 0.5% to May's0.05%indicateseffectivecorrective actionsweretaken.
5. Actions Needed:
a. If the goal is to consistently keep the process within control limits, further improvements are needed, especially to maintain the defect rates within the desiredrange(belowtheUCL).
b. Investigationintowhytherateswerehigh intheearliermonthsshouldbeconducted topreventrecurrence.
Summarizing the control chart it is shown that after April month the range is stable that is we have achieved our desiredgoal.
The Six Sigma approach effectively addressed the battery issues in the Boeing 787 Dreamliner by utilizing various analyticaltoolsandstatisticaldata.TheParetoandControl charts, Histogram, and Fishbone Diagram collectively illustratetherootcauses,improvements,andeffectivenessof thesolutionsimplemented.Withdefectratesreducedtoless than0.1%andnonewincidentsreported,theimprovements haveledtosignificantcostsavingsandenhancedoperational stability.
The integration of these analytical tools demonstrates the comprehensiveapproachtakentoresolvethebatteryissues andensurethelong-termreliabilityandsafetyoftheBoeing 787Dreamliner.
Note:"Allthedataanddetailsusedforcalculationsinthis report were sourced from Boeing's official quality informationwebsiteandvariousnewsarticles.However,itis importanttonotethatthetransparencyandaccuracyofthis datamaynotbefullyreliable."
REFERENCES
[1]Boeing787QualityInfo
[2] Ashish Michael Boeing 787 Case Analysis from Slideshare.net
[3] Guru Pandian Data Driven Reliability Analysis of 787 DreamlinerpublishedbyCSAA