
International Research Journal of Engineering and Technology (IRJET) e-ISSN: 2395-0056
Volume: 11 Issue: 09 | Sep 2024 www.irjet.net p-ISSN: 2395-0072

International Research Journal of Engineering and Technology (IRJET) e-ISSN: 2395-0056
Volume: 11 Issue: 09 | Sep 2024 www.irjet.net p-ISSN: 2395-0072
Krishnanand
Dept. of Computer Science and Engineering
State University of New York at Buffalo Buffalo, New York , United States of America
Abstract - Making predictions in the stock market involves intricate strategies and relies heavily on an individual's experience. It can be challenging to predict stock prices and determine which companies are worth investing in due to the unpredictable nature of the stock market. However, the use of machine learning in this process has become increasingly prevalent in recent years. In the past few decades, the stock market's highly theoretical and speculative nature has been studied by capturing and utilizing repetitive methods. This research paper delves into utilizing cutting-edge machine-learning techniques forstockpriceprediction.Theaim istoheighten precision in forecasting and evaluate different methodologies. The proposed technique involves using various regressors, including the Decision Tree Regressor, Random Forest Regressor, XGB Regressor and others. We have used the standard indicator Root Mean Square Error (RMSE) to evaluate the models. A lower RMSE score indicates higher efficiency of the trained models. Additionally, the financial data comprises several factors, including data, volume, open and closing prices of stocks, etc. With these techniques, we aspire to acquire valuable insights into the stock market, enabling us to make more informedinvestmentdecisions.
The stock market is a wealth hub, with the equity capital marketsservingasaplatformfortradingcompanyshares. Participants who buy, sell, and exchange stocks are commonlyreferredtoastraders.Theequitymarketinthe United States is the largest in the world and remains the deepest, with high levels of liquidity and efficiency. In 2023,itrepresented42.5%ofthetotalglobalequitycapof $108.6 trillion, a significant increase from 2019's $85 trillion equity. The concept of Stock Market Prediction involves the effort to anticipate or estimate the upcoming value of a specific stock, a particular market segment, or the overall market. It is a process that typically entails analyzing various market indicators, such as market trends, historical data, and economic factors, to try and projectthefutureperformanceofthestockmarket.Thisis a crucial exercise for investors, as it aids them in making informeddecisionsaboutwhichstockstobuy,sell,orhold. Investors have always sought ways to enhance their investment performance, and for the longest time, this required years of practice and experience. However, for
newbies in the stock market, navigating its complexities andconstantlyshiftinglandscapecanprovedaunting.This often results in significant losses for beginners, so many people hesitate to invest in the stock market due to perceivedrisks.
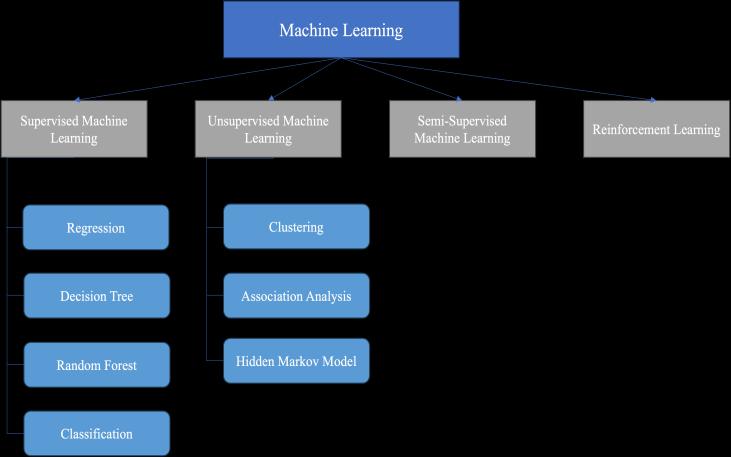
Historically, there have been two primary approaches to predicting stock market trends. The first method is a quantitative analysis that involves examining historical data such as opening and closing prices, fluctuations, and other key metrics. This data is then analyzed to identify patterns and trends that can be used to project future market movements. The second method is a qualitative analysis that involves examining external factors such as company and market profiles, socio-economic conditions, and political factors. This approach often involves sentimental analysis, which seeks to determine how investors feel about certain stocks and the market. Financial analysts and investors have used both methods for many years to try to gain insight into the complexand ever-changing world of the stock market. Nowadays, advanced intelligence techniques such as Artificial Intelligence and Machine Learning are used to predict stock prices. There are primarily four types of machine learning. SupervisedLearning UnsupervisedLearning Semi-SupervisedLearning ReinforcementLearning
Volume: 11 Issue: 09 | Sep 2024 www.irjet.net p-ISSN: 2395-0072
Our chosen approach in price prediction is called supervised learning. This method involves feeding the model with labelled datasets during the training phase. Through this process, the model becomes capable of recognizing complex patterns and making accurate predictions based on the information it has learned. Various fields such as artificial intelligence, data mining, andmachinelearningextensivelyutilizethisapproach.By utilizing supervised learning, we can ensure that our model is well-equipped to handle complex data sets and provide reliable results. The labeled dataset specifies that some of the inputs are already mapped to the outputs. In analyzing stock data, We have come across a few successful techniques, including neural networks, support vectormachines,andrandomforests..Neuralnetworks,in particular, are exceptionally useful, as they use deep learning architectures that can grasp intricate temporal patterns and dependencies within the data. Conversely, support vector machines excel at identifying nonlinear relationships and creating effective decision boundaries. Lastly,utilizingensemblemethodssuchasrandomforests can help handle feature interactions and improve generalization. Combining these various approaches can significantlyimprovetheaccuracyandpracticalityofstock marketanalysisasthehistoricalstockdataarenon–linear and huge, which are very time-consuming if predicted by humans. Hence, an efficient machine-learning method is requiredtodealwithavarietyofdata.
We sourced a dataset from Kaggle.com which provides comprehensive information on the performance of Tesla stocks.ThedatasetfeaturesseveralcolumnssuchasDate, Open, High, Low, Volume, and Close. Our proposed methodology involves the division of the dataset into two distinct parts: one for training the model and another for testing. This approach enables us to make a comparison between the predicted output and the actual price, which we then analyze for insights. As the dataset comprised continuous values, we opted to implement regressors to forecast the closing rate. To gauge the accuracy of our forecast, we utilized the standard method of measuring RootMeanSquareError(RSME).RSME calculatesthegap betweentheforecastedvaluesproducedbythemodeland theactualvalues.
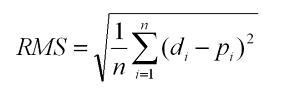
Fig - 2: FormulaforcalculatingRSME
Σ - ItrepresentstheSum.
di- This indicates the anticipated outcome for the ith
pi- Thisistheestimatedvaluefortheith
n - Itshowstheestimatedsamplesize.
When the RSME valueis lower,it isan indication that the modelsthathavebeentrainedarefunctioningwithahigh levelofefficiency.
The technique of Machine Learning Regression explores the relationship between variables and a dependent variable.ItisamethodforpredictivemodelinginMachine Learning.Thistechniquehelpsanalyzehowthedependent variable's value changes in response to an independent variable while other independent variables remain constant. The main goal is to create a line or curve that accuratelylinksallthedatapoints.
Supervised machine learning involves the use of linear regressionalgorithmthatcalculatesthelinearrelationship between a dependent variable and various independent features or variables. Its goal is to find the most efficient linearequationthatcanpredictthevalueofthedependent variable accurately. This equation can be graphed as a straight line, demonstrating the connection between two variables-oneindependentandonedependent.
The slope of the line signifies how the dependent variable shifts with each unit change in the independent variable.Tofindthebestfitfora pairofdatapoints,there areeasy-to-uselinearregressioncalculatorsthatutilizethe leastsquaremethod.
Thistoolisdesignedtoaidindecision-makinganduses a flowchartstructureresemblinga tree.Itanalysesobject features and trains a model within the tree structure to predict data that produces meaningful continuous output. Thisalgorithmtriestopredictacontinuoustargetvariable by cutting the feature variable into small zones and each willhaveaprediction.
Itisanensembletechniquethatusesmultipledecision trees, known as Aggregators, to perform both regression andclassificationtasks.Itstartsfromtherootofeachtree and follows splits based on variable outcomes until a leaf nodeisreached,producingaresult.
This algorithm is a strong tool that combines multiple weaker ones to improve results. The objective of this regressiontechniqueistooptimizethelossfunction,such as mean squared error or cross-entropy, based on past
International Research Journal of Engineering and Technology (IRJET) e-ISSN: 2395-0056
Volume: 11 Issue: 09 | Sep 2024 www.irjet.net p-ISSN: 2395-0072
attempts. It is constructed in stages, similar to other boosting methods, but it surpasses those methods by offering the ability to optimize any differential loss function.
This is a well-executed application of the gradientboosting algorithm, which is a type of ensemble learning approach. It involves utilizing base learners that may not perform well individually, but when their predictions are combined, the weaker ones are eliminated while the stronger ones add up to generate accurate final predictions.
Singh Sukhman et el [1] used different methods such as SVM, Regression, and Random Forest to analyze data. The methodology also includes combining two or more techniques to create hybrid models.. However, despite examining the primary factors affecting the stock price, a higherlevelofaccuracywasnotachieved.
Kumar I et el [2] has used various techniques including Support Vector Machine (SVM), Naive Bayes, K-Nearest Neighbor (KNN) for prediction, and Random Forest. Additionally,severalindicatorswereappliedtothedataset, which was collected from multiple sources. Among the algorithms used, Random Forest provided the most promisingresultsforthedatasets.
Misra Meghna et el [3] concudes that Linear regression shows the best result on applying Principal Component Analysis. The Linear Regression is most preferred as the binaryclassificationtechniqueutilizingtheRandomForest Approach yielded a high accuracy rate, resulting in increasedconfidencevalues..
Jasic et el [4] has applied ANN technique to predict daily stock market index returns. The dataset contains information on various global stocks in the market. The suggested method involves utilizing untreated data inputs to forecast short-term market index returns. The authors has evaluated the prediction accuracy of the neural network by comparing it to a benchmark linear auto-regressive model..
Liao,Z et el [5] implemented a time-effective natural networking model to find the relationship between numerous financial and economic variables. The model's forecasting performance was evaluated over an 18-year period, from December 19, 1990, to June 7, 2008, using Volatilityparameters.
Chong, E et el [6] have used deep learning networks to make predictions and analyze the market. The networks were able to extract features from a large set of raw data using high-frequency intraday stock returns as input data,
without relying on prior knowledge of predictions. The study used Principal Component Analysis, Autoencoder, andRestrictedBoltzmannMachinetomakepredictions.On the other hand the results suggests that the analysis generated additional information and insights in addition tothepredictionsmade.
Ingle,Vetel [7] haveutilizeddifferentTF-IDF featuresto predict the future prices of stocks. The dataset was made by gathering information from different news channels. The HMM model was introduced for calculating the probability of switching and contained values. From the models, it was observed that around 0.2 to 4 % of error was reported. However, an increase in the size of the dataset will also increase the size of the learning model. Hencethereisaprobabilityofadecreaseinerror.
Vats, P. et el [8] discussed techniques that go beyond just predicting stock prices and can be used to analyze financial markets. These techniques involve using quantitativeanalysisandoptimalstrategies.Inaddition,it was suggested that sentimental analysis is necessary for accurately predicting stock costs. In order to accomplish this goal, it is suggested that text mining and machine learning techniques be employed to monitor public interactionsondigitalfinancialtradingplatforms.
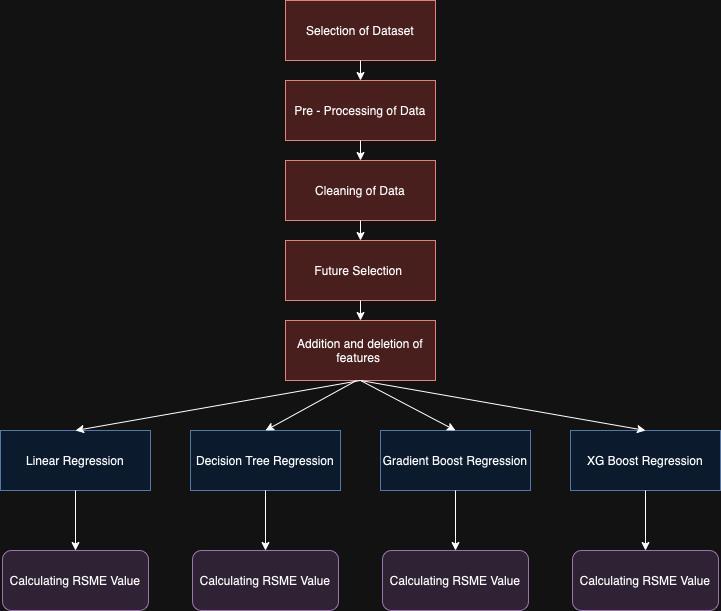
Our proposed methodology employs the powerful tool of Supervised machine learning to accurately forecast the closingrateofstockpricesasweareperformingthetaskof prediction hence the Regression is the perfect fit for the task. This research aims to revolutionize the way we predict stock prices and provide a more efficient and effective approach to handling their unpredictable and dynamicnature.Tohandlecomplexmultidimensionaldata arrays, we have utilized the widely-used Pandas and Numpy libraries. Initially, we retrieved the data from its designatedlocationandthoroughlyexaminedthecolumns: Date,Open,High,Low,Close,Volume,andAdjClose.
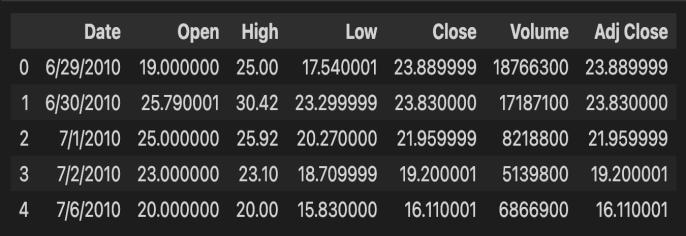
Afterdetectingmissingvalues,wediscoveredthatthedata had a shape of (1692,7). In order to clean the data and optimize our methodology, we meticulously checked the data types and made necessary changes. For example, we converted the Date column from float data type to datetime data type using the DateTime library. For
International Research Journal of Engineering and Technology (IRJET) e-ISSN: 2395-0056
Volume: 11 Issue: 09 | Sep 2024 www.irjet.net p-ISSN: 2395-0072
trainingourmodels,wehavedivideddatasetintotraining and test sets which contain (1500,7) and (192,7) rows, respectively. Additionally, we have changed the data type to day and month column to Date data type. In order to test the model and its efficiency, we have removed the Close and Adj Close columns and we have used the train test split function with train_size was set to 0.7 , test_size was made 0.3 , random_state was provided with value 0 whileshufflewasTrueinordertoimprovethelearningof therespectivemodels.
Thefutureselectionplaysa majorroleintheformationof themostefficientmachinelearningmodelshencetocheck the correlation of the selected columns, we have used Pearson Correlation, which targets to both reduction in computational cost of modelling and improve the performanceofthemodel.Therearetwodistincttypesof correlations.Whenthereisapositivecorrelationbetween two features, it means if there is increase in feature A, so does feature B. Likewise if feature A decreases, feature B willalsodecrease.Thetwofeaturesmoveinsyncandhave a linear relationship. On the other hand, a negative correlationmeansthatiffeatureAincreases,featureBwill decrease and vice versa. On applying this on our dataset, we have got open, high, low to be and volume to be on positive correlation while month day and on the negative correlation.
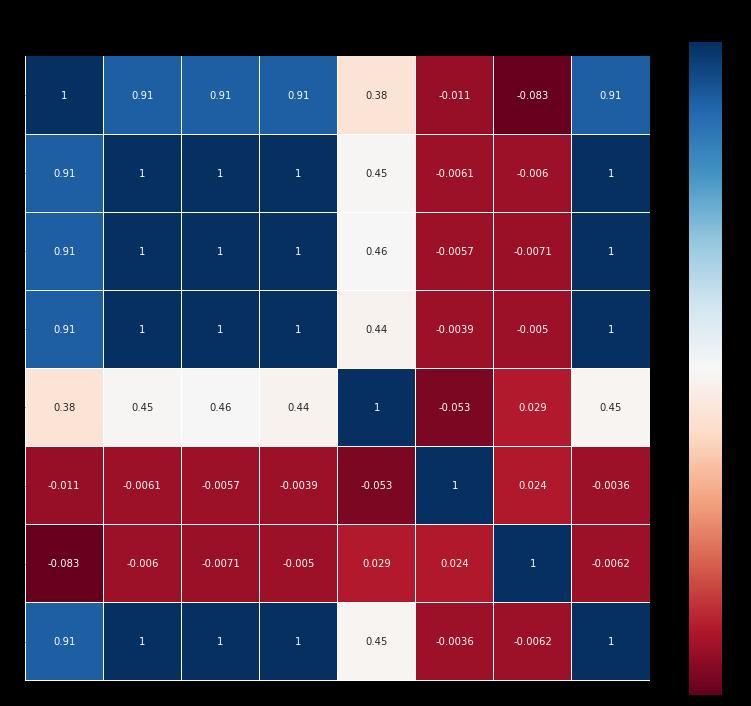
Fig -4: PearsonCorrelationoffeatures
We have used the Variance Threshold for future selection, which increases its robustness hence for this particular dataset,wehavechangedthethresholdvalueto0.8.Then, we have used the train data for training the machine learning model, particularly we have used Linear Regression, Decision Tree Regression, Gradient boost
Regression and XG Boost Regression techniques and used the testing data to check the efficiency of the model. In order to check the efficiency o the respective machine learning models RSME value is calculated and the model with the lowest RSME value is considered to be the most efficientmodeloftheusedmodels.
The RSME values play a significant role in determining the best model for a given dataset. Since the data is linear in nature, we have utilized the Regression method to predict the closing price in the dataset. Finally, the bestpredicted value is integrated with the primary dataset to visualize the predicted value. The RSME values play a significant role in determining the best model for a given dataset.Sincethedata islinearinnature,wehaveutilized the Regression method to predict the closing price in the dataset.Finally,thebest-predictedvalueisintegratedwith theprimarydatasettovisualizethepredictedvalue.
As an individual with investments, it is of utmost importance to remain vigilant regarding the stock market and the overall economy. The stock market is closely entwined witha country's economicprogressand hasthe potential to attract substantial investments. Investing in equitiescanbeacommendablewaytosupportcompanies andthegeneralpublic'sinterests.However,itiscriticalto possesstheabilitytopredictthefluctuationofstockprices and market trends to avoid significant losses and make knowledgeable decisions. By keeping a close watch on market trends and seeking guidance from experts in the field, investors can maximise their investments and reap
International Research Journal of Engineering and Technology (IRJET) e-ISSN: 2395-0056
the benefits. The various machine learning algorithm produceddifferentresults.
Table -1: RSMEvalueofrespectiveRegressionmethod
Sno. Machine Learning Approach Applied RSME
1. LinearRegression 1.6508
2. DecisionTreeRegression 2.7674
3. XGBoostRegression 2.7230
4. GradientBoostRegression 2.2354
[1]Singh,Sukhman,Tarun KumarMadan,J.Kumarand A. Singh.“StockMarketForecastingusingMachineLearning: Today and Tomorrow.” 2019 2nd International ConferenceonIntelligentComputing,Instrumentationand ControlTechnologies(ICICICT)1(2019):738-745.
[2] Kumar, I., Dogra, K., Utreja, C. and Yadav, P., 2018, April.Acomparativestudyofsupervisedmachinelearning algorithms for stock market trend prediction. In 2018 Second International Conference on Inventive CommunicationandComputationalTechnologies(ICICCT) (pp.1003-1007).IEEE.
[3]Misra,Meghna,AjayPrakashYadavandHarkiranKaur. “Stock Market Prediction using Machine Learning Algorithms: A Classification Study.” 2018 International ConferenceonRecentInnovationsinElectrical,Electronics & Communication Engineering (ICRIEECE) (2018): 24752478.
[4] Jasic, T., & Wood, D. (2004). The profitability of daily stock market indices trades based on neural network predictions: Case study for the S&P 500, the DAX, the TOPIX and the FTSE in the period 1965–1999. Applied FinancialEconomics14(4),285-297
[5]Liao,Z.,&Wang,J.(2010).Forecastingmodelofglobal stock index by stochastic time effective neural network. ExpertSystemswithApplications,37(1),834-841.
[6] Chong, E., Han, C., & Park, F. C. (2017). Deep learning networks for stock market analysis and prediction: Methodology, data representations, and case studies. ExpertSystemswithApplications,83,187-205.
[7] Ingle, V. and Deshmukh, S., 2016, August. Hidden Markov model implementation for prediction of stock prices with TF-IDF features. In Proceedings of the International Conference on Advances in Information CommunicationTechnology&Computing.
[8] Vats, P. and Samdani, K., 2019, March. Study on Machine Learning Techniques In Financial Markets. In 2019 IEEE International Conference on System, Computation, Automation and Networking (ICSCAN) (pp. 1-5).IEEE.
Volume: 11 Issue: 09 | Sep 2024 www.irjet.net p-ISSN: 2395-0072 © 2024, IRJET | Impact Factor value: 8.315 | ISO 9001:2008
|