
International Research Journal of Engineering and Technology (IRJET) e-ISSN:2395-0056
Volume: 11 Issue: 09 | Sep 2024 www.irjet.net p-ISSN:2395-0072

International Research Journal of Engineering and Technology (IRJET) e-ISSN:2395-0056
Volume: 11 Issue: 09 | Sep 2024 www.irjet.net p-ISSN:2395-0072
Mr. Anirudh Vaidison1, Mentor: Dr. Liam Yasin2
1Student, Oberoi International School, Maharashtra, India
2Department of Design Engineering at Imperial College London, London, England
Abstract - Thisresearchprojectexplorestheapplication of machine learning in assessing water quality through image recognition. The study leverages a diverse dataset of water samples collected from various sources across Mumbai, encompassing ponds, lakes, water outlets, and sewage points. Multiple parameters, including pH, conductivity, turbidity, and dissolved oxygen content, are examined in relation to the resulting HEX colour code, which serves as a visual representation of water quality. The central hypothesis posits that employing machine learning algorithms can reliably predict water safety based on these environmental parameters through image recognition of the colour gradient of the water samples. A systematic approach to data collection, standardisation, and logistic regression modeling has been employed. Results demonstrate the effectiveness of the logistic regression model in predicting water safety with an 85% accuracy rate, highlighting its potential for real-time water quality monitoring and risk assessment. Nevertheless, this study recognises its limitations and the need for further research to refine the model's predictive accuracy and address variations across different geographical regions and water sources. This research aims to contribute to the development of innovative approaches for water quality assessmentandtherefore,environmentalpreservation.
Key Words: Machine learning, water sources, pH, conductivity, turbidity, dissolved oxygen, HEX colour code, logistic regression
Clean water and adequate sanitation are vital for human existence, environmental sustainability, and economic development. However, the irresponsible disposal of industrialeffluencehasemergedasasignificantthreatto water quality in major world cities including Mumbai, a particularlyurbanisedregion.Thisresearchpaperaimsto investigate how pollutants measured through various water qualityparameterssuchaspH, turbidity, dissolved oxygen and conductivity affect the colour gradient of various water bodies and therefore, the overall water quality.
Whilewaterqualityusingtheaforementionedparameters (pH, conductivity, turbidity, and dissolved oxygen) has been tested and analysed in the past, this research paper looks into the feasibility of using image recognition and machinelearningasawayofpredictingwaterquality-in essence using technology to look at a very widely prevalent, yet fundamental community problem. The fusionofmachinelearningwithwaterqualityassessment has immense potential to make water safety evaluations morewidelyaccessible.
2.
The World Wildlife Fund (WWF) defines water pollution as “toxic substances entering water bodies such as lakes, rivers, oceans and so on, getting dissolved in them” (“Water Pollution”).
The most common reason of poor water quality is a consequence of human activity and consumption. In addition to irresponsible disposal of industrial effluence, there are numerous other factors that contribute to widespreadcontaminationofwater.
1. GlobalWarming:
Oneofthemostpredominantfactorsthatresultsinwater pollution is global warming. Rising global temperatures caused by increased cardon dioxide emissions heat the water,reducingitsoxygencontent.
2. Deforestation
Felling forests can exhaust water resources and generate organicdetrituswhichallowsharmfulmicroorganisms to develop and enter water ways. This leads to increased sediment and nutrient runoff into water bodies, further degrading water quality and allowing toxic substances to dissolveinthewater.
Volume: 11 Issue: 09 | Sep 2024 www.irjet.net
3. Garbageandfaecalwaterdumping
According to the United Nations (UN), more than 80% of the world's sewage ends up in seas and rivers untreated, meaning it cannot be recycled and put to better use (“UNEP - UN Environment Programme”). This contamination introduces pathogens and harmful chemicals into water sources, posing significant health riskstobothhumansandwildlife.
4. Maritimetrafficandfuelspillages
Fishing boats, tankers and cargos tend to dispose of plasticandotherpollutantsinthesea.Evenunintentional oil leakages are detrimental to marine life and water conservationefforts.
EffectofWaterPollutiononpH:
The safe range for human consumption of water lies between6.5and8.5onthepHscale[1].ThepHofwater, however, says more about the water than just its alkalinityoracidity.Itaffectsthetaste, odour,andcolour of water, making it a clear qualitative indicator of water quality. For example, water with a low pH indicates it is ‘acidic’ indicating the presence of heavy metals in the water that result in a more toxic sample (McGrane). Whereas, water with a high pH indicates it is ‘basic’ meaningtherearelessheavymetalsavailableresultingin anoveralllesstoxicsample,althoughtoohighapHcould also indicate the presence of bacteria and contaminated water(“MicrobialGrowthatLoworHighpH”).
Urban areas, such as Mumbai, contribute to water pollutionthroughrainwaterrunoffthatcarriespollutants on the surface such as oil, heavy metals, etc into water bodies. These metals are usually toxic to marine life and can alter the pH of the water posing a threat to humans. Water with acidic pH levels can contain iron, manganese, copper, lead and zinc elements that may in turn cause “health problems such as cancer, stroke, kidney disease, memory problems and high blood pressure” (Culligan Nation).
EffectofWaterPollutiononElectricalConductivity:
Electrical conductivity is a measure of how well a substance allows the flow of electric charges, typically in theformofelectronsorions.
Water pollution often introduces various charges into aquatic ecosystems. For example, agricultural runoff, industrial discharges, and urban runoff can contain ions like sodium, chloride, nitrate, sulfate, and heavy metal ions. These ions increase the electrical conductivity of
e-ISSN:2395-0056
p-ISSN:2395-0072
water as they are capable of carrying electrical charges [5].
Importantly, there is a relationship between pH and electrical conductivity. Heavy metals found in water pollution affect pH (discussed in earlier paragraphs), and consequently, these changes in pH can affect the dissociation of ions, potentially impacting electrical conductivity. Acidic conditions, for example, can lead to the release of hydrogen ions (H+), which can alter the conductivity.
Turbidity is a measure of the cloudiness or haziness of a fluid caused by the presence of suspended particles, which scatter and absorb light. Turbidity is an essential parameter in environmental and water quality monitoring, as it can indicate the presence of contaminantsorimpuritiesinaliquid[3].
Pollutants such as sediment, clay, organic matter, and debris can be introduced into water bodies through various sources, including erosion, industrial discharges, andsewagerunoff.Theseparticlescanincreaseturbidity, making the water appear cloudy or visibly spoilt. Industries that release effluents containing fine particles, chemicals, heavy metals, and other contaminants can significantly increase turbidity in nearby water bodies. Construction sites in Mumbai, are also the cause of such particlesenteringwaterbodies(Tembhekaretal.).
Apointtonoteisthatwithgreatersuspendedparticlesin awatersample,thereisahigherchanceoffindingmetals inthewater.Thisisnotablebecausewithahigheramount of suspended particles, the impurities containing ions allow electricity to be easily conducted. Hence, turbidity and electrical conductivity have a direct relationship, wherein,theincreaseinthevalueofonewillresultinthe increaseoftheother.
Dissolved oxygen content, often referred to as dissolved oxygen (DO), is a crucial water quality parameter that measures the concentration of oxygen gas (O2) that is presentinaliquid,typicallywater.
The dissolved oxygen content in water is usually measured in units such as milligrams per liter (mg/L) or parts per million (ppm). It is a critical factor in assessing the health and quality of aquatic ecosystems and is affected by various environmental factors, including temperature, pressure, and the presence of organic matterandpollutants. International Research Journal of Engineering and Technology (IRJET)
International Research Journal of Engineering and Technology (IRJET) e-ISSN:2395-0056
Volume: 11 Issue: 09 | Sep 2024 www.irjet.net p-ISSN:2395-0072
Water pollution, resulting from various contaminants such as organic matter, nutrients, toxins, and sediments from industrial, agricultural, and municipal sources, can significantly deplete dissolved oxygen (DO) levels in water samples (Britannica). This pollution disrupts the delicate balance of oxygen required for aquatic life, leading tooxygen-depleted "deadzones" inwaterbodies, reduced biodiversity, and altered nutrient cycling (US EPA). Pollution-induced eutrophication and increased biological oxygen demand (BOD) further exacerbate the problem, highlighting the critical need for effective pollution control measures and sustainable land use practices to protect the health of aquatic ecosystems and waterquality.
Turbidity and dissolved oxygen show an inverse relationship;asthevalueof turbidityincreases,thereare less oxygen gas molecules present in the water sample, viceversa[4].
1. pHMeter–pH:scalefrom1-14
2. Conductivity Meter - Electrical Conductivity: expressedinmicrosiemenspercentimeter(µS/cm).
3. Turbidimeter - Turbidity: expressed in NephelometricTurbidityUnits(NTU)orPartsPerMillion (PPM).
4. Nephelometer (DO meter) - Dissolved Oxygen: expressed in milligrams per liter (mg/L) or parts per million(ppm)
2.5 HOW PARAMETERS AFFECT HEX COLOUR
pH can influence the colour of water indirectly by affecting the solubility and speciation of certain substances.Forexample,waterwithalowpH(acidic)can cause the leaching of metals like iron and manganese, leadingtodiscolourationintheformofreddish-brownor yellowish tints. Extreme pH values can also impact the colour perception, making the water appear more or less translucent.
Conductivitymeasurestheconcentrationofionsinwater, mainly due to the presence of salts and minerals. While high conductivity can be indicative of dissolved ions, it does not influence the colour of the water directly. High ionconcentrationscan affectthe taste and odorof water, buttheydonotdefinethecolour.
Turbidity is a measure of the cloudiness or haziness of water due to suspended particles. The presence of suspendedparticlesinwatercanscatterandabsorblight, leadingtovariationsinthewater'sappearance. High turbidity can make water look cloudy or murky, whichcanaffecttheperceivedcolour.
The dissolved oxygen content does not have a direct impact on the colour of water. However, it can indirectly affect the health of aquatic ecosystems and thegrowth of algae or other organisms that may impart different colourstowater,suchasgreenorbrownhues.Changesin dissolved oxygen levels can influence the biological activity and the presence of organic matter in water, whichmayimpactthewater'soverallappearance.
Groundwater quality is assessed through various parameters such as turbidity, pH, dissolved oxygen (DO), and conductivity. Recent studies have also explored the application of machine learning in predicting and managing water quality. This literature review categorizes the selected research into these themes to provideacohesiveunderstandingofthetopic.
Turbidity, a measure of water clarity, is influenced by suspended particles and has significant implications for waterquality.Huey etal.[3]assessedturbidityalongside totalsuspendedsolids(TSS)andmicrobialconcentrations invariouswatersheds.Theirstudyfoundturbiditytobea reliable indicator of TSS and microbial pollution. Similarly, Argenal et al. [4] examined the impact of turbidity on dissolved oxygen levels, finding an inverse relationship between the two. High turbidity was associated with lower DO levels, indicating poorer water quality.
Another study [7] reinforced this inverse relationship, highlighting the detrimental effects of high turbidity on aquatic ecosystems. Rusydi [9] explored the correlation betweenelectricalconductivityandturbidityasindicators of water salinity. This study underscored the complexity of this relationship, emphasizing the need for precise turbidity measurements to accurately assess water quality.
The relationship between pH and DO is crucial for understanding aquatic ecosystem health. Zang et al. [2] investigated this relationship in aquaculture and nonaquaculture waters, finding significant positive correlationsbetweenpH,DO,andchlorophyllineutrophic nonaquaculturewaters.SeasonalvariationsinpHandDO were also studied in Asa Lake, Nigeria [6], revealing fluctuationsthatimpactfishdiversity.
In contrast, a study [8] in Vancouver's Salish Creek and Canyon Creek found no significant relationship between pH and DO concentrations, suggesting that this correlation may vary based on local environmental factors.
International Research Journal of Engineering and Technology (IRJET) e-ISSN:2395-0056
Volume: 11 Issue: 09 | Sep 2024 www.irjet.net p-ISSN:2395-0072
Conductivity, which measures the ability of water to conductelectricalcurrent,isinfluencedbythepresenceof inorganicdissolvedsolids. Dr.Abha Mathur[5] discussed how conductivity is determined by the geology of the surrounding area, with granite bedrock areas yielding lower conductivity and clay soils resulting in higher conductivity due to ionizing substances. The study also highlightedtheimpactofhumanactivities,suchassewage systemfailuresandoilspills,onconductivitylevels.
Assessment
Machinelearninghasemergedasapowerful toolforanalyzingandpredictingwaterquality.Onestudy [10] reviewed the application of machine learning in waterenvironmentresearch,highlightingitseffectiveness in improving water treatment, pollution control, and ecosystem management.Samietal.[11]usedanartificial neural network (ANN) model to predict DO levels in TaipeiCity'swatersources.Themodeldemonstratedhigh accuracy, showcasing the potential for real-time water qualitymonitoring.
In India, a study [12] utilized smartphone cameras and machine learning to assess water turbidity, resulting in a user-friendly app for rapid analysis. This innovation provides a practical solution to the challenge of unsafe water consumption. Silveira et al. [13] combined remote sensing and machine learning techniques to map suitable habitats for coral reefs, demonstrating the broader applicability of these technologies in environmental monitoring.
IndependentVariables:
The independent variables in this study are represented by the various water bodies from which water samples are procured. These water bodies serve as distinct categoriesorgroupsforthemachinelearningalgorithm's analysis. Within each category, the parameters, including pH,conductivity,turbidity, anddissolved oxygencontent, are measured and act as the features or characteristics used for the machine learning algorithm. These parameters are the focus of the study particularly concernedwiththeirrelationshiptotheHEXcolourcode, and the different water bodies, from different locations, are the independent variable. The machine learning algorithmemploysthesefeatureswithineachcategory to make predictions, classifications, or other data-driven decisions. This research design allows the algorithm to learn patterns and relationships within and between the water bodies and the parameters, enabling it to make predictions or assessments relevant to the study's objective of assessing water quality through image recognitionthroughsupervisedlearning.
DependentVariable:
Thedependentvariableinthisstudyisrepresentedbythe HEX colour code generated as a result of the various water samples procured, each of which is characterized bydifferent parametervalues. The hexcolourcode is the outputoroutcomeofinterestinthisresearch.Itisavisual representation that encapsulates the information derived from the measured parameters, including pH, conductivity,turbidity,anddissolvedoxygencontent.HEX codesareobtainedthroughacolourextractionalgorithm. The machine learning algorithm processes and quantifies these parameters to correlate with the HEX colour code, which serves as the dependent variable for analysis and assessment. The colour code reflects the comprehensive data transformation achieved by the algorithm, making it a key focus in understanding the relationships and patternsuncoveredinthestudy.
The utilization of a machine learning algorithm for predicting water safety based on the parameters of pH, conductivity, turbidity, and dissolved oxygen content, within various water bodies, will result in a reliable and efficient method for assessing water quality, as representedbythecorrespondingHEXcolourcode.
SupportingEvidence:
pH levels influence the colour of water indirectly by affecting the solubility and speciation of certain substances. For instance, low pH (acidic) can lead to the leachingofmetals like iron and manganese, which can result in reddishbrown or yellowish tints, thus affecting the HEX colour code. Conductivity measures ion concentration in water, impacting its taste and odor. High conductivity does not directly affect the HEX colour code, but it can indirectly influence water quality which in turn may have an effect on the colour composition of water. High ion concentrationscanalterwatercharacteristics,potentially impacting the HEX colour code. Turbidity, which affects waterclarityandappearance,candirectlyimpacttheHEX colour code. High turbidity can make water appear cloudy, leading to differences in the HEX colour code. While dissolved oxygen content does not directly affect the HEX colour code, it can impact the health of aquatic ecosystems,potentiallyinfluencingthegrowthofalgaeor other organisms that may impart different colours to water. This, in turn, may indirectly affect the HEX colour code.
The research employed a systematic approach to collect and analyse water samples from diverse sources across Mumbaianddevelopalogisticregressionmodelforwater qualityassessment.
International Research Journal of Engineering and Technology (IRJET) e-ISSN:2395-0056
Volume: 11 Issue: 09 | Sep 2024 www.irjet.net p-ISSN:2395-0072
1.SampleCollection:
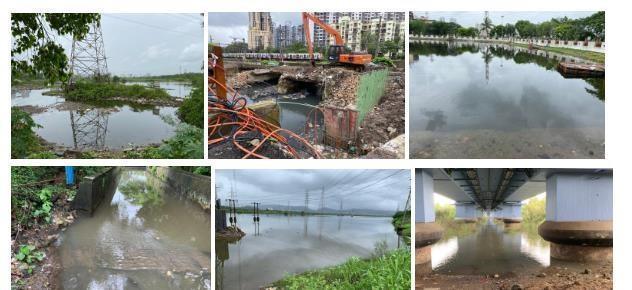
60 water samples were collected from various locations, including ponds, lakes, water outlets, and sewage sources throughoutMumbai, to ensurea broadspectrumof water sources and conditions. The collection was carried out using a bucket and a rope. Each sample was collected in individual sample cups to maintain sample integrity. 3-5 samplesofthesamesourcewerecollected.
2.DataCollection:
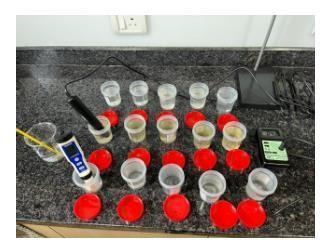
Multiple water quality parameters were measured for each collected sample. The IONIX 7 in 1 multiparameter instrument was used to gather data on pH, electrical conductivity, and turbidity. The Lutron Do-5509 Dissolved Oxygen Meter was used to collect data for dissolved oxygen. Both instruments were calibrated and standardized before use. Three trial measurements for eachsampleweretaken.
human decision on whether the water was potable or contaminated beyond saving. This was indicated by a binary factor: if the water sample’s data was within the standarddrinkingwaterranges,itwouldyieldapotability factor1;however,ifthedatareflecteddigitsoutsideofthe standard drinking water range, a potability factor 0 was attained. The two factors that were given highest priority were conductivity and turbidity since they showed a positive correlation, hence, the portability factor was based off of the standard drinking water values for these parameters
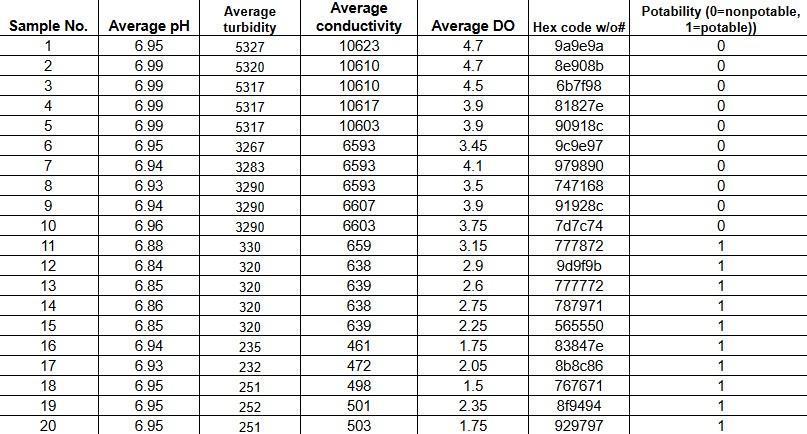
6.8: Digitisation of data and standardization of samples
Simultaneously, using the colour extraction algorithm the HEX code values and the respective intensity percentage of those HEX code values were extracted. These values wereaccountedforinthedatasheetastheyplayacrucial role in thedevelopmentof a supervised machine learning algorithm.Belowisan exampleofoneofthesamplesthat underwentthisprocess.
3. Data Analysis & Standardization: The collected data, including pH, conductivity, turbidity, and DO values, was transferredtoanExcelspreadsheetforanalysis.Thisdata was organized and averaged to prepare it for the development of a logistic regression model. Standard values for drinking water from secondary sources, mentioned in the background research, allowed for a

6.9: Colour extraction of water samples
International Research Journal of Engineering and Technology (IRJET) e-ISSN:2395-0056
Volume: 11 Issue: 09 | Sep 2024 www.irjet.net
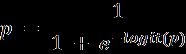
A logistic regression model was created using the processed data. Logistic regression is a type of regression analysis used to predict a dependent variable's outcome based on one or more independent variables. The dependent variable in logistic regression is binary, meaning it has only two possible outcomes (e.g., safe or unsafe water). Unlike linear regression, which predicts a continuous outcome, logistic regression predicts the probability of a certain class or event existing. In logistic regression, each feature (water quality parameter) is assignedacoefficient,whichrepresentsitscontributionto the logit (log-odds) of the outcome. The logit function is givenby:
Where p is the probability of the outcome being 1 (potable), istheintercept, arethecoefficientsfor the variables . The model coefficients ( were estimated using themaximumlikelihoodestimationmethod.Thisinvolves finding the values of the coefficients that maximize the likelihood of an accurate model as per standard drinking water conventions. In other words, reducing the number ofoutliers.
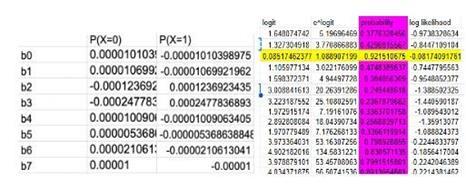
Fig. 9-10: Set values for parameters that yield probabilities
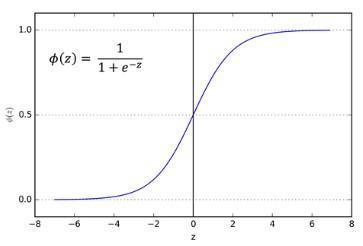
The predicted probability of water safety (p) is then obtainedbyapplyingthelogistic(sigmoid)functiontothe logit:
This converts the logit value into a probability ranging between 0 and 1. A threshold of 0.5 was used to classify the water as safe or unsafe. Probabilities greater than 0.5 wereclassifiedaspotable(1),whileprobabilitieslessthan 0.5wereclassifiedasnon-potable(0).
p-ISSN:2395-0072
5.ModelValidation:
Samples that show discrepancies between their probability(0or1)andtheirrespectivepotablefactorare highlightedinyellowandareconsideredanomaliesinthis model.Thedevelopedlogisticregressionmodelwastested andvalidatedusinganunknownsampleandpredictingits quality. An 85% accuracy rate was attained with the numericals of each parameter described above. These anomaliesarehighlightedinyellowasshowninFig.6.10.
The results of this study demonstrated the feasibility of employing a logistic regression model to assess water quality and predict potability based on water parameters within various sources. Water samples from a diverse range of locations across Mumbai, including ponds, lakes, water outlets, and sewage sources, were collected and analysed. Key water quality parameters, namely pH, conductivity, turbidity, and dissolved oxygen (DO), were measured using specialized instruments. Additionally, the HEX colour code values and their respective intensity percentages were extracted using a colour extraction algorithm, providing crucial information for the machine learningmodel.
Upon standardising the collected data and applying a binaryclassificationforpotability(1forsafe,0forunsafe), the logistic regression model was developed to predict watersafety. Themodel'sconstructioninvolvedassigning values to each parameter and calculating a logit value usingafundamentalformula.Theselogitvalueswerethen transformed into probabilities using the sigmoid function (logisticregressioncurve).
Throughout the data collection, where turbidity washigh conductivityreflectedthesameincreaseinmagnitude.For example, in sample 4 there was a conductivity of 5317
Volume: 11 Issue: 09 | Sep 2024 www.irjet.net
μs/cm while there was a turbidity of 10617 ppm. Contrastingly, in sample 31 there was a conductivity of 357 μs/cm with a proportionately low turbidity of 712 ppm. Regardless of the sample number, there is a direct proportion between the two parameters. This can be quantitativelybackedbydividingthetwovaluesresulting in a constant. For any sample, the average conductivity divided by the average turbidity results in the numerical constant ~2. This was one such prediction that the hypothesispredictedcorrectly.
In the model validation phase, the logistic regression model demonstrated an 85% accuracy rate in predicting thequalityof
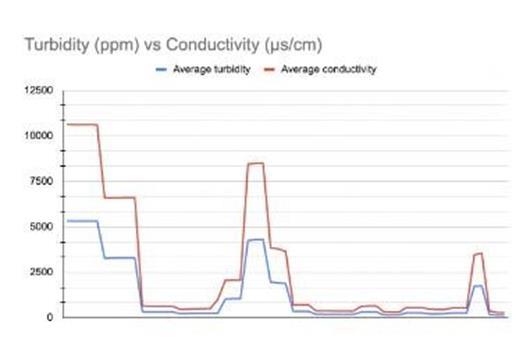
Fig. 7.1: Graph of turbidity vs conductivity
unknown water samples. There is some degree of error that mainly stems from the fact that the values of dissolved oxygen were inconsistent with that of turbidity andconductivity.
Insomeinstanceswheretheturbiditywasextremelyhigh, the dissolved oxygen was low. While in other instances where the turbidity was relatively low, the dissolved oxygenstayedlow.Thedissolvedoxygenshowednoclear relationship with any of the other such parameters, with the pH beinga dormant factorin thisstudy. This wasone such case wherein this mutually exclusive dissolved oxygen relationship was overlooked in the background information.
TheHEXcodecorrelationmayinduceunwarrantederrors due to the nature of obtaining the colour code. Since the methodinvolves extracting thecolour based onan image, factors such as lighting, camera quality, time of the day, and background colour may affect the colour code obtained. This definitely increases the uncertainty of the methodology, although the more quantitative aspects of the research had lesser uncertainty. For example, the pH, and dissolved oxygen had uncertainties of ± 0.01 which
p-ISSN:2395-0072
does not significantly affect the binary outcome of the potabilityofthesample.
The findings of this research highlight the potential of utilizing a supervised machine learning algorithm, specifically a logistic regression model, to assess water quality based on key water parameters and the corresponding HEX colour code. The study leveraged water samples from diverse sources to ensure a comprehensive evaluation of water quality. pH, conductivity, turbidity, and DO were identified as critical factorsforwaterqualityassessment,astheyinfluencethe HEX colour code. The observed relationships between these parameters and the HEX colour code align with previousresearchfindings,emphasizingtheimportanceof thesevariablesindeterminingwatersafety.
The logistic regression model's development and validation indicate its capability to accurately predict water potability, with an 85% accuracy rate in classifying samples as safe or unsafe. This outcome supports the hypothesis that utilizing a machinelearning algorithm for water quality assessment is an efficient and reliable method. The logistic regression model offers a practical tool for decision-makers and water quality managers to swiftly evaluate water safety in different locations and makeinformeddecisionstosafeguardpublichealth.
It is crucial to note that this research design and model rely on the relationships observed within the specific water bodies in Mumbai. Variations in geological and environmental conditions in other regions may influence theparameters'relationshipsdifferently.Hence,whilethis logistic regression model is promising for Mumbai, its generalizability to other locations necessitates further investigation.
Moreover, the findings of this study have practical implications for water quality management and public health. The ability to rapidly and accurately assess water safety using machine learning algorithms can facilitate timely actions to protect communities from potentially contaminated water sources. The implementation of this model in real-time monitoring and decision support systems could significantly enhance the safety of water supplies and improve the overall well-being of communities. Future research should focus on validating the model in diverse geographical and environmental contextstoascertainitsbroaderapplicability.
Whilewaterqualityusingtheaforementionedparameters (pH, conductivity, turbidity, and dissolved oxygen) has been tested and analysed in the past, this research paper looks into the feasibility of using image recognition and International Research Journal of Engineering and Technology (IRJET) e-ISSN:2395-0056
International Research Journal of Engineering and Technology (IRJET) e-ISSN:2395-0056
Volume: 11 Issue: 09 | Sep 2024 www.irjet.net p-ISSN:2395-0072
machinelearningasa way ofpredictingwaterquality -in essence using technology to look at a very widely prevalent, yet fundamental community problem. The fusion of machine learning with water qualityassessment has immense potential to make water safety evaluations morewidelyaccessible.
[1] USEPA,O.(2015,November4). DissolvedOxygen. Www.epa.gov.
https://www.epa.gov/caddis/dissolvedoxygen#:~:text=c olour%3A%20The%20colour%20of%20water
[2] ElectricalConductivityand ElectricalResistivityResistivity of Materials, Formula, Unit, Examples and FAQs. (n.d.). BYJUS. Retrieved July 31, 2024, from https://byjus.com/physics/resistivityvariousmaterials/#:~:text=Electrical%20Conductivity%2 0is%20an%20intrinsic%20property%20of%20a
[3] Huey,G.M.,&Meyer,M.L.(2010).Turbidityasan Indicator of Water Quality in Diverse Watersheds of the UpperPecosRiverBasin.Water,2(2),273–284. https://doi.org/10.3390/w2020273
[4] Kang, C., Lee, T. M., Wong, B., & Yoo, J. (2018). RelationshipBetweenSoilpHandDissolvedOxygen(DO) Concentration in Salish Creek and Canyon Creek. The Expedition, 8. https://ojs.library.ubc.ca/index.php/expedition/articl e/view/191429
[5] pH Measurement | Electrical Instrumentation Signals|ElectronicsTextbook.(n.d.). Www.allaboutcircuits.com. https://www.allaboutcircuits.com/textbook/directcurren t/chpt-9/ph-measurement/
[6] Mathur, A. (2018). Conductivity: Water Quality Assesment.InternationalJournalofEngineeringResearch &Technology,3(3). https://doi.org/10.17577/IJERTCONV3IS03028
[7] Pathak,A.K.,Sharma,M.,Katiyar,S.K.,Katiyar,S., & Nagar, P. K. (2020). Logistic regression analysis of environmental and other variables and incidences of tuberculosisinrespiratorypatients.ScientificReports, 10(1).https://doi.org/10.1038/s41598-020-79023-5
[8] WaterScienceSchool.(2019,October22).pHand Water | U.S. Geological Survey. Www.usgs.gov. https://www.usgs.gov/special-topics/waterscienceschool/science/ph-andwater#:~:text=Pollution%20can%20change%20a%20wa ter
[9] Taylor, M., Elliott, H. A., & Navitsky, L. O. (2018). Relationship between total dissolvedsolids and electrical conductivity in Marcellus hydraulic fracturing fluids. WaterScienceandTechnology,77(8),1998–2004. https://doi.org/10.2166/wst.2018.092
[10] Iberdrola. (2021). Water pollution: how to protectoursourceoflife.Iberdrola. https://www.iberdrola.com/sustainability/waterpollutio n
[11] Ltd,N.W.S.P.(n.d.).WhatareConductivityinthe water and its relationship with water TDS. Water Treatment Company in India - Buy STP, ETP, RO Plant | Netsol Water. https://www.netsolwater.com/whatareconductivity-in-the-water-and-the-relationshipbetweenconductivity-and-tds-in-thewater.php?blog=4555
[12] Zhu, M., Wang, J., Yang, X., Zhang, Y., Zhang, L., Ren,H.,Wu,B.,&Ye,L.(2022).Areviewoftheapplication of machine learning in water quality evaluation. EcoEnvironment & Health, 1(2). https://doi.org/10.1016/j.eehl.2022.06.001