
International Research Journal of Engineering and Technology (IRJET) e-ISSN: 2395-0056
Volume: 11 Issue: 09 | Sep 2024 www.irjet.net p-ISSN: 2395-0072


International Research Journal of Engineering and Technology (IRJET) e-ISSN: 2395-0056
Volume: 11 Issue: 09 | Sep 2024 www.irjet.net p-ISSN: 2395-0072
Mahesha Kumar Nayaka C1, Reena Williams2
1Post Graduate Student, Department of Management Studies, VVIET, Mysuru 2Professor, Department of Management Studies, VVIET, Mysuru
Abstract - This study examines the working capital management practices at industrywhereanautocomponent supplier specializing in window regulators, seating components, and restraint systems for car manufacturers. Working capital management, a crucial aspect of financial management, involves managing short-term assets and liabilities to ensure liquidity and operational efficiency. This studyemphasizesthesignificanceofbalancingriskandreturn to maintain liquidity and meet financial obligations in a dynamic business environment. The study investigates the impact of working capital management on profitability, requiring an in-depth understanding of business operations andtheapplicationofeffectivefinancialtoolsandtechniques. Key findings indicate that the company's working capital has improved over the five-year period from 2019 to 2024, suggesting a move towards a more satisfactory financial position.Recommendationsincludealigningcurrentliabilities with current assets, extending the average collection period, adopting a more liberal credit policy, and maintaining a minimal cash balance to avoid idle funds.
Key Words: Working Capital Management, Liquidity, Profitability,FinancialEfficiency
1.INTRODUCTION ( Size 11 , cambria font)
The automotive industry has revolutionized how people live and work. The first modern car appeared in 1895,andshortlyafter,thefirstcarswereshippedtoIndia. By the turn of the century, Mumbai had three cars, and withintenyears,thenumberhadrisento1,025.Thismarks the beginning of car history in India, focusing on the productionandmodernizationphasesofautomobiles.
TheoriginsofvehicleuseinIndiatraceback4,000 years with the first use of the wheel for transport. The arrivalofthePortugueseinChinainthemid-15thcentury led to significant innovations, including self-propelled wheels.Earlysteam-drivenenginemodelsappearedinthe 1600s, but it wasn't until 1893 that the first horseless carriage was developed by Charles and Frank Duryea in America. This vehicle marked the debut of America's first internal combustion engine car, followed by Henry Ford's firstexperimentalvehicleinthesameyear.
From2019to2024,India'sautomotiveindustryhas seensignificantgrowth,rankingasthefourthlargestmarket with3.99millionunitssoldin2018andbeingtheseventhlargest commercial vehicle producer. The market is dominatedbythetwo-wheelersegment,drivenbyagrowing
young and middle-class population, and automobile companiesareincreasinglyexploringruralmarkets.Exports grewby14.50%in2019andareexpectedtocontinueata CAGRof3.05%from2016to2026.BMWrecordedan11% sales growth in 2018. The industry attracted US$ 22.35 billioninFDIfromApril 2000toJune2019, supported by 100% FDI through the automatic route. Government initiatives include a 1.5 lakh tax deduction on EV loan interest, the FAME-2 scheme with a Rs10000 crore allocationfor2020-2022,andskippingBS-5emissionnorms toimplementBS-6by2020.Thesectorbenefitsfromlowcost skilled labor, affordable steel production, and robust R&Dcenters,withexpectationstoreach16.16-18.18trillion by2026.
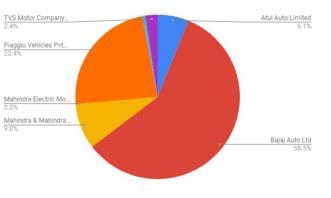
The automotive industry accounts for 7.5% of India's GDPandanoverwhelming49%ofmanufacturingGDPwitha major impact on the economic multiplier. In the manufacturingandservicesector,theautomotiveindustry employs8millionpeopledirectly,includingdealers.Aswe haveseenintheabovetablethesalesofallthevehiclesas beenreducedonlytheexportsarebeingincreased.
INDUSTRIES,anISO9001:2008certifiedcompany. They are one of the leading companies dealing the projection/spot welding, press components and plating of automobile parts. They are specialized in the field of automobiles parts. They take at most care for quality, quantityandtimelydelivery.
a. STRENGTHSOFAUTOCOMPONENTINDUSTRY
1. MarketLeadersinAutomotiveProducts
2. Technical&ExperiencedManpower
3. ISO9001:2008certifiedcompany

International Research Journal of Engineering and Technology (IRJET) e-ISSN: 2395-0056
Volume: 11 Issue: 09 | Sep 2024 www.irjet.net p-ISSN: 2395-0072
4. ImprovisedInfrastructure
5. Efficient Communication between the employees
6. Automated & Higher sophisticated machines
7. Capacitytomeethighercustomerdemand
8. Environmentallyfreefrompollution
9. Excellent Progress in its profits in comparisonwithpreviousyear
10. Obsessedwithquality
11. Qualitycontrolisprevalent.
b. WEAKNESSOFAUTOCOMPONENTINDUSTRY
1. Employee’shavetobemotivated
2. Coordination between the Top Managementandthesecondlevel
3. managementcanbeefficientlymanaged.
4. Doesn’thaveaseparateR&Dthisisvery essentialforfacingthe
5. company, competition and achieving the objectives.
6. Customerexpectationsareincreasingand difficulttosatisfytheir
7. requirements
8. Costinvolvementincompletingtheproject ishigh
c. OPPORTUNITIESOFAUTOCOMPONENTINDUSTRY
1. Market share expansion, Product Diversificationneedtobeundertaken
2. Companyhasfutureexpansionprogram
3. Capacitytomeethigherdemandandmeet opportunities
d. THREATSOFAUTOCOMPONENTINDUSTRY
1. Increasingbargainingpowersanddemand ofthelabourers
2. Manyotherfirmshaveenteredtheindustry whichmayeventuallyeat
3. awaythecompanyprospects
4. Lackofawarenessofvariedproductsof
Eljelly (2004): Identified the profitability-liquidity relationship,asmeasuredbythepresentsampleratioand cashgapinaveryAsiancountrybusiness.Thestudyfound thatthecashconversion period wasmoreimportantthan thepresentratiowhichaffectsprofitabilityasameasureof liquidity. the scale variable has been shown to possess a considerableeffectontheproductivityattheindustrylevel. The findings werestableat variousSaudi companies with significantliquiditymanagementconsequences.First,ithad been clear that the analysed Saudi sample had a negative relationshipbetweenindicatorsofprofitabilityandliquidity likecurrentratioandcashgap.
Lazaridis and Tryfonidis(2006): OntheAthenssecurities market it examined the connection between corporate profitability and WCM. The results indicate a negative relationship between indices of productivity and dealing capital, like receivables, debt and cash conversion cycles. Theyconcludedthatthebusinesswouldgenerateincomeby managing effectivelyevery portion ofthecashconversion process
ArindamGhosh (2007):Auniquearea ofresearchonthe cementindustryinIndiais"WorkingCapitalManagement," and its rent ability process and impact. The principal purposeofthisresearchistoassesstheefficiencyofcapital managementofselectedcementcompaniesinIndiaduring theamount1992to2001.it'stargetedforthisstudythat20 majorcementcompaniesinIndiahavea awfullylargeshareofIndiancementindustry
Samiloghu F and Demirgunes K(2008): The aim of this researchistoappearintothecompany'swelfare.Production companieslistedonthestudyperiodIstanbulexchange(ISE) were from 1989 to 2007. A statistical approach of multivariateanalysiswasemployedfortheanalysis.
Viranivarsha(2008): This is a study allotted within the CADILA COMPANY. The study is to look at financial performance and therefore the second is to look at the profitability trend and, lastly, to spot the assets operating model and evaluatetheliquiditypositionofthefirm.Two elegant analytical methods were wont to achieve those targets.
Kushwah, Mathur & ball(2009): Fivebigcementfirmsin. ACC,Ambuja,Grasim,Prism,andUltra-Tech.Primarydata wasusedforresearchpurposesasdataobtainedfromthe authorsfrom2007to2009
Baig Viqar Ali(2009): This studyaims to disclosesurvey results from selected agribusiness companies from diary cooperatives, MNC, private diary companies as part of a researchthesiscompletedinJuly2008onworkingcapital managementpractices.Furthermore,attemptsweremadeto recognizetheimpactofownership,governmentlegislation, managerialcontrolandculturalfactors.
Rao and Rao& Ramchandra(2010): Theaimofthisstudy is to research parameters of assets patterns and effectivenessandtheirutilizationintermsofthequantityof companieswithinthecottontextileindustryinIndia.they're theprimarydistinctindex,outputindex,consumptionindex andqualityindexforthethreeparameters.wewillsayon the average that the efficiency of assets isn't very satisfactorydespitehavingaPIrate.
Mohamad and Saad (2010): UsingtheBloombergdatabase of 172 listed companies, randomly selected from Bursa Malaysia'smainboardforafive-yearperiodfrom2003to 2007;applyingcorrelationandmultiplecorrelationanalysis, theyfoundarobustpositiverelationshipbetweencurrent assetsandtotalassetswithTobinQ,ROAandROI.Theyalso sentusresearchersfindingsandobservationsfromdifferent areas that they need performed within the same area for variouscountriesandenvironments.

International Research Journal of Engineering and Technology (IRJET) e-ISSN: 2395-0056
Volume: 11 Issue: 09 | Sep 2024 www.irjet.net p-ISSN: 2395-0072
Saswata Chatterjee (2010): Focuses on the worth of smooth and glued assets in effectively operating an enterprise.it'sarobusteffectonliquidityforprofitability.In industry,there'satrendobservedthatalmostallbusinesses arerisingprofitandlossmarginsasthisbehaviordecreases thedimensionsofcapitalrelativetorevenue.
Rahman Mohammad M.(2011): The researchers are focusedontheconnectionbetweenworkingandprofitability money. to guage the success of selected textile companies withinthemanagementofassets.Theconclusionfromthis studyfoundthatoverallgoodmanagementofsometextile companies and so most businesses have the benefit of effectiveassetsmanagement.
Dr KaddumiThair. A and Dr Ramadan Imad. Z (2011): The evaluation was conducted in 49 Jordanian companies listed on the Amman securities market, which discussed topics just like the effect of capital management on profitabilityincompaniestargetedfortheamount2005to 2009.Withthesupportoftwoseparatecompanies,theaim maybeachieved.Phaseoneforproductivityandtherefore theotherforachievementwithinthemanagementofcapital, namelyproxiesandfiveproxies,arecompletelyutilizedfor hisorherrespectivepurposes.
Dr Arbab Ahmed and Dr Matarneh Bashar(2012): Researchers bring with registration a method that's a awfullypowerfulstatisticaltoolforpredictingcapitalwithin thefieldofcapitalmanagement,whichallowsprojectionsto bemadeafteraveragerelationshiphasbeenstartedwithin thepast.Usedfortheneedsofvariouscomponentsandfor finaltesting
Dr Panigrahi Ashok Kumar(2012): Relationshipbetween capitalmanagementandprofitabilityACCCementCompany, the leading cement producer within the country for determining the impact of capital management on profitability 1999- 2000 to 2009-2010. This survey is predicatedonsecondarydata.
Ray Sarbapriya(2012): In manufacturing firms the connection between liquidity and productivity is studied. Over a period of 14 years, the author sampled 311 manufacturing firms and analyzed the impact of various variables.Thisstudyrevealsatransparentbadrelationship between the dimensions of assets and profitability of companies.
Joshi Lalitkumar and Ghosh Sudipta(2012): Theresearch was conducted during 2004-05 through 2008-09 at Cipla Ltd.Financialratioswereappliedtocalculatetheefficiency ofcapital,usingstatisticalandeconometrictechniques.The chosenratioshowedsatisfactoryresults,andatheliquidity and profitability were found to own a big negative relationship.
KaurHarsh. V and Singh Sukhdev(2013): Focusingoncash conversion quality, and defining the operating cycle. This study examines the link between capital acquisition and productivity that's calculated supported current asset incomeandaveragetotalassetincome.Theyallottedstudies withcompaniesregisteredatBSE200,cover19industries fortheamountfrom2000to2010.
Joseph Jisha(2014): Examines the work capital review performed at Ashok Leyland closely and shows that the company'sliquidityandprofitabilitystatusisunsatisfactory and desires improvement to satisfy its obligations in due course.
Madhavi. K(2014): Doanempiricalstudyoftheconnection between province 's liquidity situation and mill output. Inefficientmanagementofassetshasbeenobservedtoharm theprofitabilityandliquiditystatusofpapermills.
Gurumurthy. N and Reddy Jaychandra. K(2014): Four pharmaceutical companiesAPSPDCL,APEPDCL,APNPDCL and APDPDCL conducted a report on assets management andconcludedthatthisassetsmanagementframeworkisn't inlinewiththeexpectationsanddesirestobechanged.
Finance is often called as the lifeline of the business. Herealso, workingcapital ismuchmore crucial thanlong termassetsorliabilitiesandoccupieslargepartofdaytoday lifeofthemanger.Thatbeingthecasetheproblemforthis project work would be stated in generalized fashion as a follows: “This project tries to analyze present sources of working capital for the company, investment patterns, financialgrowthofNWCanditsreasonablenesswithgrowth ofsalesandhowtoimprovecapitalmanagementpoliciesof thecompany”.
Workingcapitalrequirementscannotoveremphasise.Each enterpriserequiresassets.Therequirementexiststhanksto thetimegapbetweenproducingandgeneratingcashfrom sales.Thesellingandrealizationofmoneyisinvolvedinan operationalprocess.There’sasuspensionbetweensalesand cashrealisation.Forthesubsequentpurposesworkcapitalis required.
1. Forrawmaterials,componentsandspareparts purchases.
2. Payingsalariesandbonuses.
3. Toincurregularandoverheadexpensesnamely diesel,electricityandofficeexpensesetc.
4. Businesstosatisfythesalescostsaspackagingetc.
5. ToprovideConsumerswithcreditfacilities.
6. Researchinprogresstokeepinventoriesofraw materials,shopsandsparepartsandfinishedstocks.
Thusthemanagementofcapitalisacrucialfeatureofany company.
1. Maintainjobcapitalataappropriateamount
2. Availabilityoflargeamountsoffundswhenrequired.
3. Thefirm'spositiononliquidity.
Theenterprise'soutputinworkingcapital,whetheritis risingordeclining

Volume: 11 Issue: 09 | Sep 2024 www.irjet.net p-ISSN: 2395-0072
4.1.NETWORKINGCAPITALFOR5YEARS
TABLE-1:Tableshowingnetworkingcapital
2019-20 1944.086 1006.817 937.269 100 2020-21 2114957 1062829 1052128 11225 2021-22 3057047 1431952 1625095 17338 2022-23 3520231 1188112 2332119 24883 2023-24 4095737 1744608 2351129 25084
Year
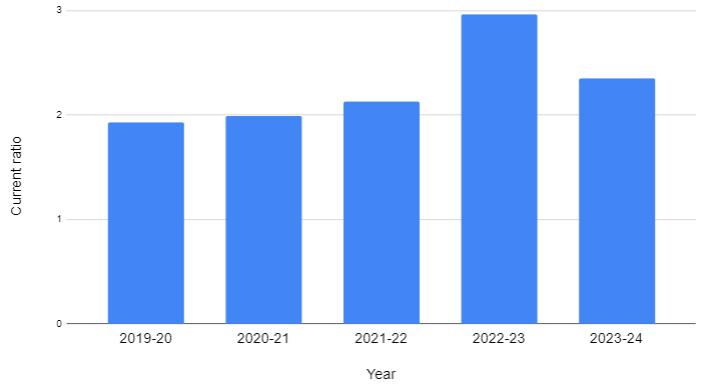
Fig 3: Current ratio vs. Year
Interpretation:
Theabovetableandgraphshowsthatcurrentratioforthe years 2019-2024 are 1.9, 1.99, 2.13, 2.96 and 2.35 respectively.Thisshowsthattherehasbeenaproportionate increaseinthecurrentassetsovercurrentliability.Bythis wecan interpret that the current ratio is moving towards satisfactoryposition.
4.3.LIQUIDRATIOORQUICKRATIOORACIDTEST RATIO
TABE-3:TableshowingQuickRatio
Interpretation:
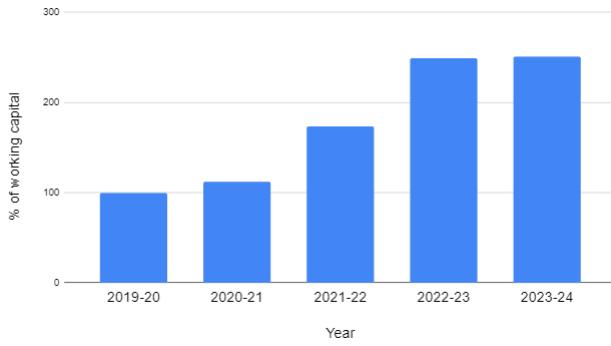
The above table and graph shows that Net Working Capital for the years 2019- 2024 are 100, 112.25, 173.38, 248.82 and 250.84 respectively. This shows that there has beenaproportionateincreaseinworkingcapital.Bythiswe caninterpret that the working capital is moving towards satisfactoryposition.
4.2.CURRENTRATIO:
TABLE-2:Tableshowingcurrentratio
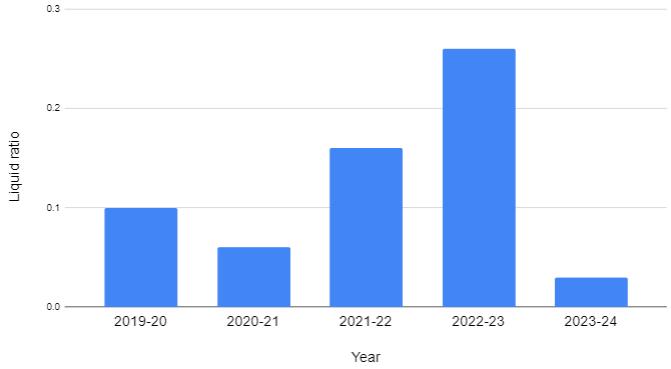
Fig 4: Liquid ratio vs. Year
Interpretation:
Theabovetableandgraphshowsthatliquidratioforthe years 2019-24 are 0.10, 0.06, 0.16, 0.26 and 0.03 respectively.Thisshowsthattherehasbeenaproportionate increaseintheliquidliabilitiesexcluding2024.Bythiswe can interpret that the liquid liabilities excluding 2018. By thiswecaninterpretthattheliquidratioispartlymoving towards Satisfactory position. Generally it is a non satisfactoryposition.

International Research Journal of Engineering and Technology (IRJET) e-ISSN: 2395-0056
Volume: 11 Issue: 09 | Sep 2024 www.irjet.net p-ISSN: 2395-0072
TABLE-4:TableshowingInventorytoWorkingCapital Ratio
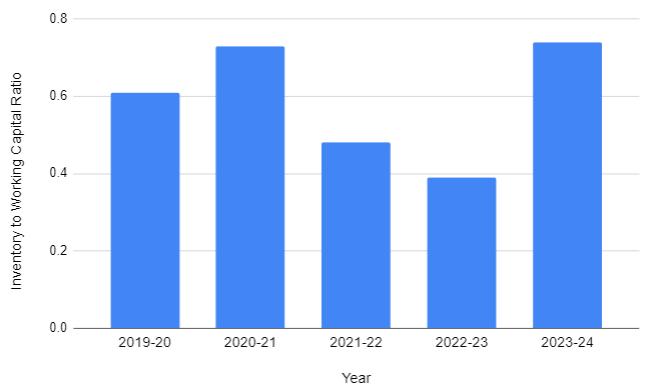
Interpretation:
Theabovetableandgraphshowstheratioofinventory overworkingcapitalfortheyear2014-2019.Theyare0.61, 0.73,0.48,0.39and0.74respectively.Thisshowsthatthe company’s inventory has been gradually increased from 2014-2019. By this wecan interpret that the inventory to workingcapitalratioinabetterposition.
4.5.CASHTURNOVERRATIO
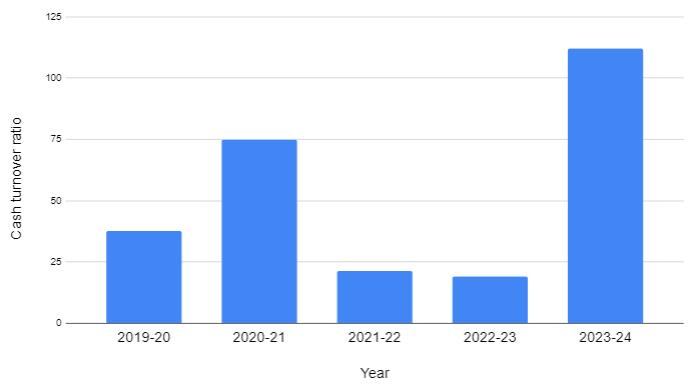
TABLE-5:Tableshowingcashturnoverratio
Interpretation:
Fromthetablebelowandgraphwecaninterpretthatthe cashresourcesoftheenterprisearenoteffectivelyutilized becauseitislessthanthestandardorideal cashturnover ratioi.e.,lessthan10%
4.6.WORKINGCAPITALTURNOVERRATIO:
TABLE-6:tableshowingworkingcapitalturnoverratio
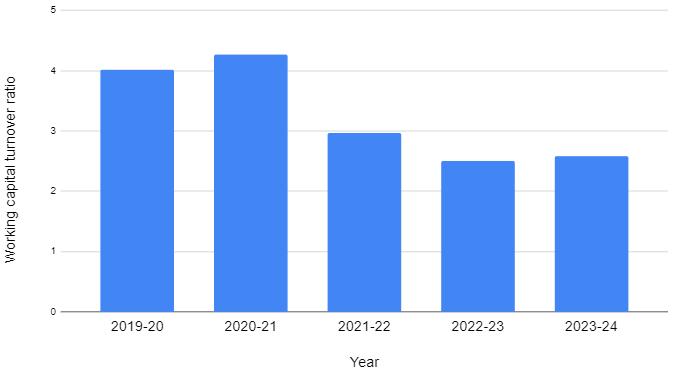
Interpretation:
The ratio indicates the efficient or inefficient utilizationoftheworkingcapitalofthecompany.Higherthe ratio, lower the investment in working capital and the greateraretheprofit.Lowertheratio,itwouldbeotherway. Fromtheabovetableandgraphwecaninterpretthatthere is an inefficiency of the management in the utilization of working capital. Since there in a gradual decrease in the workingcapitalturnoverratioofthecompanyfrom20192024i.e.,infrom4.01to2.58.

International Research Journal of Engineering and Technology (IRJET) e-ISSN: 2395-0056
Volume: 11 Issue: 09 | Sep 2024 www.irjet.net p-ISSN: 2395-0072
TABLE-7:TableshowingInventory
Year
Interpretation:
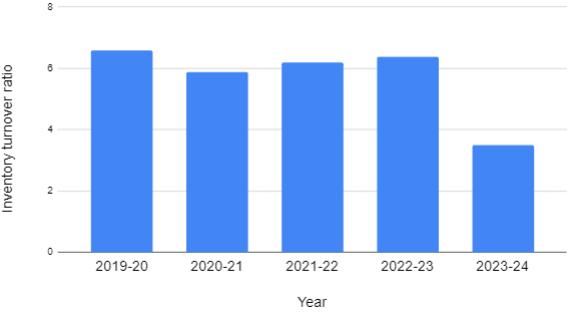
Fromtheabovetableandgraphwecananalyzesthatthe inventory turnover ratio is very less compared to that of previousyears.Bythiswecaninterpretthatthecompany’s sales from its stock is very less which indicates a nonsatisfactoryposition.
4.8.
TURNOVERRATIO:
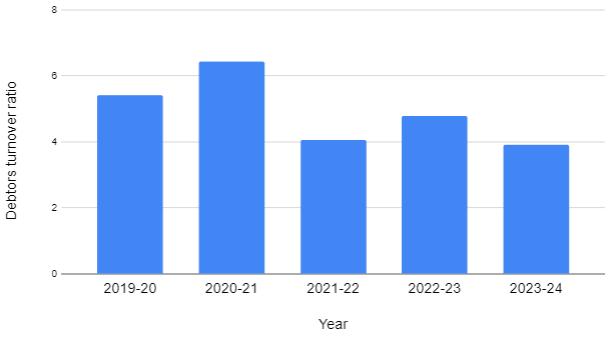
Interpretation:
From the above table and graph wecan interpret thatthedebtsutilizedbythecompanybecausethenumber of times the debt has been collected by the company in decreasing i.e. in 2019 it was 5.40 times and goes on decreasingto6.44,4.06,4.79wherein2021itwasonly3.91 times.
Interpretation:
Fromtheabovetableandgraphwecaninterpretthat the debts utilized by the company because the number of times the debt has been collected by the company in decreasing i.e. in 2019 it was 5.40 times and goes on decreasingto6.44,4.06,4.79wherein2021itwasonly3.91 times.
TABLE-9:tableshowingAveragedebtorscollection period
Fig
Interpretation:
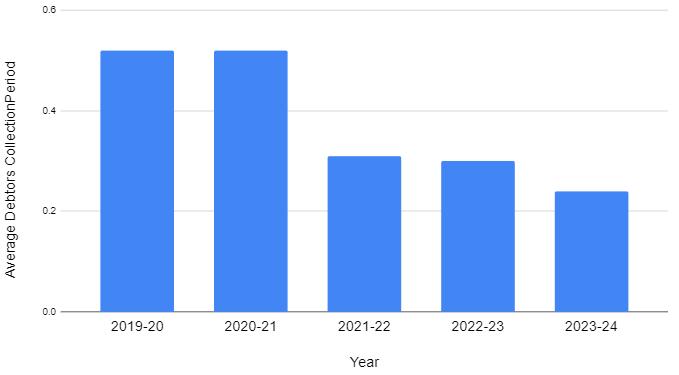
Fromtheabovetableandgraphwecaninterpretthatthe actualperiodofcreditallowedbythecompanyisdecreasing i.e.during2019itwas0.52whichshownthehighestperiod ofcreditallowedwhereasduringtheyear2024itis0.24i.e. thereisanefficientcreditcollectionperiodbythecompany.

International Research Journal of Engineering and Technology (IRJET) e-ISSN: 2395-0056
Volume: 11 Issue: 09 | Sep 2024 www.irjet.net p-ISSN: 2395-0072
TABLE-10:Tableshowing
Interpretation:
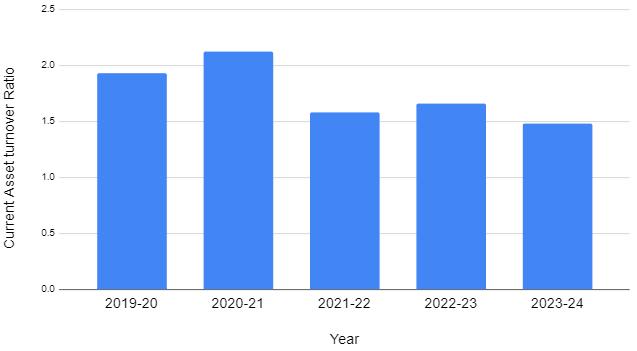
Thisratiodemonstrateshowcurrentassetsrelateto thesales.Thereisnotypicalcurrentassetturnoverratioan indicatorofbettercurrentassetutilization.Incomparison,a poorcurrentturnoverratioofassetsmeansthenewassets havenotbeenusedeffectively.
5.1. FINDINGSOFTHESTUDY
Managing working capital is a crucial aspect of financial management.Thisstudyexaminesvariousworkingcapital measurementratios,suchasthecurrentratio,quickratio, anddebtor'sturnover,from2019-2020to2023-24.Thekey findingsaresummarizedbelow:
The net working capital has proportionately increasedfrom100to250.84.
Thecurrentratioshowsaproportionalincreasein currentassetsovercurrentliabilities,withvaluesof 1.93,1.99,2.13,2.96,and2.35.
The company's inventory has been increasing annually,leadingtoagradualriseinworkingcapital from 2019-2024, indicating a better inventory to workingcapitalratio.
Thereisagradualdecreaseintheworkingcapital turnoverratio,from4.01to2.58.
Theinventoryturnoverratiowasmosteffectivein 2019at6.59,comparedto3.49in2024.
The company's debt collection efficiency has declined, with the debt collection rate dropping from5.4timesin2019to3.91timesin2024.
The percentage of cash utilized within current assetshasdecreasedsignificantlyfrom0.05to0.01.
Thesefindingshighlighttheneedforimprovedmanagement ofworkingcapitalcomponentstoenhanceoverallfinancial efficiency.
Thestudyaimstoanalyzetheworkingcapitalneeds ofanAutocomponentindustryfrom2019-20to2023-24, focusing on current ratio, quick ratio, debtors turnover, inventoryturnover,andworkingcapitalturnover.Thekey findingsandrecommendationsareasfollows:
Avoid unnecessary liabilities to achieve a current ratioof2:1,ensuringtheratioisequaltoorgreater thantheidealstandard.
Maintain current liabilities at a level equal to currentassets.
Improve inventory management by frequently calculatingstockquantitiesformajormaterialsand placing orders accordingly to avoid unnecessary fundblockageininventory.
Paymoreattentiontotheaveragecollectionperiod and adopt a strict credit policy to enhance debt recovery.
Takestepstoefficientlyrecoverdebts.
Minimizecashbalancestoavoididlefunds.
Exercisepropercontrolatalloperationallevelsto significantlyreducecosts.
Themarketingdepartmentshouldundertakepromotional activities to increase turnover, which will help reduce the investmentinfinishedstock,acomponentofinventory
Businessworkingcapitalreflectstheuseofshorttermfunds,essentialforbusinessoperations,andhelpsin understanding how well a company manages its finances. Effective Working Capital Management significantly influencesacompany'sprofitability,liquidity,andstructural health. The project study provides an overall view of the workingcapitalmanagementoperationsatAutocomponent industry. It reveals the current asset financing practices, utilizing accounting ratios to analyze the data, and offers specific insights into various areas of working capital management.Thestudyincludesananalysisoftheworking capital cycle, detailing the period of inventory for raw materials,theperiod of work inprogress,andthestorage period for finished goods. This comprehensive analysis

International Research Journal of Engineering and Technology (IRJET) e-ISSN: 2395-0056
highlights the efficiency and effectiveness of Auto componentindustry'workingcapitalmanagement.
Books Referred:
StoreyJohn-HumanResourceManagement–edition32007-London–RoutledgePublications.
RamaMurthyP-Production&OperationsManagement – Edition 2 – 2007-India – New Age International Publishers.
Kotler Philip -Marketing Management – edition 13 –2008–Canada-Barnes&NoblePublications.
AnnualReports– Autocomponentindustry
Websites Referred:
www.gooogle.com
www.wikipedia.org
Volume: 11 Issue: 09 | Sep 2024 www.irjet.net p-ISSN: 2395-0072 © 2024, IRJET | Impact Factor value: 8.315 | ISO 9001:2008
|