
International Research Journal of Engineering and Technology (IRJET) e-ISSN:2395-0056
Volume: 11 Issue: 09 | Sep 2024 www.irjet.net p-ISSN:2395-0072


International Research Journal of Engineering and Technology (IRJET) e-ISSN:2395-0056
Volume: 11 Issue: 09 | Sep 2024 www.irjet.net p-ISSN:2395-0072
Rahul Sahu1 , Swastika Patel1* , Prashant Kumar Sahu2, Gulab Verma2 , Sunil Kumar Patel1
1Assistant Professor, Dept. of Mechanical Engineering, Government Engineering College, Raipur, Chhattisgarh, India PIN-492015
2 Assistant Professor, Dept. of Mechanical Engineering, Government College of Engineering, Jagdalpur, Chhattisgarh, India PIN-494001
Abstract
Traditional modes of transportation, such as rail, road, water, and air, often exhibit limitations in terms of speed, cost, or a combination thereof. In contrast, Hyperloop emerges as a revolutionary transport mode, promising both rapid transit and cost-effectiveness for passengers and cargo. Unlike conventional systems, Hyperloop adopts an open design concept akin to Linux, featuring a lowpressure tube through which capsules travel at varying speeds. These capsules, supported by air cushioning and aerodynamic lift, are propelled by magnetic linear accelerators stationed at intervals along the tube. Hyperloop stations can be situated at tube ends or along its length, facilitating convenient passenger embarkation and disembarkation. This study delves into the feasibility of the high-speed Hyperloop system, considering factors such as high-pressure differentials, shock waves, boundary layer dynamics, blockage ratios, Kantrowitz limits, and various drag forces, including wave, pressure, and viscous drag. The project aims to determine the maximum achievable velocity of Hyperloop pods under diverse parameters such as initial velocity, tube pressure, and pod length while assessing the inherent drag forces in its operation. Utilizing computational fluid dynamics, velocity and pressure profiles along the Hyperloop length will be analyzed, providing valuable insights into its aerodynamic performance.
Keywords: Aerodynamic, Analysis, Computational, Hyperloop,Velocity.
1. Introduction
The Hyperloop is a conceptual transportation system that reduces costs and travel times compared to California’s existing high-speed rail project. It was introduced as an open-source design for public review and further development by Elon Musk and a team of engineersfromTeslaMotorsandSpaceXinAugust2013. Unlike conventional high-speed rail systems, the Hyperloop replaces rails with a tube that encloses the passengerpodinapartialvacuumandsuspendsitonair bearings. Propulsion is achieved using linear electromagnetic accelerators installed along the tube,
with the system elevated on concrete columns to maintain a relatively straight path. Since Hyperloop operates at transonic speeds and in a low-pressure environment, thetube design becomes morevital asthe air flowing over the pod length is subjected to a lower cross-sectionalarea.Thiscausesairflowoverthepodto accelerate,whichcanevenreachalowsupersonicrange andleadtothedevelopmentofshockwaves.
Further, there is a continuous increase in the boundary layer thickness along the length of the hyperloop pod, i.e., a constant reduction in mass flow rate over the pod length, which may cause choked flow or can lead to boundarylayersensitivity. Totreat this,thereshould be sufficienttubecross-sectionalareatocompensateforthe reduction in mass flow rate. This will bring us to the concept of the blockage ratio and the Krantrowitz limit. Theblockageratioistheratiooftheareaavailabletothe fluidtobypassthepodtothetotalcross-sectionalareaof the tube. It has been found by t. Kim said that no shock waveisdevelopedforablockageratioof0.25,andonlya weak form of shock wave generates a blockage ratio of 0.5. thus, the blockage ratio is a single parameter that will affect all the factors in consideration, like shock wave boundary layer sensitivity and the maximum achievablevelocityofthepod.
Musk’s original Hyperloop proposal includes individual high-levelanalysesofmany significant subsystems,such as the pod compression system, elevated support structure, and propulsion system. While this demon states the basic viability of the concept, it does not address significant interdisciplinary couplings inherent in the Hyperloop system. Ultimately, we need to apply a designoptimizationofHyperlooptoreduceconstruction costs,operational costs,andtravel time.Performingthis broaderoptimizationisoutsidethescopeofthiswork.It is reserved for future investigation since adding all of thiswill resultinsignificant growthin thecomplexityof theHyperloopmodel.
This project is an effort to study the feasibility of Hyperloop as a fifth mode of transportation that is very

International Research Journal of Engineering and Technology (IRJET) e-ISSN:2395-0056
Volume: 11 Issue: 09 | Sep 2024 www.irjet.net p-ISSN:2395-0072
fast as well as aims to be the least expensive mode of transportation.Astandardtransportationsystemusually worksinanopenambientpressurecondition,sothereis a lot of drag on the vehicle force while running at its cruise speed. Since Hyperloop aims to work near a vacuumorshallowpressure,muchpowerissaved.
Thisprojectaimstodesignthetubethatwillprovidethe maximum velocity of the pod while keeping the other effects like shock wave, boundary layer sensitivity, and dragonthepodofhyperloopaslowaspossible.
1.2. Objectives
Theobjectiveoftheprojectis:-
1. To design the tube of the Hyperloop to get the maximumspeedoftraveloftheHyperlooppod.
2.Tominimizetheeffectofboundarylayersensitivityby providingsufficientbypassarea.
3. To study the velocity and pressure profile during the operationoftheHyperloop.
4.Toeliminate/reducethegenerationofshockwaves
5.Tochecktheflowregimesatthetimeofoperation.
6. Try to reduce the total drag force on the Hyperloop pod.
7. Avoid blocking or choking the bypassing air while travelingthroughthepod.
The Hyperloop concept, introduced by Elon Musk in 2013 through the Alpha paper, proposed a high-speed transportation system using low-pressure tubes to propel capsules. SpaceX launched the Hyperloop Pod Competition in 2015 to develop subscale prototypes, with MIT's team unveiling the first scaled prototype in 2016 and demonstrating the first vacuum run in 2017. Since then, several companies in North America and Europe have been advancing Hyperloop technology for commercial use. However, deployment timelines remain uncertain as funding, regulation, and a full understanding of the system’s impacts are still being addressed.
Figure 1 illustrates the worldwide presence of Hyperloop-related activities, including R&D testing facilities (green circles), completed major studies (yellowtriangles),andproposedHyperlooproutes(blue diamonds). These markers span North America, Europe, Asia,andpartsoftheMiddleEast,highlightingtheglobal interestinHyperlooptechnology.

This literature review examines the progress of the Hyperloopconceptfromitsinceptiontoitscurrentstate, drawing on 34 reports and supplemented by interviews with Hyperloop technology companies. Although Elon Musk’s Alpha Paper sparked initial interest, he is no longerinvolved,andvariousfirmshavesincerefinedthe concept. The review highlights how some original ideas, like the elevated structure, have remained consistent while others have evolved as commercialization efforts advance. However, publicly accessible information on the pods and sensitive components is limited due to competitionamongdevelopers.
Much of the available literature focuses on potential Hyperloop corridors, showcasing superior travel times, enhanced user experience, and economic benefits compared to other transport modes. Interviews with developersconfirmviablesolutionsfor critical elements such as levitation, propulsion, and guidance, but many crucial questions remain unanswered. While companies plan to license the technology, no firm investor commitmentstorouteplanninghavebeenmadeyet.
Computational fluid dynamics (CFD) is a branch of fluid mechanics that uses numerical methods and data structures to solve fluid flow problems. It relies on computers to simulate fluid interactions with surfaces under defined boundary conditions. High-speed supercomputersareoftennecessaryforsolvingcomplex issues like transonic or turbulent flows. Continuous research enhances CFD software, improving accuracy and speed. Initial validation is typically done through wind tunnel experiments or comparison with analytical models,whilefull-scaletesting,likeflighttests,provides finalvalidation.
CFD is widely used in aerospace, weather simulation, environmental engineering, industrial design, biological engineering,andcombustionanalysis.Thefoundationof most CFD problems lies in the Navier-Stokes equations, whichdescribesingle-phasefluidflows.Theseequations

International Research Journal of Engineering and Technology (IRJET) e-ISSN:2395-0056
Volume: 11 Issue: 09 | Sep 2024 www.irjet.net p-ISSN:2395-0072
can be simplified for specific scenarios, leading to the Euler or potential equations. CFD methodologies vary based on the physical assumptions of the problem, such as single-phase flow, non-reacting fluids, and whether compressibility, thermal radiation, or gravity are considered.
3.1. Software Used
In this project, three software are used, namely ANSYS: This software provides a means for creating CAD files, i.e., modeling and analyzing the model under various circumstances and engineering fields. We used this softwaretoanalyzeourmodel.
CATIA V5: - This is all-in-one software, i.e., it contains CAD, CAM, and Analysis tools. We created our model usingthissoftware.
MATLAB: - It is the renowned mathematical software thatcontainsallthetoolswecomeacrossinengineering mathematics. We plotted the conclusion graph with the helpofthissoftware.
3.2. Necessity of Considering Aerodynamic Factors Inside the Tube
The upper and lower sides of a Hyperloop pod function like converging-diverging nozzles, a well-studied scenarioinwindtunnelsandsupersonicjetinlets.Asthe bypassareaaroundthepodnarrows,airflowaccelerates, reaching Mach 1 at the throat (the narrowest point). If the pod's speed exceeds this, the airflow becomes choked, leading to a sharp rise in pressure drag and the formationofshockwavesatthepod'stail.Anincreasein pressuredragwillreducetheefficiencyofthehyperloop system. To cure that problem, we need to pay attention to the factors which could give rise to such conditions. Figure 2 depicts a side view of an aerospace vehicle designedforHyperlooptransportation.

Flow regime (or flow pattern) is information on the flowstructureorflowdistributionofthefluidrelative totheotherfluid.
3.4.
In gas dynamics, the Kantrowitz limit refers to a theoreticalconceptdescribingchokedflowatsupersonic or near supersonic velocities. The principle behind the Kantrowitz limit: it is the maximum amount of contraction a flow can experience before the flow chokes, and the flow speed can no longer be increased above this limit, independent of changes in upstream or downstreampressure.
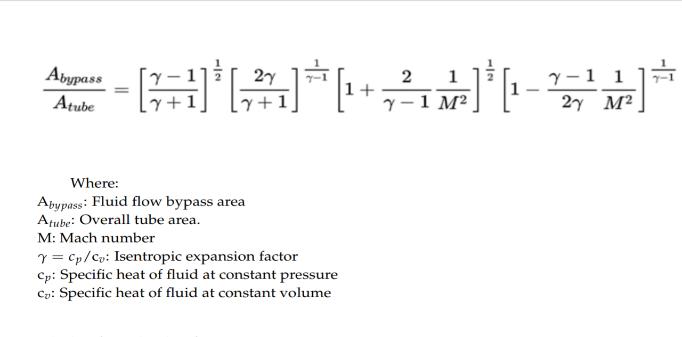
For a pod traveling through a tube, the Kantrowitz limit is given as the ratio of tube area to bypass area both around the outside of the pod and through any air bypasscompressor:
The given equation is plotted, and it has been seen that thearearatioincreaseswithanincreaseinthe
This entails the flow behavior inside the hyperloop tube will change from laminar to turbulent at a particular point on the surface of the hyperloop pod.
pod’sMachnumber,buttoalimitofM=1.Afterthesonic velocity is attained, the area ratio decreases but with a moresignificantslopethanwithwhichitwasincreasing.

International Research Journal of Engineering and Technology (IRJET) e-ISSN:2395-0056
Volume: 11 Issue: 09 | Sep 2024 www.irjet.net

The Kantrowitz limit, therefore, acts as a "speed limit"for a given ratio of tube area and pod area, there is a maximum speed that the pod can travel before flow around the pod chokes and air resistance sharply increases. To break through the speed limit set by the Kantrowitzlimit,therearetwopossibleapproaches:
The first method is to increase the tube's radial size to providemorebypassarea forfluidflowaroundthepod, delayingtheonsetofchoking.However,thisapproachis impractical as it bulges the tube and compromises systemstability.
The second, more feasible method involves installing a turbinefan(compressor)atthefrontofthepodtodraw influidandexpelitfromtherear.Thisreducesthefluid flowingaroundthepod,effectivelyincreasingthebypass areaandminimizingfar-fieldimpacts.
A boundary layer forms when a fluid flows over a boundary surface, where the effects of viscosity dominate
Boundary layer formation reduces the bypass area, increasing the likelihood of flow choking. A larger tube would be required to prevent this, raising material and constructioncosts.
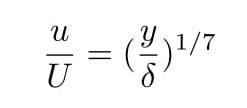
This accounts for the reduction in bypass area due to a boundarylayerofarbitrarydisplacementthicknessSince Re > 500,000, the boundary layer is assumed turbulent withavelocityprofile-
Using this boundary velocity profile, the displacement thickness of the boundary layer is derived using a similaritysolutionthatgivesthefollowing-
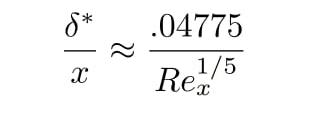
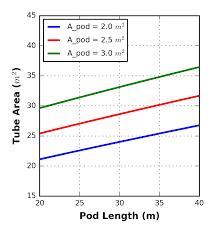
Figure 4 explores the relationship between boundary layerthicknessandtubeareainHyperloopdesign.
p-ISSN:2395-0072
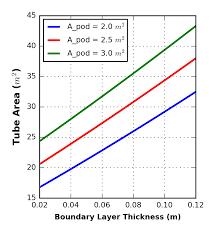
Figure (b) shows the tube area variation with the pod's length. This sensitiveness is called boundary layer sensitivity. To minimize material cost, tube area and, hence, the length of the pod must be smaller. The equationandgraphinFigure(b)showhowsensitivethe tube area is with respect to pod length. On the other hand,ifwewanttoincreasethepodpassengercapacity, then instead of increasing the pod diameter (after a specific limit),anincreaseinthelengthofthepodisthe better option because the rate of increase of the tube cross-sectional area also increases with pod crosssectional area. This relationship exists because more bypass area is lost as the pod radius rises for a given displacement boundary layer thickness, so an optimum designshouldconsiderboundarylayersenilityandtubepodarea relation toavoidcrossing the Kantrowitz limit. Figure5investigatestherelationshipbetweenboundary layerthicknessandtubeareainthecontextofHyperloop design.

International Research Journal of Engineering and Technology (IRJET) e-ISSN:2395-0056
Volume: 11 Issue: 09 | Sep 2024 www.irjet.net p-ISSN:2395-0072
3.6. Remedies for Shock Wave
1.Largertubediameter
2.Smallercross-sectionalareaforthepod.
3.RunninghyperloopatlowerMachnumber.
4. Aerodynamic design of the nose of the pod as it will streamlinetheflow.
5.Bypassusingcompressorinpod.
3.7. Origin of Various Drag Forces in Hyperloop
1. Pressure loss due to shock waves will create wave drag(justabovethepod).
2.Surfaceroughness(ATPODSURFACE)leadstoviscous drag.
3. Boundary layer separation (AT THE END OF POD LENGTH)leadstoariseinpressuredrag.
Remedies to reduce Drag
1.Roughingofnose
2.Reducetubepressure
3.Removing/reducingtail
4.Reducethecross-sectionalareaofthepod
5.HigherReynoldsnumber
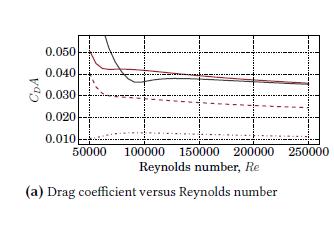
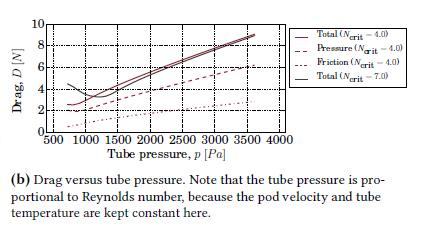
Figure6(a):DragCoefficientversusReynoldsNumber and(b)DragversusTubePressure[7]
Drag force decreases as the tube pressure is decreased. Thisisbecausethevalueofskinfrictiondragsdecreases because of a reduction in rubbing action between the fluid flow and the pod. As the value of the Reynolds number increases, the flow becomes turbulent. It has beenfound thatturbulenceflowcandelaytheboundary layer separation much better than the laminar flow and willultimatelyreducethewavedragonthepod.
4.1. Specifications
Poddiameter=2.23m
Podlength=10m
Tubelength=30m
Pod shape – Article by Yadawendra Singh and KamyarMehran[7]
Airpressureinsidetube=100Pa
Podspeed=900km/hr(250m/s)and
based on sound velocity 343m/s, Mpod = 0.72886

4.2.


International Research Journal of Engineering and Technology (IRJET) e-ISSN:2395-0056
Volume: 11 Issue: 09 | Sep 2024 www.irjet.net p-ISSN:2395-0072
4.3. Boundary Conditions
• Inletspeed–250m/s
• Tubeinsidepressure–100Pa
• PodandTubewall–Noslipcondition
4.4. Tube diameter – 9.735m
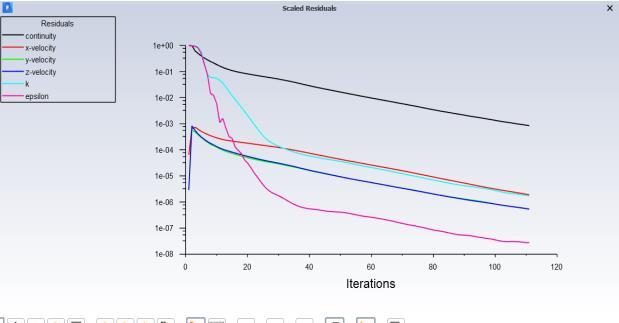
Figure12presentsadetailedcomputationalanalysisofa Hyperloop pod within its outer tube. The model uses ANSYS software to display the stress distribution across the pod and tube vividly. The color gradient, ranging from blue (low stress) to red (high stress), visually represents the structural stresses encountered under simulated conditions. Notably, the green outer tube exhibits varying shades to indicate stress levels, while the pod’s interior stresses are similarly color-coded. A sectional view permits an in-depth examination of the internal components, which is crucial for assessing the design’s integrity and performance. The accompanying color scale and axes ensure precise stress values and orientation interpretation. This analysis is pivotal for optimizing the Hyperloop’s design for safety and efficiencyinhigh-speedtransitapplications.
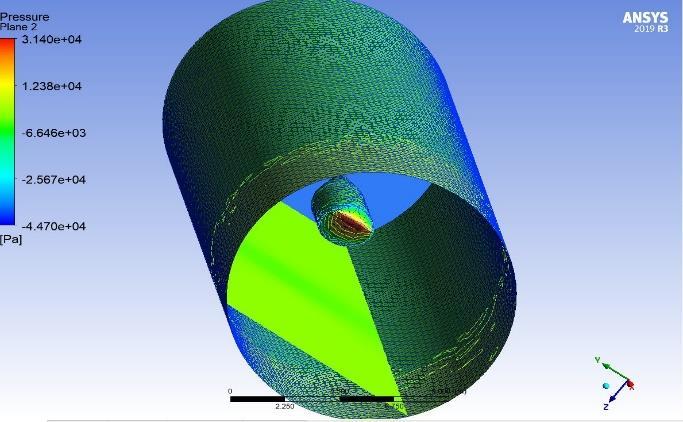
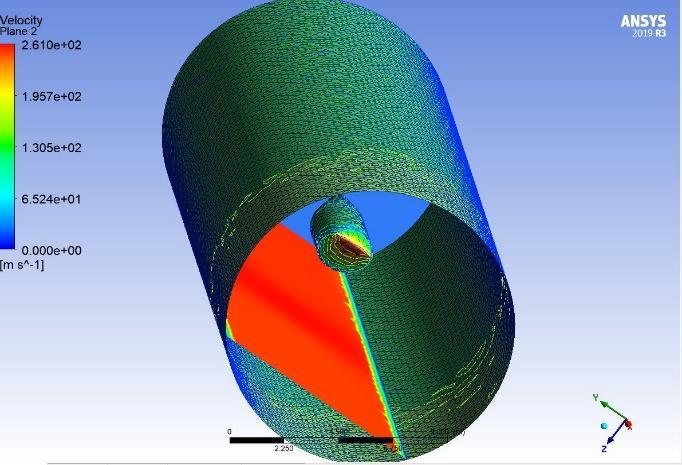
Figure 13 depicts a computational fluid dynamics simulation that analyzes the velocity magnitude of fluid flowwithinapipe.ThesimulationusingANSYSsoftware employs a color scale to represent velocity magnitudes, with red and orange highlighting areas of higher velocities. The green pipe and its internal structure are color-codedtoindicatedifferentvelocityzones,aidingin identifying potential flow irregularities and optimizations.Thecolorscalerangesfrom0.000e+00to 3.576e-02 m/s, precisely quantifying the flow velocities. This analysis is essential for optimizing fluid dynamics within the pipe system, ensuring efficient flow, and minimizing turbulence-related issues. The 3D model orientationis denoted by thelabeledaxesat the bottom right corner, ensuring accurate spatial interpretation. This detailed visualization is a critical tool for engineers indesigningandanalyzingfluidsystems.
4.5. Tube diameter – 7m
Figure 14 showcases a graphical analysis of various parameters over 100 iterations as part of an optimization process in a computational model. The graph displays multiple lines, each representing a different parameter such as sensitivity, specificity, positive predictive value, negative predictive value, and accuracy. These parameters are plotted against the

International Research Journal of Engineering and Technology (IRJET) e-ISSN:2395-0056
Volume: 11 Issue: 09 | Sep 2024 www.irjet.net
‘Bucket bandwidth’ on a logarithmic scale, illustrating their evolution and optimization over the course of the iterations. Thelines begin athighervalues and exhibit a decreasing trend,signifying the refinementand learning processinherenttothemodel’sdesign.Thisvisualization is instrumental in understanding the dynamics of the model’sperformanceandguidingfurtherenhancements. The clear demarcation of iterations and bucket bandwidth values, along with the distinct color coding foreachparameter,facilitatesanintuitiveinterpretation ofthemodel’sbehaviorovertime.

Figure 15 illustrates a computational simulation that visualizes the pressure distribution on an aerodynamic shape resembling an airfoil. The simulation, likely conducted using software such as ANSYS, employs a color-coded legend to denote pressure levels, with the spectrum ranging from -2.77e+04 to 7.77e+04. The 3D model at the center is rendered with corresponding colors to indicate varying pressure zones, which is critical for analyzing aerodynamic performance. Adjacent outlined shapes may represent alternative viewing angles or related simulations, providing a comprehensive understanding of the pressure effects. A scale bar and coordinate system axes (XYZ) at the bottom center ensures accurate spatial interpretation of the model. This simulation is pivotal for optimizing the design and performance of aerodynamic structures in variousengineeringapplications.
p-ISSN:2395-0072
Figure 16 exhibits a computational simulation of the velocity field surrounding a high-speed object akin to a bullet or an airfoil. The simulation, likely conducted using ANSYS software, features a color scale delineating velocityvaluesfrom0.000e+00(indicatingstationary)to 3.500e+02 (indicating high velocity). The object is depictedinblue,signifyingitsrapidmovementfromleft to right. At the same time, the surrounding flow field is represented by a spectrum of colors corresponding to various velocities. This visualization is crucial for analyzing the aerodynamic properties of the object and optimizing its design for superior performance in highspeed environments. The scale bar and coordinate system indicators at the bottom provide a reference for scale and orientation, enhancing the accuracy of the analysis.Thisdetailedsimulationservesasaninvaluable tool for engineers focusing on the dynamics of highspeedmotionandfluidinteractions.
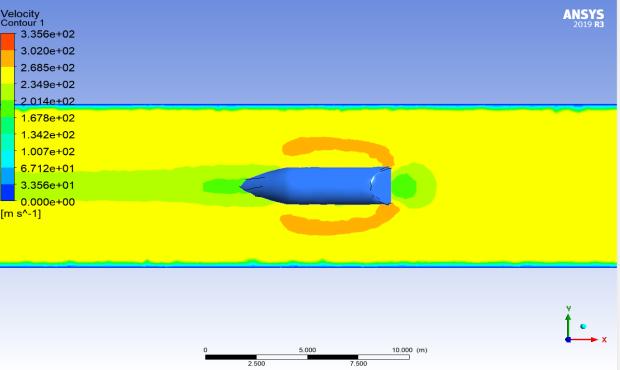
Figure 17providesa comparativeanalysisoftheimpact of different actor learning rates on the total reward in a reinforcement learning model. The graph plots the evolution of the total reward over 140 iterations, with five distinct lines representing actor learning rates ranging from 0.0003 to 0.007. Each line, color-coded for clarity, demonstrates the learning process and optimization of the model as it interacts with the environment. The trend observed across the iterations suggestsasignificantinfluenceoftheactorlearningrate on the model’s performance, with some rates leading to better convergence than others. This analysis is crucial for fine-tuning the learning parameters to achieve optimalresultsincomplexadaptivesystems.Thelegend in the top left corner correlates the colors to the respectivelearningrates,ensuringaclearunderstanding ofthedatapresented.

International Research Journal of Engineering and Technology (IRJET) e-ISSN:2395-0056
Volume: 11 Issue: 09 | Sep 2024 www.irjet.net

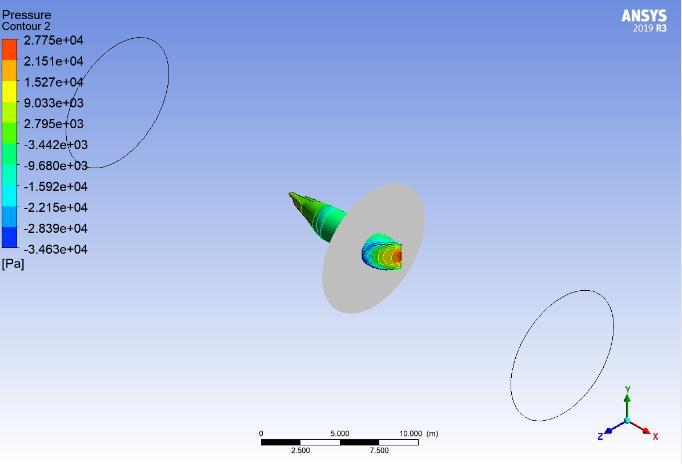
Figure 18 demonstrates a computational fluid dynamics simulation that maps pressure contours onto an aerodynamic model, potentially an airfoil. The simulation, likely performed using ANSYS software, features a color gradient to represent pressure levels from2.077e+04to-5.000e+04[Pa].Thecentralobjectis detailed with these contours, providing insights into pressure distribution critical for aerodynamic analysis. The two circular outlines adjacent to the model may offer additional perspectives or relate to comparative studies. The Cartesian coordinate system at the bottom right ensures accurate orientation, while the gradient blue background enhances the visual appeal of the simulation. This analysis is key for optimizing aerodynamic designs and improving performance in fluiddynamicenvironments.
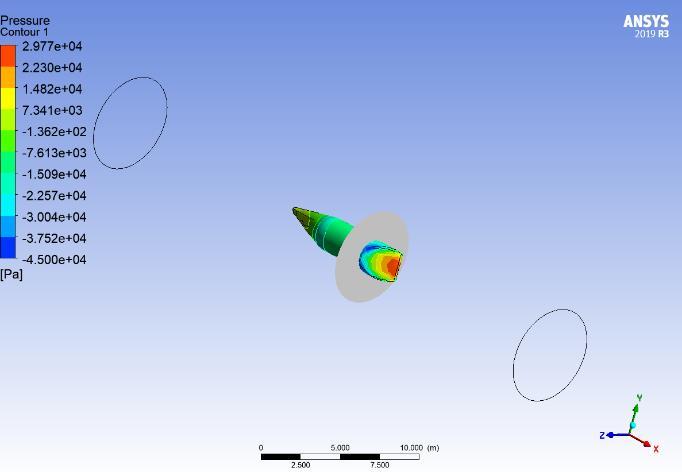
Figure 19 displays a computational fluid dynamics simulationthatanalyzesthevelocitydistributionaround an aerodynamic cone model. The simulation, likely performedusingANSYSsoftware,utilizesacolorscaleto indicate velocity values from 0 to 3.47e+02 m/s. The model is centrally placed and color-coded to reflect the varying velocities, which are essential for studying the object’s aerodynamic properties. The outlined ellipses may represent different flow patterns or comparative analyses. The inclusion of a scale bar and XYZ axis indicator at the bottom provides a reference for
p-ISSN:2395-0072
orientation and scale. This simulation is vital for understanding the fluid dynamics around high-speed objects and optimizing their design for improved performanceinaerospaceapplications.
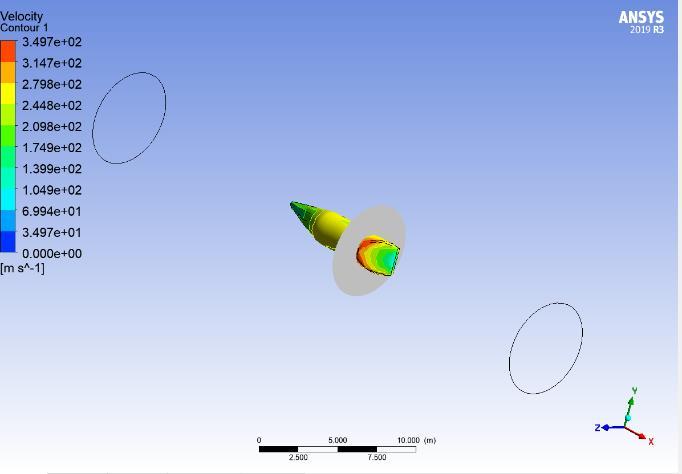
Figure 20 illustrates the relationship between tube diameterandsystemperformance,asasimplelinegraph indicates. The x-axis represents the tube diameter, ranging from 0 to 11, while the y-axis, though not labeled,showsvaluesthatsuggestaperformancemetric rangingfrom4.0to5.2.Thegraphplotsthreedatapoints connected by a blue line, indicating a trend where performancepeaksatatubediameterof3andgradually decreases as the diameter increases. This analysis is crucial for optimizing tube dimensions to achieve the best system performance in fluid dynamics or heat transfersystemsapplications.Thegraphprovidesaclear visual representation of how changes in physical dimensions can affect a mechanical system's overall efficiencyandeffectiveness.
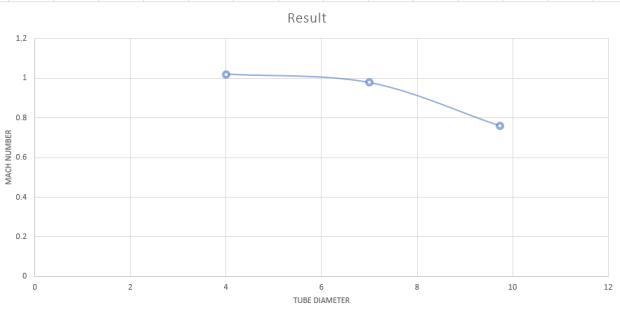
Figure 21 presents a trend analysis graph labeled “Kontrolle Limit,” which examines the progression of controllimitsacrossdifferenttubediameters.Thex-axis, now representing “Tube Diameter,” spans from 0 to 10, while the y-axis, though not explicitly labeled, ranges from 0 to 10, likely indicating control limit values. The

International Research Journal of Engineering and Technology (IRJET) e-ISSN:2395-0056
Volume: 11 Issue: 09 | Sep 2024 www.irjet.net p-ISSN:2395-0072
graphplotsfivedatapointsconnectedbyabluelinethat exhibits a gradual increase, suggesting an upward trend in control limits as the tube diameter increases. This visualization aids in monitoring and managing quality control parameters, ensuring that the system remains within the defined control limits for optimal performance.Thesimpleyetinformativegraphprovides a clear view of the relationship between tube diameters and control limits, which is essential for process optimizationandmanagement.

5. Conclusion
In our analysis of different tube diameters for the hyperlooppodsystem,wehavefoundthata diameterof approximately7metersisoptimalforourpodgeometry. This diameter minimizes the bypass air speed, keeping theMachnumberbelow1,whichiscrucialforsafetyand efficiency. Comparing diameters of 9.735 meters, 7 meters, and 4 meters, we observed significant differences in various factors such as choke flow occurrence, shock wave generation, boundary layer effects, material requirements, compressor work, stability, and future scopes for improvement. For future enhancements, several avenues can be explored including the utilization of advanced alloy materials, adjustments in tube thickness to mitigate buckling, optimization of column spacing and cross-section, utilization of compressors for bypass air management, exploration of different column lengths and crosssectional shapes, implementation of turbulencegenerating techniques, and thorough investigation into theeffectsoftailvariationsonpodperformance.
Furthermore, considering underwater structures presents intriguing possibilities, offering advantages such as reduced weight, inherent damping properties, adjustable pressure maintenance, and simplified route design, particularly in urban settings. These insights provide a robust foundation for further research and development in the realm of hyperloop transportation systems.
References
[1] www.wikipedia.com
[2] www.sciencedirect.com
[3] www.google.com
[4] www.skybrary.aero
[5] Open-Source Conceptual Sizing Models for The Hyperloop Passenger Pod Jeffrey C. Chin∗, Justin S. Gray∗,ScottM.Jones∗,JeffreyJ.Berton∗NasaGlenn ResearchCenter,Cleveland,Oh
[6] XInternationalConferenceOnStructuralDynamics, Eurodyn 2017 Transpod Ultra-High-Speed Tube TransportationRyanJanzen.
[7] “Mit Hyperloop Final Report” An Overview Of The Design,Build,AndTestingProcessForMit’sEntryIn The Spacex Hyperloop Competition 2015-2017 August 2017 Cleared For Public Release ©Mit HyperloopTeam2017.
[8] “HyperloopAlpha”ElonMusk2013ResearchPaper.
[9] “ConceptualFeasibilityStudyofHyperloopVehicle” ByNasaGlennResearchCenter,Cleveland,Oh.
[10] Hyperloop Technology: Economic Analysis of a TransportationRevolution“JacobCovell”


Mr. Rahul Sahu is an Assistant Professor at GEC Raipur. He did his MTech from IIT Bombay and is pursuingPhDfromIITBhilai.
Mrs Swastika Patel is an Assistant Professor at GEC Raipur. She did her MTech from NERIST Itanagar and pursuingPhDfromIITBhilai.
Mr. Prashant Kumar Sahu is an Assistant Professor at GEC Jagdalpur. He did his MTech from IIT Guwahati andpursuingPhDfromCSVTUBhilai.
Mr. Gulab Verma is an Assistant ProfessoratGECJagdalpur.Hedidhis MTech from NIT Suratkal and pursuingPhDfromNITRaipur.
Mr. Sunil Kumar Patel is an Assistant Professor at GEC Raipur. He did his MTechfromMNITBhopal.