International Research Journal of Engineering and Technology (IRJET) e-ISSN: 2395-0056
Volume: 11 Issue: 09 | Sep 2024 www.irjet.net p-ISSN: 2395-0072

International Research Journal of Engineering and Technology (IRJET) e-ISSN: 2395-0056
Volume: 11 Issue: 09 | Sep 2024 www.irjet.net p-ISSN: 2395-0072
Arnav Mody1 , Dr. Soumya Sri-Bhattacharya2
1Student at PPSIJC, Mumbai, Maharashtra, India -400056
2Research Professor ***
Abstract - This research explores atomic vibrations using the Lennard-Jones Potential (LJP) to model the balance of attractive and repulsive forces between atoms. Focusing on energy exchange between kinetic and potential forms, we examine how atoms oscillate around equilibrium points. By applying these principles to hydrogen gas, we calculate energy distributions and investigate how atomic vibrations affect material properties like thermal and electrical conductivity. The study provides a theoretical foundation for understanding atomic behavior, with potential applications in materials science and thermodynamics. Limitations of the LJP are noted, such as its neglect of multi-body interactions.
1.INTRODUCTION
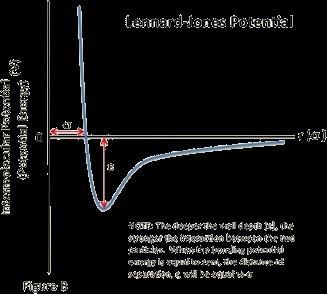
Everything in the world around us is due to the effect of two main types of forces, the Gravitational and the Electromagnetic force. The macroscopic world works mainly on the principles of the gravitational force. However, in the microscopic world, everything is governed by electromagnetic forces that dictate the behavior of atoms and molecules, ultimately shaping the properties of matter. One of the fundamental concepts in understandingtheseforces istheLennard-Jones Potential (LJP), which models the interaction between a pair of neutral atoms or molecules. The LJP describes how the potential energy between two particles changes with respect to the separation and how the electric force transitions from being attractive at longer distances to repulsive as they approach each other, preventing them from occupying the same space. This interconnection betweenpotential energyandforcecan beexplained bya simple mathematical equation that shows that the force exerted is the negative gradient of the potential energy distance graph. The Lennard-Jones Potential uses the parameters of the well depth and the zero of the function todescribehowtheElectricPotentialEnergyoftwoatoms in a bond changes with respect to the distance between the two atoms. The Lennard-Jones Equation is as follows: [1]
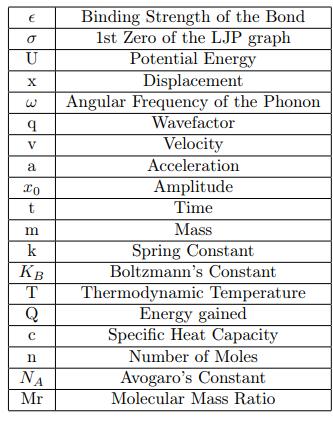
Where : V(r) represents the Electric Potential Energy when separation is r ϵ represents the Binding Strength of the Particular Bond σ represents the Zero of the function. Since the σ and ϵ are unique characters, the relationship between
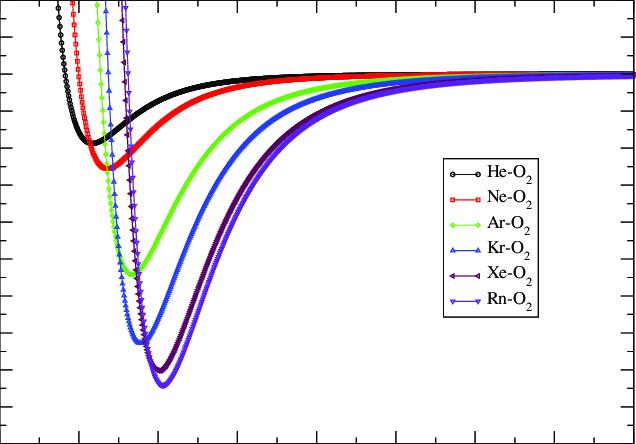
Fig -1:DiagramshowinghowtheLJPgraphsaredifferent fordifferentbonds
theElectricPotentialEnergyandthedistanceisuniqueto eachbond.Theforcesactingontheatomspartakinginthe bond will also be bond-specific, resulting in a certain aspect of peculiarity. The interplay of forces between the atoms, represented by the Lennard-Jones Potential equation,leadstoanequilibriumstatewherethenetforce between particles is zero. Oscillations around this equilibriumpositionplayacrucialroleindeterminingthe propertiesofsubstances.Understandingtheseoscillations isessentialastheyunderlieseveralimportantphenomena including spectroscopic signatures, thermal and electrical conductivity, and reaction kinetics. This research aims to delvedeeperintotheoscillatorybehaviorofatomsasthey transition between attractive and repulsive forces. We explore the energy distribution within these oscillating systems, considering the exchange between kinetic and potential energy as atoms vibrate around their equilibriumpositions.Bydevelopingmathematicalmodels and differential equations, we seek to describe these energy fluctuations and their impact on the overall behavior of materials. Through this investigation, we aim to provide a more comprehensive understanding of the internal energy in microscopic systems, offering insights into how energy is conserved and distributed at the atomic level. This research contributes to the theoretical understandingofmolecularinteractionsandhaspotential
International Research Journal of Engineering and Technology (IRJET) e-ISSN: 2395-0056
Volume: 11 Issue: 09 | Sep 2024 www.irjet.net p-ISSN: 2395-0072
applications in fields such as material science, thermodynamics,andquantummechanics.
2.Context
One way of explainingthe reason behind the oscillationof these atoms is electromagnetism. Since these atoms have charges and are in a constant state of motion, they can be thoughtofashavingtheirownmagneticfluxaroundthem. When a nearby atom experiences any movement, it disturbs the magnetic flux of the other atoms. This disturbance of magnetic flux is what causes a force to act on the atoms such that the force opposes the cause of the disturbance, as stated by Lenz Law. This force acts as the restoring force for the oscillation. The motion of the charged particles in the magnetic field can affect the system in many different waysand thecontinuouschange of the magnetic flux at all points between the atoms can also cause many effects. This can further be studied when the system is looked at from a quantum-mechanical point ofview.
We claim that the potential graph should not be a continuous function and should instead be discrete as energy is transferred in packets (photons). It is important to study the effect of this as it can help us determine and prove that this system of atoms should be studied from a quantum-mechanicalstandpointandnotclassicalphysics.
The Lennard-Jones Potential equation shows how the potential energy of two atoms changes with respect to their separation by taking into account multiple factors and formulating the σ and ϵ of the bond. This equation
whenplottedonagraphresultsina’dip’-likecurvewhose minimumpointisatadistanceofϵfromtheY-axisandthe firstzeroofthegraphisatadistanceofσfromtheX-axis.
Since and the minimum points are all turning points, the gradientatthatpointmustbe0,andhencetheforceatthe minimum point is 0 and the system is in a state of equilibrium at the minimum point. The graph can be broken into two sections at the equilibrium point. The leftward section shows repulsion as, when solved using Equation(2) the force value is negative which represents repulsion. Hence, the rightward section would show a stateofattraction.Wecanseethatthecurvatureofthedip is not symmetrical on both sides which shows that the strengthofattractionandrepulsionisnotthesame.
Repulsive Region (r < σ): Steep rise with large positive curvature, reflecting strong repulsive forces. Attractive Region (r > σ): Gentle dip with smooth curvature, as the potential gradually approaches zero. Analytically, curvatureisdeterminedusingthesecondderivativeofthe potential. Hence, by finding the second derivative of the Lennard-Jones Potential Equation, we can find the analytical description of the curvature. The synthetic description highlights the sharp bend in repulsion versus thesmoothtransitioninattraction.Thiswouldresultinan asymmetricalKineticenergygraphlateron.
International Research Journal of Engineering and Technology (IRJET) e-ISSN: 2395-0056
Volume: 11 Issue: 09 | Sep 2024 www.irjet.net p-ISSN: 2395-0072
2.3.1
Crossingtheequilibriumdistanceduringatomicvibrations primarily affects the electrical conductivity of materials through electron-phonon interactions. When atoms move past their equilibrium positions, they create phonons that can scatter conduction electrons. Phonons are quasiparticles representing quantized vibrations of atoms in a solidlattice.Theyplayakeyroleinunderstandingheatand sound propagation in materials. Phonon scattering increaseswithlargerdeviationsfromequilibrium,typically reducingthematerial’selectricalconductivity,especiallyat higher temperatures where atomic vibrations are more intense. The overall effect depends on the material’s structureand how strongly electron movement is coupled withatomicvibrations.
2.3.2
The phonon scattering, as mentioned above, significantly affects the thermal conductivity of a substance. This scattering can either increase or decrease thermal conductivitydependingonthematerial. Inmostmaterials, more phonon scattering generally reduces thermal conductivity, especially at higher temperatures. However, it may increase thermal conductivity in certain polymers andcomplexcrystallinematerialsunderspecificconditions through a process called phonon localization. The group velocity of phonons plays a key role in thermal conductivity.
and neglects more complex multi-body interactions that can be significant in real systems. Additionally, the potential cannot describe directional bonding, such as hydrogen bonds or covalent bonds, which are crucial for many molecular structures and interactions. Another limitation is the absence of electronic polarization effects, which can influence interactions in more complex or polarizablesystems.[2]
The Lennard-Jones potential is primarily applicable to noblegasesandsimplenon-bondedinteractions,makingit inadequate for describing covalent, ionic, or metallic bonds. Furthermore, the parameters ϵ and σ in the Lennard-Jones equation are typically obtained from empirical data and may not accurately capture the nuancesofinteractionsindifferentenvironmentsorunder varying conditions. In high-density systems, where atoms ormoleculesareveryclosetogether,thepotentialmayfail toaccuratelypredicttherepulsiveforcesduetoitslimited form. This is because other forms of attraction and repulsion such as ID-ID and PD-PD attraction are more prevalent in these systems. Moreover, the potential does not directly incorporate the effects of temperature and pressure,whichcanbesignificantinreal-worldscenarios Therepulsiveterm,withitspowerof12,providesasteep increase in potential energy that might not always represent true physical behavior at very short ranges. These limitations highlight that while the Lennard-Jones potentialisausefulapproximation,morecomplexmodels and potentials are often necessary to accurately describe molecularinteractionsinmanysystems.
3.0.1
Where ω is the angular frequency of the phonon and q is the wave factor In solids, heat is primarily conducted by phonons. Faster phonon group velocities result in more efficient energy transfer, thus enhancing the material’s ability to conduct heat. This can be grouped as transport phenomena for heat and electricity and the effect of crossing the equilibrium point can be further studied. By understanding the distribution of the energies at each stage of the oscillation, we can better understand the factorsthatmayaffectphononscatteringandhenceaffect this transport phenomenon. In essence, this research directly helps us better interpret, understand, and manipulate phonon scattering and hence, thermal and electricalconductivityaswell.
2.4 Limitations of the Lennard-Jones Potential Equation
Onemajordrawbackisitsoversimplificationofmolecular interactions, as it only accounts for two-body interactions
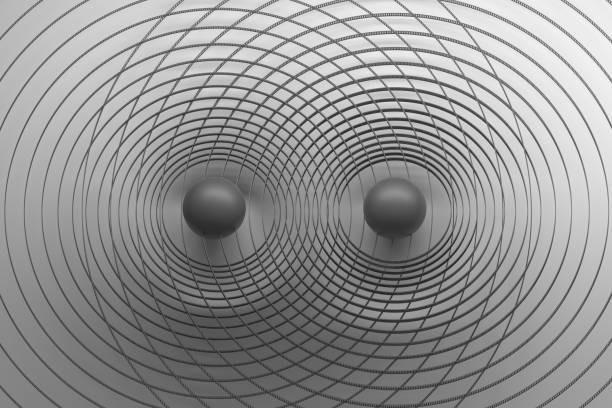
The system of two atoms interacting with each other can be envisioned as a system of two blocks connected together via a spring. This comparison would imply that the oscillating atom system follows a simple harmonic motion.

Fig - 4 Representationofhowthedescribed2-block systemwouldlook
The point where the spring is most compressed (maximum Elastic Potential Energy) and both the blocks areatrestwouldbesimilartothepointwhentheElectric Potential Energy is maximum. Following this assumption, we can say that the atomic system would follow all the equations of simple harmonic motion. This would also
International Research Journal of Engineering and Technology (IRJET) e-ISSN: 2395-0056
Volume: 11 Issue: 09 | Sep 2024 www.irjet.net p-ISSN: 2395-0072
mean that the distribution of potential and kinetic energy in the atomic system would be similar to that of a simple harmonic system. Hence, the atomic system would follow thefollowingequations:
The velocity-time function shows that the velocity would be maximum when the body, atom here, is in the equilibriumposition,andasthebodyapproacheseitherof the ends, its velocity decreases and eventually becomes 0 attheends.SinceKineticenergyisdirectlyproportionalto thesquareofvelocity,
The Kinetic energy of the system would follow a similar trendwithitbecomingmaximumatthe equilibriumpoint andminimumatthetwoendpoints.
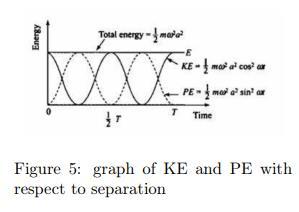
Since the Total energy is constant due to the law of conservationofenergy,thePotentialEnergywouldfollow an inverse trend becoming maximum at the two endpoints and minimum at the equilibrium point. Since we know that the Kinetic Energy is maximum at the equilibrium point. By assuming that the Potential Energy isαatthatpoint,wecansaythatthetotalenergyis:
With this in mind, we have a rough idea about the description of the kinetic and potential energies of the oscillatingatoms.Figure5representshowtheEnergiesof the oscillating atoms would change. Both the Energy graphshaveasinusoidalnatureduetothecosineandsine functions present in the Simple Harmonic Motion equations.Thetotalenergytooisshownwithits equation in a different form. We can see that the total energy is invariant to the separation. Hence abiding by the law of conservation of energy. The above graph, however, represents the energy change in a dynamic system. The total energy of a system can change due to external factors.
Thevelocityatagivenpointis
Sothemaximumvelocityis
Conventionally, it is assumed that the Potential energy of thesystemis0attheequilibriumpointgivingαthevalue of0andhencesimplifyingtheTotalEnergyequation.
If an energy source is connected to the system, the total energywouldincreasewithrespecttotime.Figure 6isan Energy-Time graph that plots the Kinetic and Potential
International Research Journal of Engineering and Technology (IRJET) e-ISSN: 2395-0056
Volume: 11 Issue: 09 | Sep 2024 www.irjet.net p-ISSN: 2395-0072
energies. As shown in Figure 6, both the kinetic and potentialenergieswouldincreasewithtimebutwouldstill retain their sinusoidal characteristics and time period. In essence,onlytheamplitudeoftheEnergieshaschanged.
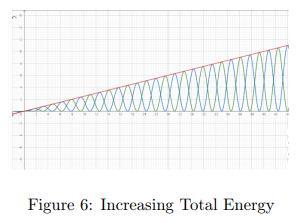
ThegradientoftheTotal Energygraphwouldindicatethe rate at which energy is supplied to the system by the sourceorthepoweroftheenergysource.
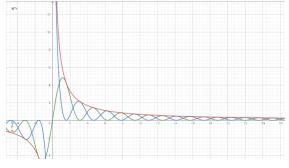
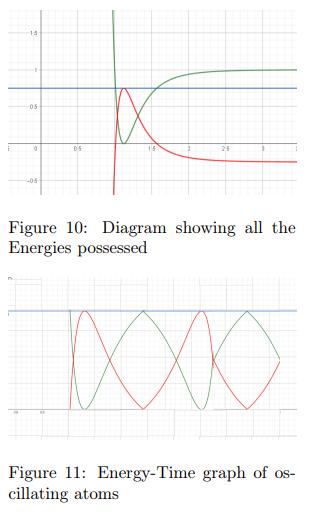
If, on the other hand, any substance that removes energy from thesystem is connected to thesystem,then the total energywoulddecreasewithrespecttotime.Figure7isan Energy-Time graph that shows the Kinetic and Potential Energies. As shown in Figure 7, both the kinetic and potential energies would decrease over time but will still retain their characteristics. The gradient of the graph indicates the rate at which energy is removed from the system. Theamplitude decreases exponentially thisshows thateventually,theatomscometoanapparentstateofrest where the magnitude of the displacement from the mean positionisnegligible.However,itisimportanttonotethat this only occurs in those systems in which energy is continuouslydrawnoutandisnotapplicableinreal-world scenarios.
3.0.3
However, it is important for us to realize that the Movement of atoms does not actually follow a Simple HarmonicMotion.Thisisbecausetheatomsdonotfollow the most important postulate of simple harmonic motion which is, the acceleration experienced must be directly
proportional to the displacement and must be in the oppositedirection.Thiscanbeseen,astheLennard-Jones Equation shows that Potential Energy has an inverse relationship with distance. Hence, when differentiated to find force, the equation would still show an inverse relationshipshowing thataccelerationis not proportional tothenegativedisplacement.
Hence, we have established that the oscillating atoms followanan-harmonicoscillation.Itis,however,necessary for us to find the ranges of separations that these atoms undergo to accurately formulate the functions that would describe the energies. To do this, we must find the total energy that each individual molecule would possess and move forward accordingly. We use Hydrogen gas as the sample molecule for all assumptions and calculations as it has minimum mass and its diatomic nature makes calculations easy and accurate. Initially, we approached thisproblemusingtheidealgasenergyequation.However, we later discarded this as the ideal gas equation assumes that there are no intermolecular forces of attraction or repulsion.Thismeansittakesthepotential energytobe0 at all times which directly contradicts the Lennard-Jones PotentialEquation
Where KB stands for Boltzmann constant and T stands for ThermodynamicTemperature.5/2isusedasthehydrogen gaswillhave5degreesoffreedomasitisadiatomicgas.
We then decided to use enthalpy change as a measure of finding the energy possessed by a singular molecule. The actual amount of the internal energy can never be found butthechangeinenergycanbefound.Wecanestimatethe energypossessedbyfindingtheenthalpychangeofthegas from 0K (absolute zero) to any particular temperature(273Kinthiscase).
However, the specific heat capacity of a substance is not constant and changes depending on the temperature. We assume that the specific heat capacity remains unchanged throughout the calculation and the value is similar to the specificheatcapacityatroomtemp.Bytakingthevalueofc tobe14.20JK−1g−1,wefindthattheenergypossessedby eachmoleculeofhydrogengasis1.30∗10 20.Thisenergy is then distributed between the kinetic and potential energies. For the scope of this research paper, we will represent all the parameters as symbols instead of their actual values. Substituting the real data values in the equationtofindanaccuratenumericalresultmaybedone later.[3]
International Research Journal of Engineering and Technology (IRJET) e-ISSN: 2395-0056
Volume: 11 Issue: 09 | Sep 2024 www.irjet.net p-ISSN: 2395-0072
IrjBy plotting the Total Energy of a molecule on the same graphastheLennardJonesPotential,itispossibleforusto findthepointsofseparationatwhichthePotentialEnergy is maximum and hence Kinetic Energy is 0. These points would serve as the endpoints of the oscillation as the velocity is 0 meaning that the atoms are changing their directionofmotion.
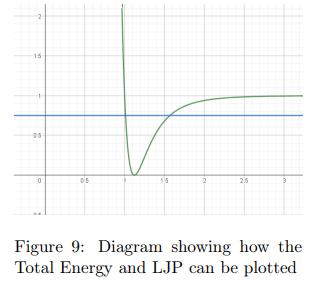
Figure 9 is a Energy-Separation graph which shows the TotalEnergyandPotentialEnergy.Figure9showshowthe Total Energy and the Potential Energy of these oscillating atoms would be represented. The X coordinates of the points of intersection of the 2 graphs show the range within which the separation of the atoms is allowed to exist.ByusingtheTotalEnergyEquationTE=KE+PE,we knowthattheKineticEnergywillbethepositivedifference between the Total Energy and Potential Energy graphs. Figure 10, an Energy-Separation plot, shows the Kinetic Energy(Red), Potential Energy(Green), and Total Energy(Blue)possessedbyasinglehydrogenmolecule.
In conclusion, we can determine that the Energies of a system of oscillating atoms change dynamically in a set pattern and this pattern is influenced by the LennardJones Potential of the bond. This research explores the oscillatorybehaviorofatomsasdescribedbytheLennardJonesPotential(LJP),providinginsightsintohowpotential andkineticenergyfluctuateduringatomicinteractions.By modeling these interactions and comparing them to simple harmonic motion, we observed that while the oscillations of atoms share similarities with classical harmonicsystems,theyare inherentlyanharmonicdue to the nature of molecular forces. The Lennard-Jones Potential effectively describes the interactions between neutral atoms, demonstrating how electric potential energy changes with separation. Our analysis of energy distribution reveals how atoms transition between attractive and repulsive forces, oscillating around an equilibrium point where the net force is zero. These oscillations influence key material properties such as thermal and electrical conductivity, as deviations from equilibrium lead to phonon scattering. We also acknowledge the limitations of the Lennard-Jones
International Research Journal of Engineering and Technology (IRJET) e-ISSN: 2395-0056
Volume: 11 Issue: 09 | Sep 2024 www.irjet.net p-ISSN: 2395-0072
Potential, particularly in its oversimplification of molecular interactions and its inability to account for multi-body interactions, directional bonding, and electronic polarization. Despite these limitations, the LJP remains a valuable tool for understanding fundamental molecular behavior, especially in simple systems like noble gases. By developing mathematical models and computingenergydistributionsforhydrogengas,wehave established a framework for studying atomic vibrations and their implications for material properties. Future research could focus on addressing the limitations of the Lennard-Jones Potential by incorporating more complex interactions, temperature and pressure effects, and exploring its applicability to a broader range of materials and molecular structures. This work contributes to a deeper theoretical understanding of atomic oscillations andtheirroleindeterminingthebehaviorofsubstancesin variousscientificandengineeringcontexts.
[1] J Karl Johnson, John A Zollweg, and Keith E Gubbins. The lennard-jones equation of state revisited. Molecular Physics,78(3):591–618,1993.
[2] Xipeng Wang, Simón Ramírez-Hinestrosa, Jure Dobnikar, and Daan Frenkel. The lennard-jones potential: when(not)touseit.PhysicalChemistryChemicalPhysics, 22(19):10624–10633,2020.
[3]LiongSengTee,SukehiroGotoh,andWarrenEStewart. Molecularparametersfornormalfluids.lennard-jones126 potential. Industrial & Engineering Chemistry Fundamentals,5(3):356–363,1966.
[4]JeffreyRErrington,PabloGDebenedetti,andSalvatore Torquato. Quantification of order in the lennard-jones system. The Journal of Chemical Physics, 118(5):2256–2263,2003.
[5] John Edward Lennard-Jones. On the forces between atoms and ions. Proceedings of the Royal Society of London.SeriesA,ContainingPapersofaMathematicaland PhysicalCharacter,109(752):584–597,1925.
[6] Pablo Moscato and Mohammad Nazmul Haque. New alternatives to the lennard-jones potential. Scientific Reports,14(1):11169,2024.
[7] Ning Yu and Andreas A Polycarpou. Adhesive contact based on the lennard–jones potential: a correction to the value of the equilibrium distance as used in the potential. Journal of Colloid and Interface Science, 278(2):428–435, 2004.
[8]Jean-PierreHansenand LoupVerlet.Phasetransitions ofthelennard-jonessystem. physical Review,184(1):151, 1969.
[9] Jean-Pierre Hansen. Phase transition of the lennardjones system. ii. high-temperature limit. Physical Review A,2(1):221,1970.
[10]JABarker,DHenderson,andFarid F Abraham.Phase diagram of the two-dimensional lennard-jones system; evidence for first-order transitions. Physica A: Statistical MechanicsanditsApplications,106(1-2):226–238,1981.
[11] James M Phillips, LW Bruch, and RD Murphy. The two-dimensional lennard-jones system: Sublimation, vaporization, and melting. The Journal of Chemical Physics,75(10):5097–5109,1981.