Attached Dwelling
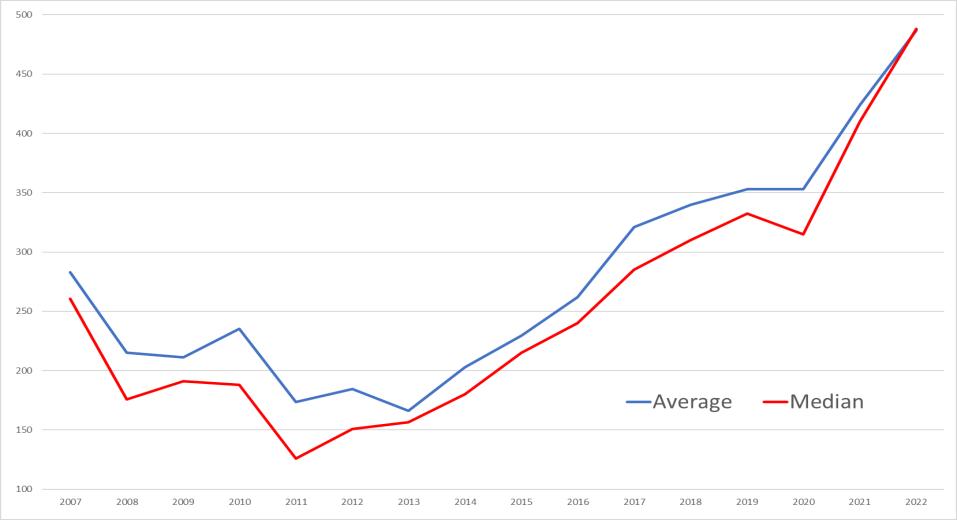
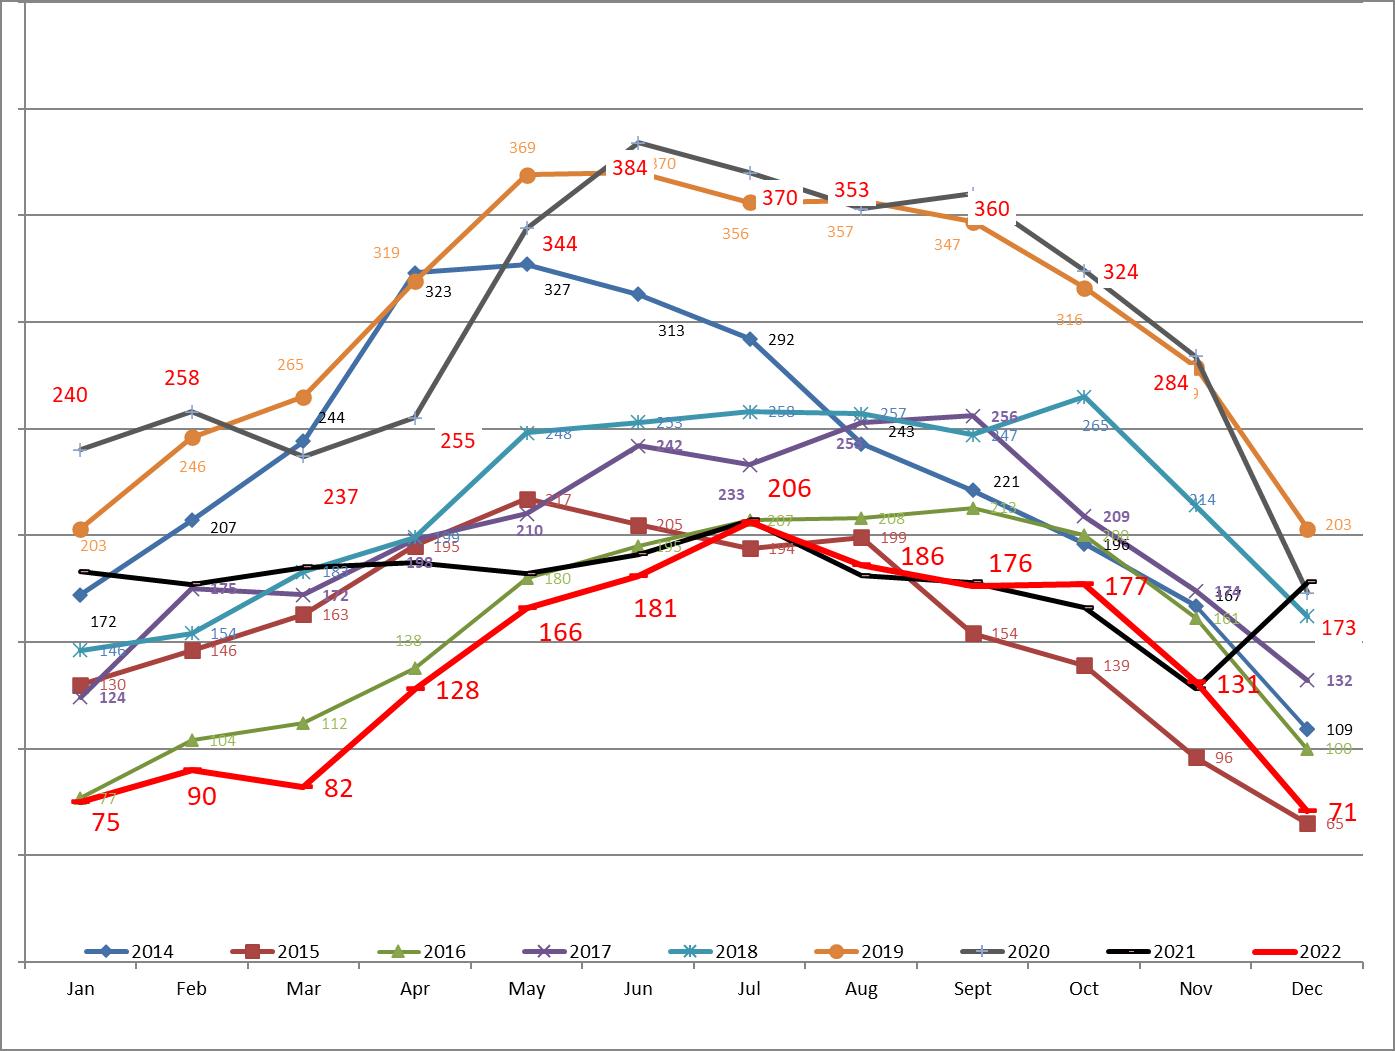
Year 2022 % Change Year 2021 2 yr. Change Year 2020 Total Active Listings 37 236.4% 11 236.4% 11 Median Sales Price $487,510 18.8% $410,300 54.8% $315,000 Average Sales Price $486,714 14.7% $424,348 37.9% $353,038 SP/LP Ratio 100.0% -2.1% 102.1% 1.0% 99.0% Average Market Time 38 8.6% 35 -19.1% 47 Number of Sales YTD 117 125.0% 52 67.1% 70 Expired Listings 37 3600.0% 1 362.5% 8 Months of Inventory 3.8 52.0% 2.5 100.0% 1.9 % Under Contract 38% -26.9% 52% -30.9% 55% 30 Year Mortgage 6.42% 107.1% 3.10% 139.6% 2.68% From IRES and Metrolist MLS 1/5/2023 Boulder
Town of Erie
County
Attached Dwelling Sold by Area Year End 2015 2016 2017 2018 2019 2020 2021 2022 Boulder 707 559 569 592 564 646 686 521 Louisville 54 69 70 71 83 106 69 44 Lafayette 141 150 136 134 159 138 153 97 Longmont 308 312 354 336 374 316 287 225 Plains 127 121 129 126 130 121 140 89 Superior 39 39 51 89 68 57 68 47 Boulder County 1,377 1,252 1,312 1,351 1,379 1,039 1,108 1028 Broomfield 277 Erie 117
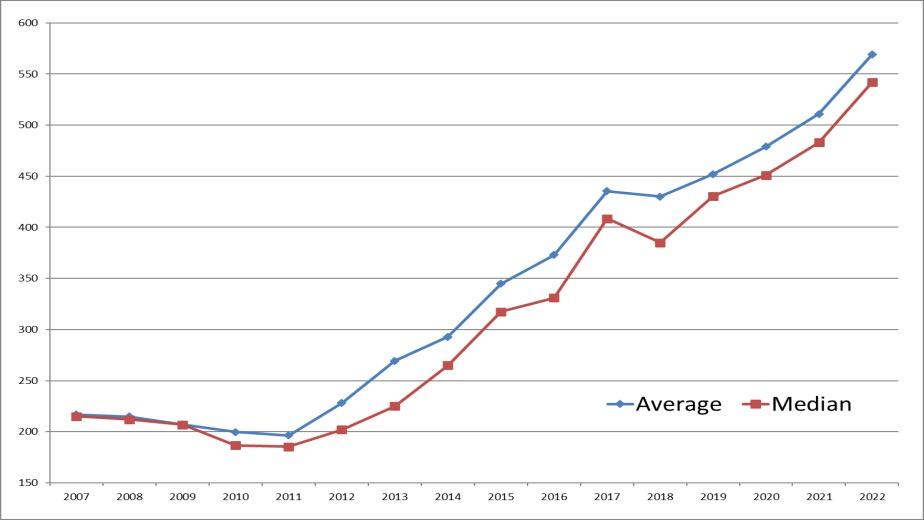
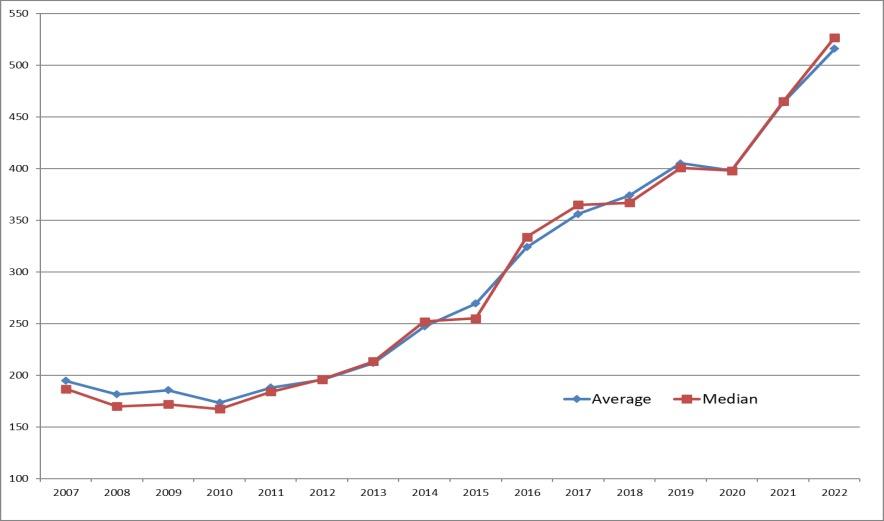
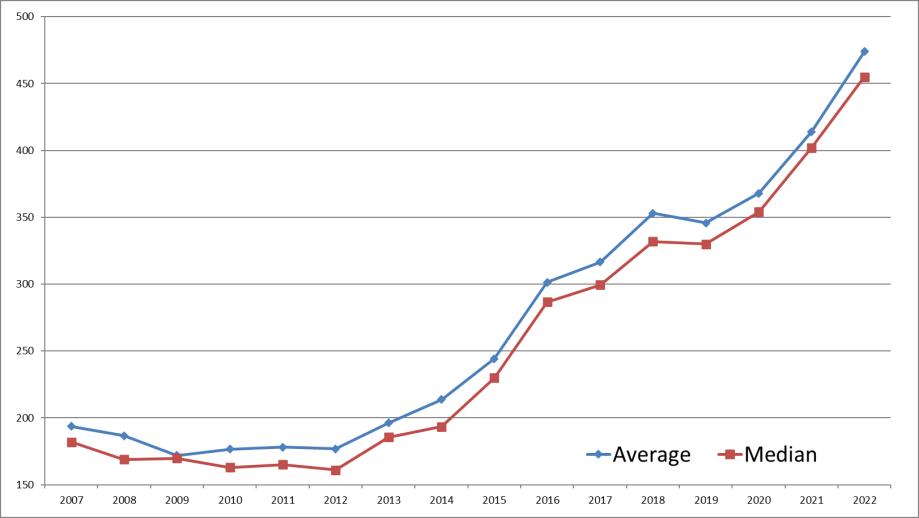
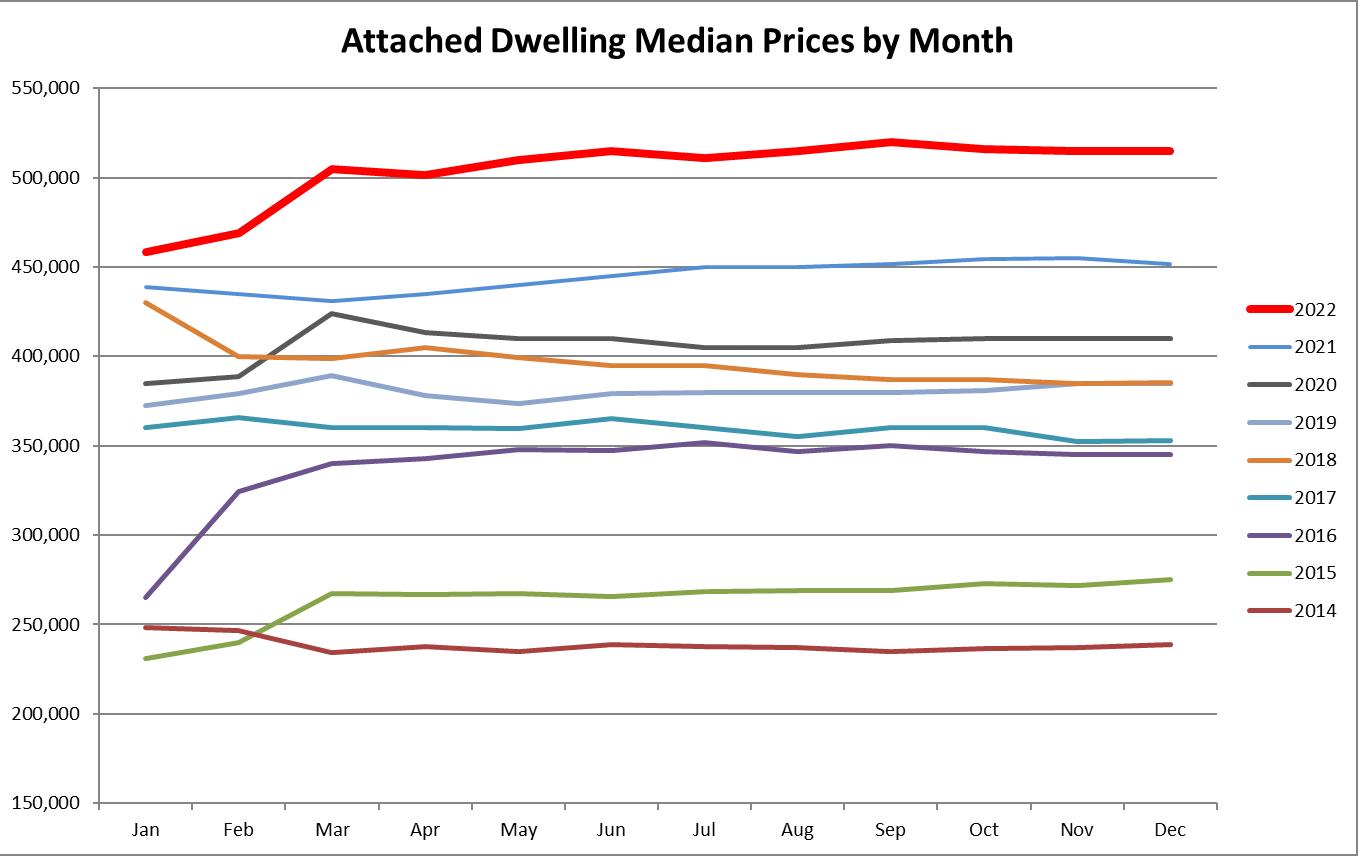
Attached Dwelling Median Sales Price Year End 2017 2018 2019 2020 2021 2022 Boulder $405,000 $460,000 $450,000 $486,825 $510,000 $585000 Louisville 408,455 385,100 430,635 451,200 483,010 542,350 Lafayette 365,000 366,500 400,900 398,250 465,000 527,000 Longmont 299,460 332,200 329,900 353,750 402,000 455,000 Plains 339,900 355,000 349,000 353,000 371,750 430,000 Superior 336,500 462,400 442,500 525,000 700,000 620,000 Boulder County 352,758 385,100 385,000 410,000 451,887 515,000 Broomfield 375,000 335,000 355,000 405,000 457,500 529,375 Erie 285,000 310,000 332,500 315,000 410,300 487,510
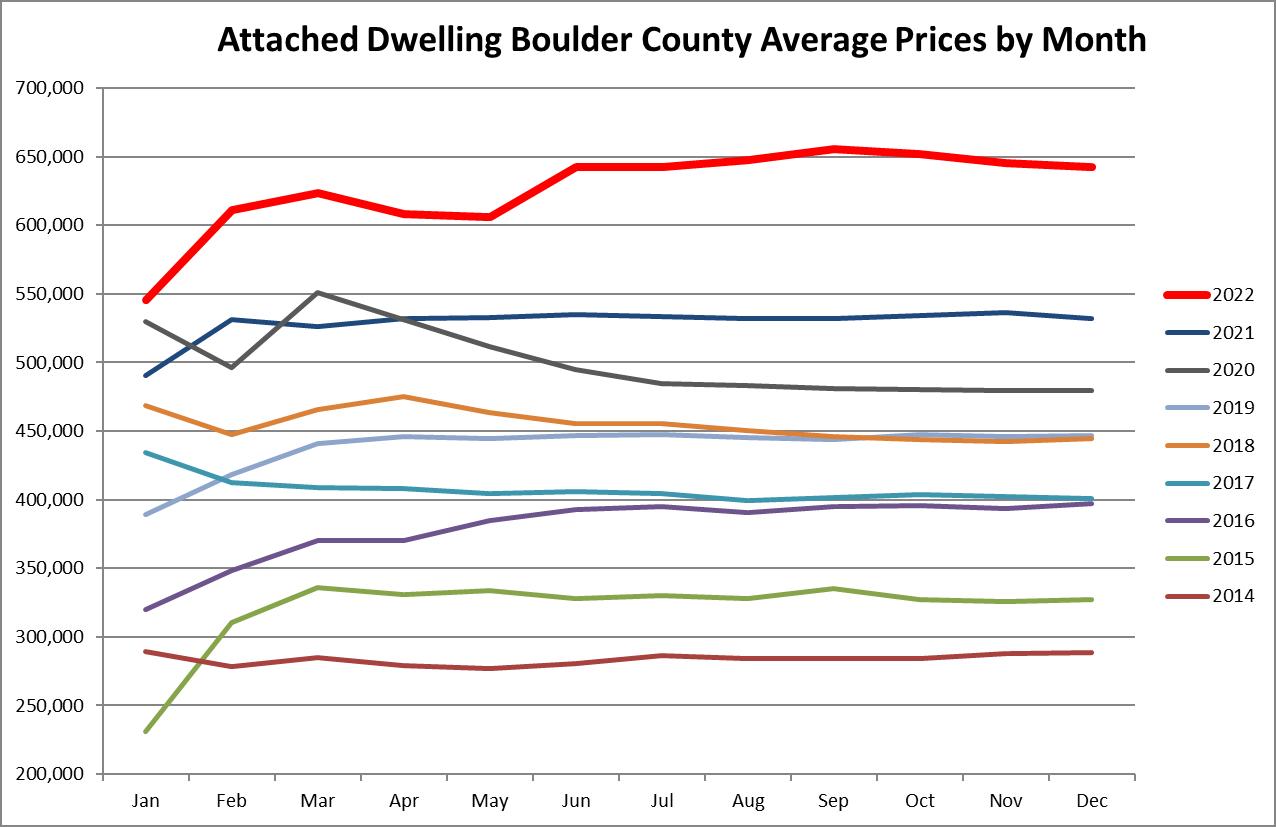
Attached Dwelling Average Sales Price Year End 2017 2018 2019 2020 2021 2022 Boulder $465,077 $525,490 $538,360 $564,721 $621,543 $776,210 Louisville 435,501 430,100 452,100 479,332 510,536 568,674 Lafayette 356,169 374,300 405,200 398,309 464,453 516,283 Longmont 316,613 353,100 345,800 367,732 413,763 473,678 Plains 358,831 382,000 376,100 377,073 398,967 473,810 Superior 429,759 458,900 476,150 529,157 644,273 643,086 Boulder County 400,883 444,600 447,000 479,360 531,870 642,549 Broomfield 363,124 344,025 365,345 395,972 452,486 512,695 Erie 321,222 340,000 353,000 353,038 424,348 486,714
U/C at Year End – Attached Dwelling 2017 2018 2019 2020 2021 2022 Boulder 47% 42% 39% 39% 62% 42 Louisville 40% 45% 68% 68% 100% 25 Lafayette 53% 64% 52% 55% 91% 47 Longmont 70% 31% 50% 78% 81% 45 Sub Plains 59% 25% 33% 53% 92% 44 Superior 84% 55% 41% 70% 76% 50 Boulder County 56% 41% 45% 49% 60% 32

This representation is based in whole or in part on data supplied by IRES MLS for the time period above
Jan 6th, 2023 PRICE RANGE # SOLD # ON MARKET MONTHS OF INVENTORY # LISTED 4 TH QTR 2022 $0 - $99,999 0 0 0 0 $100,000 - 149,999 2 0 0 0 $150,000 - 199,999 3 0 0 0 $200,000 - 249,999 6 3 2 3 $250,000 - 299,999 3 0 0 0 $300,000 - 349,999 16 2 0 1 $350,000 - 399,999 19 8 1 6 $400,000 - 449,999 23 12 2 8 $450,000 - 499,999 29 17 2 8 $500,000 - 549,999 13 10 2 4 $550,000 - 599,999 14 10 2 4 $600,000 - 649,999 12 5 1 4 $650,000 - 699,999 13 0 0 0 $700,000 - 749,999 8 5 2 2 $750,000 - 799,999 2 2 3 1 $800,000 - 999,999 14 9 2 5 $1,000,000 - 12 10 3 5 TOTALS: 189 93 1.48 51
Prepared by RE/MAX of Boulder, Inc. For Boulder County on

2nd Qtr
and 4th Qtr
Change in Attached Dwelling Avg $ from
YTD
YTD Numbers
Change in Attached Dwelling Avg $ from 2nd Qtr YTD and 4th Qtr YTD Numbers
2017 2018 2019 2020 2021 2022 Boulder -2.63% -3.22% -0.53% -10.11% 0.91% 1.37% Louisville 6.43% 4.85% 1.70% 3.76% -0.37% 2.28% Lafayette 2.07% -3.17% -0.93% 1.85% 2.66% 2.08% Longmont 1.07% 0.15% 0.74% 3.83% 0.66% 0.07% Plains -0.89% -1.27% 2.35% 0.09% 1.22% -3.28% Superior 6.82% 1.84% -6.52% 6.56% -0.77% -1.23% Boulder County -1.19% -2.41% 0.07% -3.14% -0.59% 0.03% Broomfield 1.63% 1.15% -0.21% 5.79% 3.82% -0.39% Erie 13.27% -0.28% -0.20% 2.18% -1.56% 3.78%

2. Boulder, CO
According to data from the Federal Housing Administration (FHA), the home price index in Boulder, Colorado rose by more than 277% from 1997 through 2021. Additionally, home prices in Boulder have been relatively stable during that 25-year period, with a 1% chance of a 5% or more drop in home price within a decade of buying.

