Q1 2025 • STAR VALLE Y, W YOMING


Q1 2025 • STAR VALLE Y, W YOMING
In Q1 2025, the Star Valley, Wyoming real estate market showed a mix of growth and contraction. Overall sales volume dipped by 8%, dropping from 62 transactions in Q1 2024 to 57. Despite this, the average sale price for all property types rose slightly by 2% to $420,508, and the median sale price jumped by 37% to $377,500 indicating that while fewer properties sold, they tended to be of higher quality or value. However, total dollar volume decreased by 7%, signaling that fewer high-end transactions may have closed this quarter.
Central Star Valley (11B) remained the most active submarket, with 31 sales and a 4% increase in dollar volume. This area also saw a major rise in median prices, more than doubling year-over-year.
Northern Star Valley (11A) had a 17% increase in sales but experienced steep declines in average and median prices, resulting in a 15% drop in total volume. Southern Star Valley (11C) experienced a 20% decline in sales and a 22% decrease in dollar volume, despite a 26% increase in median pricing.
Single-family homes led the market shift, increasing from 35% to 46% of total transactions. Sales volume for this segment rose 18%, yet both average and median prices fell significantly, down 20% and 15% respectively. Vacant land sales declined 24%, though the average price per parcel increased by 12%. Condo and townhome sales remained inactive for the second consecutive year, and commercial sales held steady in count but dropped 50% in value.
Inventory levels surged active listings rose by 63% across all property types, and single-family listings nearly doubled. Pending sales dropped to zero, indicating a slower transactional pipeline. Days on market increased for homes and commercial properties, while vacant land saw quicker turnover. Altogether, the market appears to be in transition, with increased inventory and shifting buyer behavior likely to shape the coming quarters.
$23.9M
TOTAL DOLLAR VOLUME 7% DECREASE YTD

$614K
AVG SFH SALES PRICE 20% DECREASE YDT
$535K
MEDIAN SFH SALES PRICE 15% DECREASE YTD
57
TOTAL TRANSACTIONS 8% DECREASE YTD
407
ACTIVE LISTINGS 63% INCREASE YTD
SV (14
SV (3
SOUT
SV (12


SOLD LISTED AT $595,000 STAR VALLE Y RANCH
REPRESENTED BY PAT T Y SPEAKMAN
The single-family home segment in Star Valley saw a notable increase in activity during Q1 2025, with sales rising 18% from 22 to 26 transactions. Despite the uptick in volume, pricing trends moved in the opposite direction—average sale price dropped 20% to $614,309, and the median price decreased 15% to $535,000.
Central Star Valley remained the most active subregion, accounting for the
highest number of home sales and total dollar volume, although prices there also declined. This suggests interest in more affordable or mid-range properties. Inventory in this category nearly doubled, jumping 88%, while average days on market climbed 32%, pointing to a cooling pace and potentially more leverage for buyers heading into the next quarter.
NUMBER OF TRANSACTIONS
ACTIVE LISTINGS
TOTAL DOLL AR VOLUME
MINIMUM PRICE SOLD
AVERAGE SALE PRICE
AVERAGE
PENDING TRANSACTIONS MEDIAN
# OF TRANSACTIONS
TOTAL DOLLAR VOLUME

SOLD LISTED AT $399,000 ETNA REPRESENTED BY PAUL KELLY
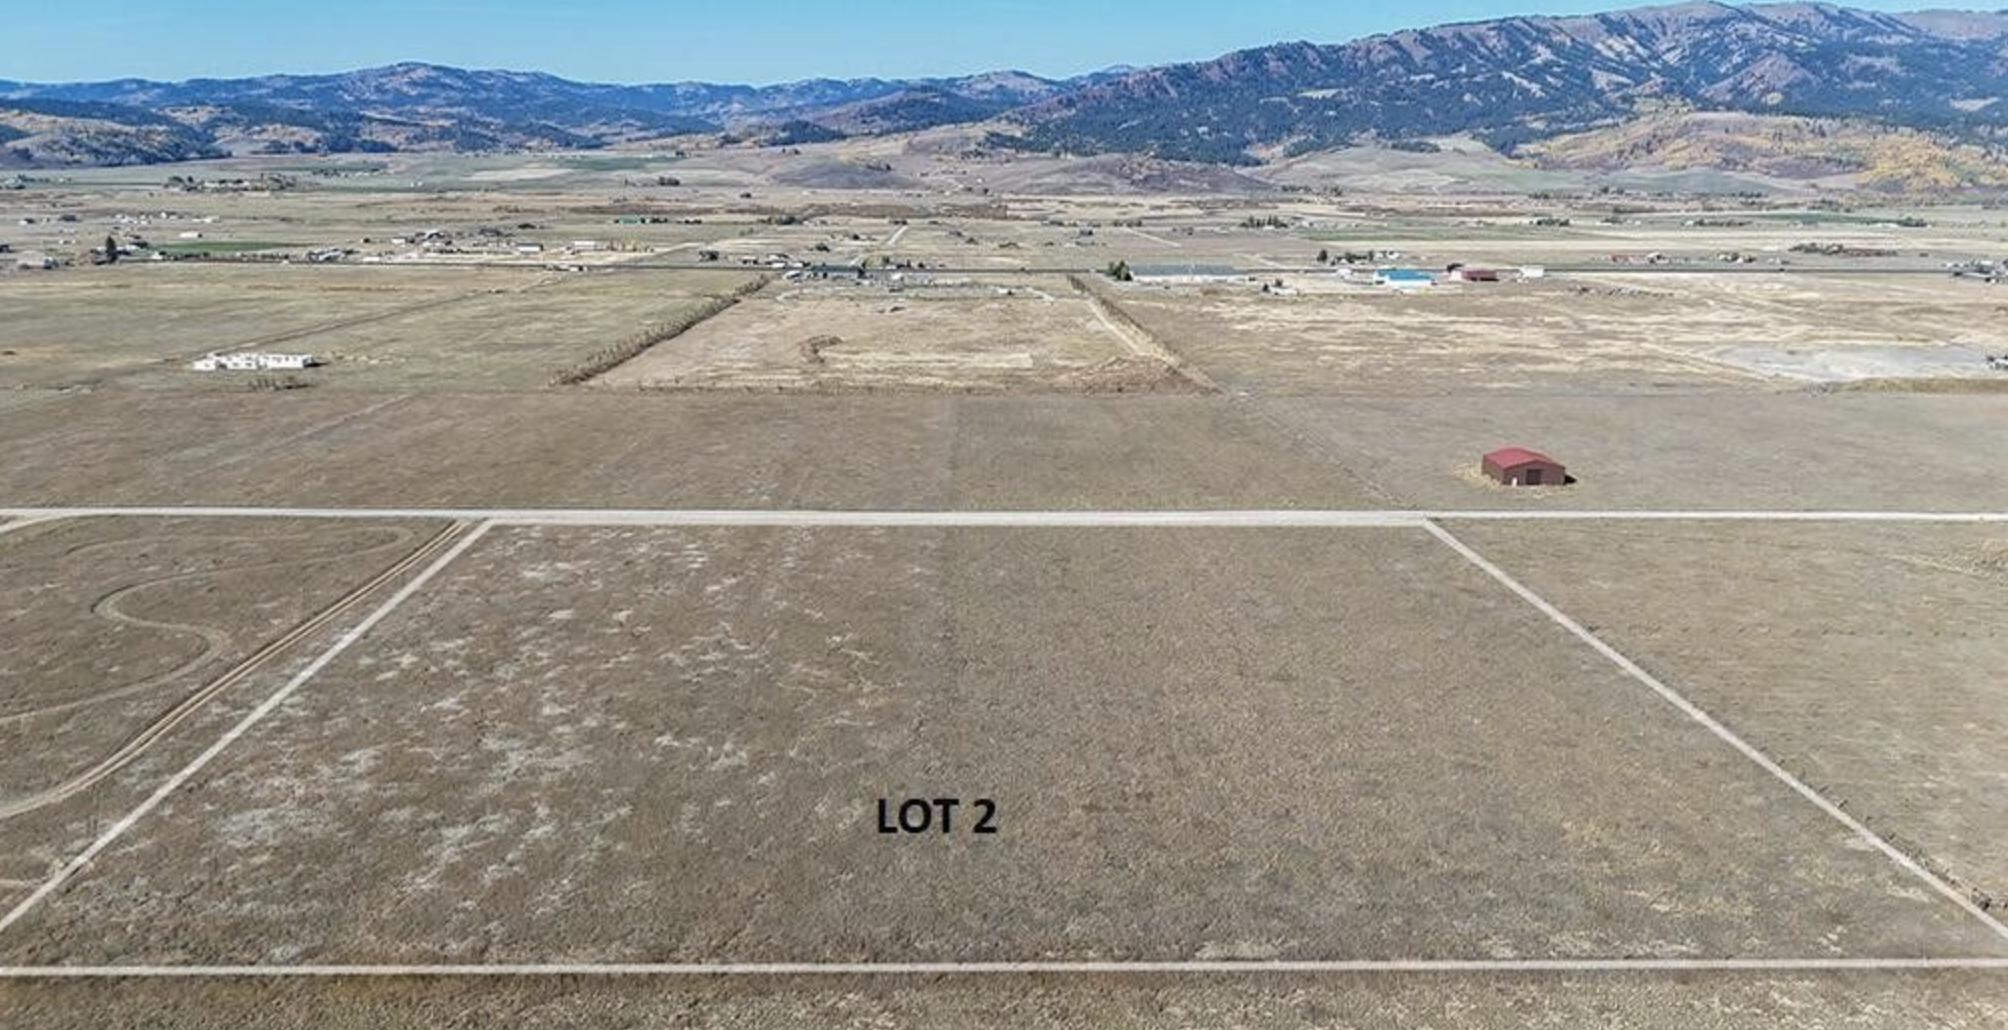
Vacant land sales softened in Q1 2025, with total transactions falling 24% year-overyear, from 38 to 29. Even with the dip in volume, the average sale price climbed 12% to $230,010, reflecting continued demand for quality parcels, particularly in Southern and Central Star Valley. Median pricing held steady with a modest 3% increase, and parcels sold more quickly average days on market fell by 34%. However, with active listings up 18% and pending deals down 62%, it's clear the land market is becoming more saturated. Buyers are still active, but the slower pace of new contracts suggests a more cautious approach compared to last year ’ s rapid land acquisition trend.
TOTAL DOLL AR VOLUME
NUMBER OF TRANSACTIONS ACTIVE LISTINGS MINIMUM
PENDING TRANSACTIONS
# OF TRANSACTIONS
TOTAL DOLLAR VOLUME

Experience the Compass Real Estate difference by working with Jackson Hole’s leading real estate experts. We are a team of trusted advisors working collaboratively to leverage our collective knowledge and expertise to deliver fundamentally different services For us, nothing matters more than creating a legacy of excellence that honors and celebrates our people and the exceptional place we call home To start your search of all active Jackson Hole listings, scan the QR code.