9 minute read
Analyzing the Skewness and Kurtosis of Stocks Philippe Tok

from JOURNYS Issue 12.1
by JOURNYS

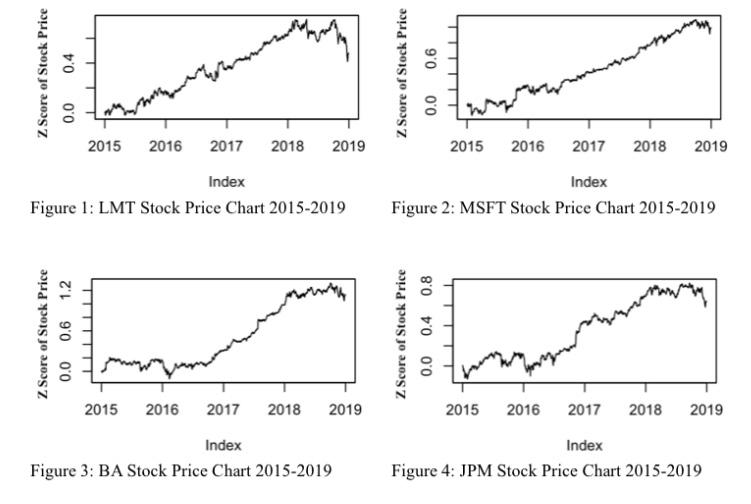
Analyzing the Skewness ANALYSIS OF DATA and Looking at the stock data provided by Yahoo Finance [1], corporations ranging from LMT (Lockheed Martin), MSFT (Microsoft), TWTR (Twitter), DIS (Disney), BAC (Bank of America), Kurtosis GM (General Motors), BA (Boeing), and JPM (JPMorgan) can be seen to have participated in fairly different industries. To have a fair comparison of the stocks price changes of of Stocks these varying companies the stocks daily price changes were recalculated into the z scores (the amount of standard deviations from the mean price of the individual companies stock price over the 4 year period). When looking at the charts displaying the price of the stocks by: Philippe Tok based on daily price changes, there seems to be a clear and strong positive trend in recent years (around the beginning of 2017) showing growth in basically every company. However, at the onset of 2019, there seems to be a slight dip within the price of every corporation observed as shown in Figures 1, 2, 3, and 4.
abstract Many people all over the world attempt to profit from the stock market using a plethora of strategies. The statistical concepts of skewness, kurtosis, and the normal distribution model can be used to analyze stocks. The standard model, which is pertinent to the analyses of both skewness and kurtosis, is the idea that a normal distribution of data will have means and medians that are one of the same while 68% of the data falls into 1 standard deviation from the mean, 95% of the data will fall within 2 standard deviations of the mean, and 99.7% of the data will fall within 3 standard deviations of the mean, which is all neatly displayed in a symmetrical bell curve. On one hand, skewness is essentially the measure of asymmetry within a data set and which side of the median contains the most values that are distorting the distribution the most from the normal model. While on the other hand, kurtosis is used to gauge the extremities of the tails of data distributions. Using these methods of statistical analysis and R studio, I analysed a series of different stock returns to uncover their relationships.
Advertisement
In general, it could be assumed that the economy from 2016 to early 2018 was experiencing a steady growth, which then started to plateau around mid-2018, leading to a decline in growth around late 2018 to early 2019. Interestingly, this plateau in growth and eventual decline coincides with the start of the trade war between the U.S and China, which could signify that the tariffs enacted by the governments most likely had a somewhat significant effect on the growth of the economy.
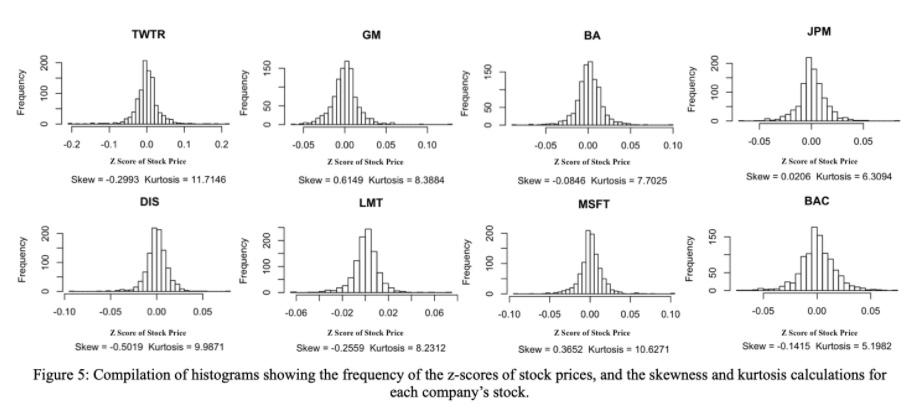
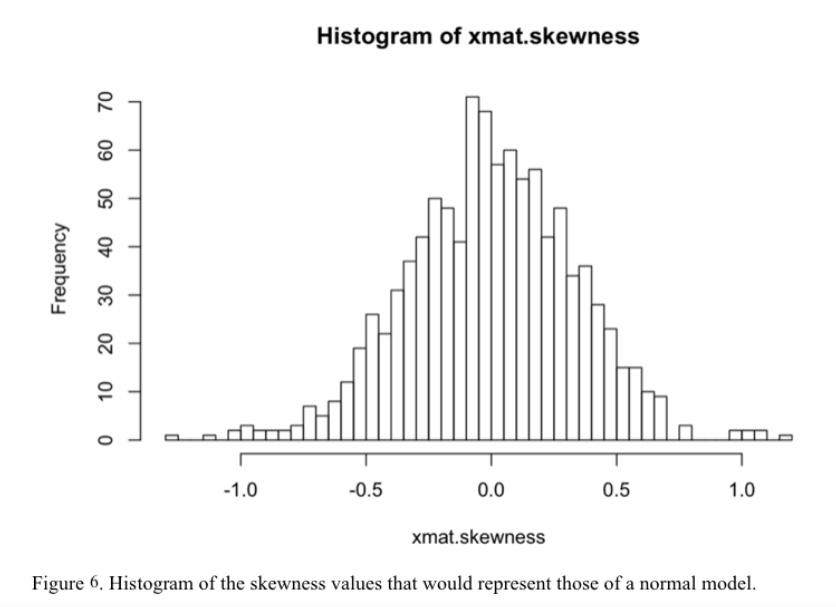
When examining the stock data of the companies individually, by looking at figure 5, a majority of the companies’ stock returns appear to have skewnesses that fall within the normal distribution (a skewness value between -0.5 and 0.5 as shown in Figure 6) with the exception of GM and DIS.
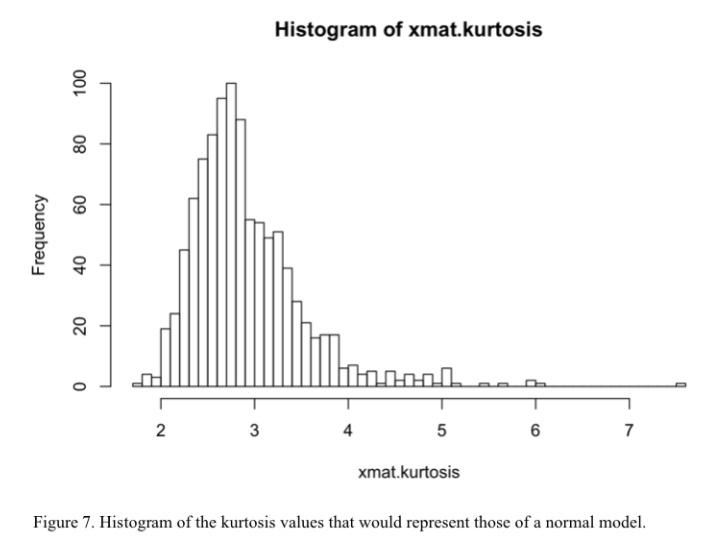
According to Chen (2019), the director of trading & investing content at investopedia, this would indicate that the majority of these stocks will be more predictable since “investors commonly use standard deviation to predict future returns, but standard deviation assumes a normal distribution.” [2] Furthermore, the stocks with the lowest skewness such as JPM and BA would most likely be the safest ones to invest in as they would be more predictable. However, a more negative skewness would also signal a higher risk in investing as it shows that a certain stock has a higher likelihood of having negative returns since there are more values on the negative side. In contrast to the skewnesses that tend to follow the normal distribution, the kurtosis of these stocks is rather far off from the normal distribution (which is a value less than four or five, as shown in Figure 7).
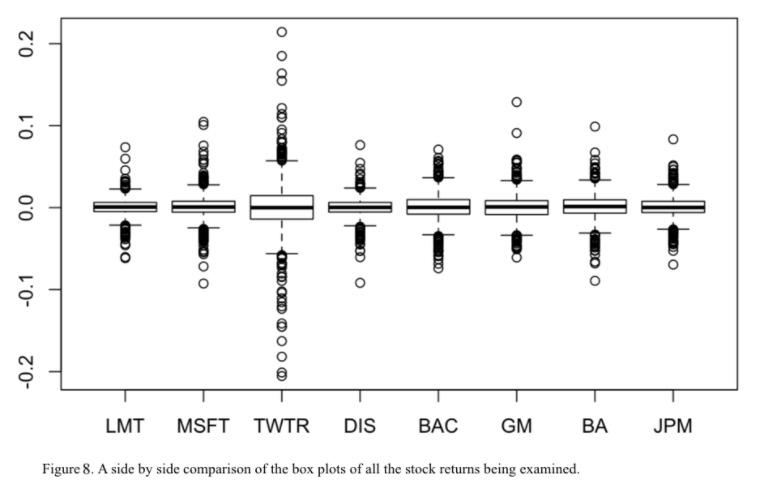
TWTR, who is relatively new to the public market, appears to have the most varied data, which is not only displayed by its larger interquartile ranges but also its extremely spread out outliers. Additionally, boxplots that have more asymmetrical outliers also tend to showcase higher skewnesses in the direction of these heavier outliers. One graph that also reflects most of the data’s kurtosis and skewness would be the Q-Q plots which show that all of the stocks deviate from the normal
The boxplots of the different stocks side by side in Figure 8 make it obvious that they all contain outliers, as reflected by their large kurtosis.
According to Kenton, former managing editor of Kapitall Wire, “high kurtosis of the return distribution implies that the investor will experience occasional extreme returns” [3], which implies that investing in stocks with smaller kurtosises such as JPM and BAC will most likely involve lower risks with lower returns while investing in stocks with larger kurtosises such as MSFT, DIS, and TWTR will include higher risks with a chance of higher returns.
distribution due to their tails. However, the data points almost symmetrical reflection across the normal distributions line imply a relatively low skewness, since the higher outliers are being balanced by the lower ones, which is exactly the case when calculating the skewness. Examination of all these stocks from 2015-2019 has made apparent that even though some factors are pointing the stocks data to normal distributions, the majority of the evidence exhibits the opposite. The fact that stock returns don’t mirror a normal model is most likely one of the reasons why price forecasts aren’t very precise since many prediction models use a normal model.
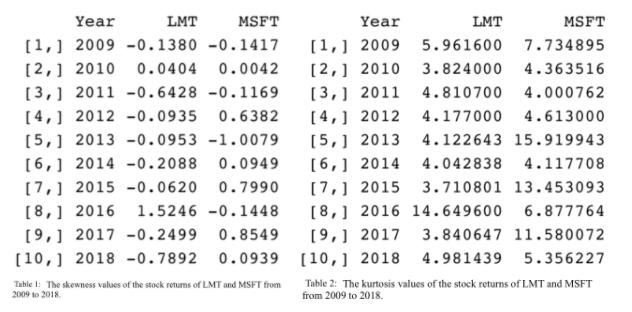
The fluctuation of skewness and kurtosis measurements of LMT and MSFT over time from 2009-2019 are also something to consider. Table 1 shows the data recorded for the skewness measurements of both stocks depending on the year, while Table 2 shows the kurtosis of both stocks over the same period of time.
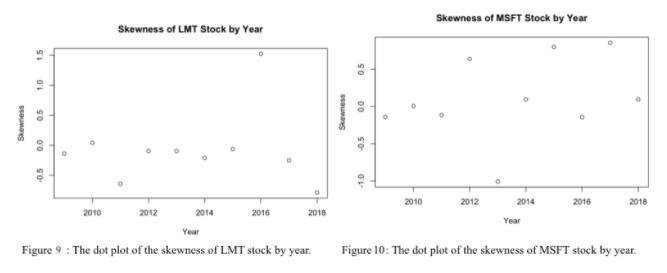
For the skewness of LMT, the average value is -0.0715 and its standard deviation is 0.6198 compared to MSFT’s average skewness of 0.1074 and standard deviation of 0.5527. When considering skewness on its own, LMT’s stock returns’ distribution is closer to having a normal distribution compared to that of MSFT. Interestingly, LMT on average has a negative skewness, while MSFT has a positive average skewness value. This indicates that MSFT stocks through 2009-2019 have a better likelihood of having higher positive returns since the positive skewness reveals that more values fall on the right of the median. Whereas LMT’s returns possess a negative skew suggesting that more values fall on the left of the median giving a higher possibility of receiving a lower return. When examining the standard deviations it appears that MSFT has less varied stock returns compared to LMT’s, although a close inspection of the dot plot showing the skewnesses over time, shown in Figure 9 and 10, reveals that the skewness data of LMT might be less varied and that the main cause for the larger standard deviation is the huge outlier in 2016. Nevertheless, in general, it’s evident that skewness over time varies quite a bit, especially considering that both stocks contain relatively high standard deviation.
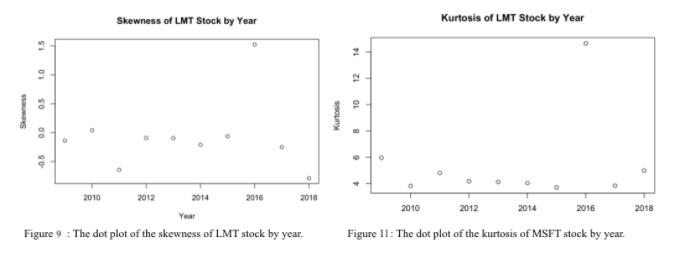
In Table 2, the means and standard deviations of the kurtosis of both LMT and MSFT were also calculated. The average kurtosis of LMT over the 10 year period is 5.4121 and its standard deviation is 3.3188, while the average kurtosis of MSFT is 7.8017 and its standard deviation is 4.3329. Looking at these calculations, the average kurtosis of LMT is evidently smaller than that of MSFT’s, disclosing the fact that MSFT’s stock returns every year contain some more extreme values. Meanwhile, LMT’s average kurtosis of 5.4121 conveys the fact that the distribution of LMT returns is close to the normal model; it also emphasizes that there are less extreme values within the data set. Considering that on average MSFT is seen to have heavier tails, ergo more variance and extreme values, therefore it’s no surprise that MSFT has a larger standard deviation since it would be predicted that the prices would vary over time and so the kurtosises would also vary a lot over time. One fascinating aspect is that the skewness plot of LMT and kurtosis plot of LMT shares a lot of similarities; the main similarity being the huge increase in both values during the years of 2016.
This phenomenon can be explained as LMT’s stock experiences a large increase in price during that time since the skewness is positive, while the large increase in price during certain days created a large tail to the right, hence the reason why the kurtosis value is so large. This huge increase in a short period of time is corroborated by the fact that LMT closed a corporate merger with Leidos Holdings, granting Lockheed Martin 1.8 billion in cash. [4] Overall, the relatively high standard deviations of the kurtosises would lead to the conclusion that the kurtosis values, just like their skewness values, also experience a fair amount of change over time.
DISCUSSION
After examining both the skewness and kurtosis of both stocks over time, it’s fair to say that these values do fluctuate by some degree over time and that while some stock return distributions might get close to emulating the normal distribution, they’re still off by a magnitude. These variations would most likely explain why predicting stock market prices and their returns could sometimes have quite a large margin of errors. Even some of the best prediction models stocks will always have some unpredictability. However, when analyzing two stocks individually, it’s a safe assumption that LMT will provide a safer investment yielding smaller returns, due to its less extreme kurtosis and smaller negative skewness. On the other hand, MSFT has a more varying return increasing the risk, however considering its positive skewness and larger kurtosises it could also provide larger returns. To determine which stock to invest in, the trade-offs of risk and returns need to be made.
Yahoo Finance. (n.d.). Yahoo Finance - Stock Market Live, Quotes, Business & Finance News. Retrieved November 24, 2019, from https://finance.yahoo.com/.
Chen, J. (2019, October 30). Learn About Skewness. Retrieved October 30, 2019, from https://www.investopedia.com/terms/s/ skewness.asp.
Kenton, W. (2019, September 12). Kurtosis. Retrieved October 30, 2019, from https://www.investopedia.com/terms/k/ kurtosis.asp.
Lockheed Martin. (2016, August 16). Lockheed Martin Successfully Closes Transaction To Separate And Combine IT And Technical Services Businesses With Leidos. Retrieved July 15, 2020, from https://news.lockheedmartin.com/201608-16-Lockheed-Martin-Successfully-Closes-Transactionto-Separate-and-Combine-IT-and-Technical-ServicesBusinesses-with-Leidos


