15 minute read
Organization, Miroslav Pristavka, Hristo Beloev, Pavol Findura, Maciej Kubon, Grzegorz Dzieniszewski

from Agricultural, Forest and Transport Machinery and Technologies (ISSN: 2367– 5888) vol VIII, 2021
by kangalov

Analysis of Production Equipment in a Production Organization
Miroslav Pristavka, Hristo Beloev, Pavol Findura, Maciej Kubon, Grzegorz Dzieniszewski
Advertisement
Abstract: In the present paper we dealt with the issue of quality improvement in the production organization ZVS – Armory. According to the developed methodology, we investigated the capability of the production equipment. In the first measurement, all values were within the tolerance range, but they were not subject to normal distribution and were mainly in the upper tolerance range. Corrective measures had to be taken. The corrective measures were a change in production technology. On the next measurement, the measured values were in order, and it was possible to proceed to the calculation of the capability indices of the production equipment. The calculated values of the capability indices of the production equipment were Cm = 5,900 and Cmk = 5,869. Keywords: quality improvement, measuring equipment capability, manufacturing equipment capability, manufacturing process capability
INTRODUCTION
In today's highly competitive era, organizations must withstand pressures and threats in both national and international markets. The successful operation of each of them, to a large extent, depends on the speed and ability to adapt to the demands of the market. Demands for product features from customers are becoming increasingly important. One of the most important characteristics of an organisation, therefore, is the ability to adapt to and meet the wishes and requirements of individual customers. (Bujna et al., 2019
To maintain and improve quality, organisations need to know and use appropriate quality tools. By using effective tools, they can improve their market position, increase their competitiveness, productivity and, most importantly, reduce production costs. At the same time, the rapid development of technology makes it difficult for organisations to maintain quality at an appropriate level. The quality management process must therefore be carried out throughout the entire production process. Quality management is the way in which organisations will significantly increase customer satisfaction and also their market share. (Hučka, 2017)
MATERIALS AND METHODS
Nowadays, every organization needs to produce quality products, so the emphasis is on quality monitoring and quality improvement. By implementing various statistical methods, organisations can monitor and evaluate production processes and thus provide customers with proof that their requirements are being met. It is also important to improve the quality of production processes already in place and to introduce measures that can improve these processes. (Paulová, 2013)
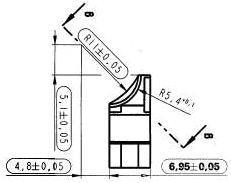
The aim was to propose suitable quality management tools that will ensure quality improvement in the production process in the ZVS – Armory organization. The proposed methods were implemented in the production process of CNC machining of the selected part extractor on the dimension 6,95+0, ^mm.
The component being tracked is the extractor, which is part of the extractor system, a semi-automatic submachine gun. The dimension to be monitored is the width of the component (Fig. 1) , with a customer request for a tighter tolerance
Fig. 1 Cutaway of the manufacturing drawing of the extractor component Capability of production equipment Characteristics of the production facility
When detecting the fitness of a production machine, the CNC Feeler VMP 30A, it is necessary to select a control character. The control characteristic will be the width of the part of the extractor 6.95+0.03. It is also necessary to determine the boundary conditions viz: data of the production facility, process data, details of where the production facility is located.
The boundary conditions will be documented in the measurement record table.
Data acquisition
In the case of sampling, the production equipment shall be adjusted so that the measured values are in the centre of the tolerance field. Fifty samples shall be taken from the production process for testing. The samples shall be taken consecutively and shall be marked in order. The measured values shall be entered in the evaluation sheet, table, in the order in which they were taken from the plant. The individual values will then be plotted on a single value chart (Hrubec, 2016).
Evaluation of measured values
In the next evaluation procedure, it will be necessary to see if the measured values plotted on the individual value card are not arranged in a chaotic way or if these values show any trend. Should either of these possibilities occur, the process will have to be declared incompetent. Should the process be incapacitated, corrective action will need to be taken and the measurement will need to be repeated. Should neither of the possibilities be demonstrated and the measured values visually follow a normal distribution, the process may continue
Determination of the stability of measured values
From the measured values, artificial subgroups of the range n = 5. For each subgroup, the average value is calculated Xi and the standard deviation si (Hrubec, 2016).
Average character value Xi in a subgroup is calculated according to the equation:
for i = 1, 2, ... k and for j = 1, 2, ... n, where: i – serial number of a subgroup, j – serial number of a measured value in a subgroup, k – number of subgroups, n – extent of subgroup, Xij – measured value in i-th subgroup.
Standard deviation in the subgroup:
Calculated values and are plotted on the diagram on and obtain appropriate scales for both types of diagrams. The outliers must first be calculated

The overall average value is then calculated according to the equation:
(3)
and the average standard deviation :
Determination of cut-off values for the mean and standard deviation
The mean position of the process under study can be considered stable if the individual values of do not exceed the upper limit of the intervention , to be calculated:
or lower limit of intervention to be calculated:
If the largest observed standard deviation of the groups of five less than 2,1. s, then the standard deviation can be considered stable.
Stability tests are performed to ensure that there are no disturbing elements affecting the process. If the means and standard deviations lie within the limiting poly, statistical evaluation can begin. If the values are outside the field, the cause must be found, eliminated and the measurement repeated
Calculation of the capability indices of production equipment Cm a Cmk
To determine the capability index of a production facility Cm and the corrected index of capability Cmk the average of all measured values must be calculated and determine the standard deviation of all measured values . The average value shall be calculated:
Where: i = 1,2, ...N, Xi - i-th value of the measured character
Standard deviation is calculated:

Where: N – the total number of measured values Capability index of the production facility Cm is then calculated:
Where: T – tolerance, USL, LSL – upper and lower tolerance values
The minimum requirement for the capability index of a production facility shall be .
Corrected index of production equipment Cmk which takes into account the position of the mean value is calculated according to the equations:
The smaller value of the two formulas is used for evaluation. The minimum requirement for the corrected capability index of a production facility shall be Cmk > 1,61
RESULTS Monitoring, measurement and analysis
The organization has planned and implemented measurement, data collection and validation through a quality management system to ensure performance, to ensure the conformity of the manufactured parts to the customer's specific requirements. To ensure continuous improvement of the effectiveness of the quality management system, the organisation obtains information from customers and consumers of the final products.
Capability of production equipment Characteristics of the production facility
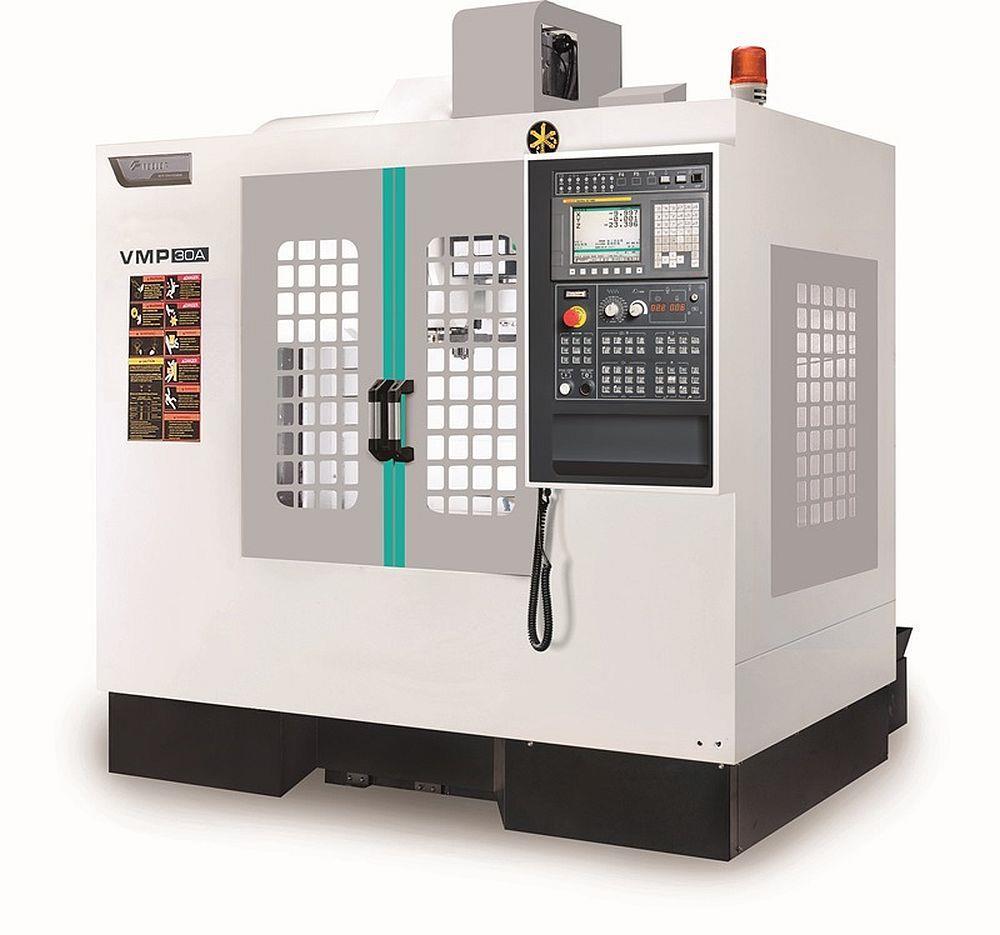
The manufacturing process of the investigated component was carried out on a CNC machine called Feeler VMP 30A (Fig. 2), which is shown in the figure. It is a vertical machining centre of the VMP series. The dimensions of the worktable are 890 x 420 mm; the maximum load of the work table is 300 kg. The maximum spindle speed is 10 000 min-1. The width of the machine is 2100mm; the maximum height is 2370mm; the weight is 3300kg.
There are currently 4 such CNC machines in the company and they are used for the production of both simpler and more complex parts.
The production equipment is a Feeler VMP 30 A CNC milling machine, and the selected control feature was the width of the part to be monitored, the extractor. The boundary conditions were determined, which are given by in the table. (Jančichová, 2020)
Fig. 1 Vertical CNC machine Feeler VMP 30A
Data acquisition
The production process was sampled every 3 hours during the production process. The samples were numbered in the order in which they were taken. The measured values were entered in a table, which was also used to create a tab of the individual values Table 1 Form for evaluation of the suitability of a production equipment
ZVS – Armory Form for evaluation of the suitability of a production equipment
Part: Extractor
Machine: Feeler VMP 30 A Controlled dimension: 6.95 +0.03 -0.03 mm
Marginal conditions Performance: 7.5 kW Voltage: 380 V Noise: 68 – 70 dB Tools: Automatic tools
Temperature: 24.5 ˚C Speed: 10 000 min -
Humidity: 50%
Measured values Shift: 3.6 mm.min-1 Cooling emulsion: Hydrol ZUBORA
No. mm No. mm No. mm No. mm No. mm
1 6.954 11 6.958 21 6.973 31 6.978 41 6.967
2 6.956 12 6.959 22 6.965 32 6.965 42 6.974
3 6.957 13 6.964 23 6.963 33 6.967 43 6.974
4 6.957 14 6.965 24 6.967 34 6.974 44 6.974
5 6.956 15 6.966 25 6.962 35 6.968 45 6.974
6 6.958 16 6.969 26 6.961 36 6.975 46 6.973
7 6.958 17 6.962 27 6.962 37 6.978 47 6.969
8 6.961 18 6.966 28 6.966 38 6.982 48 6.97
9 6.959 19 6.979 29 6.966 39 6.976 49 6.972
10 6.96 20 6.975 30 6.965 40 6.969 50 6.967
Values measured card
Evaluation of measured values Investigating the regularity of measured values
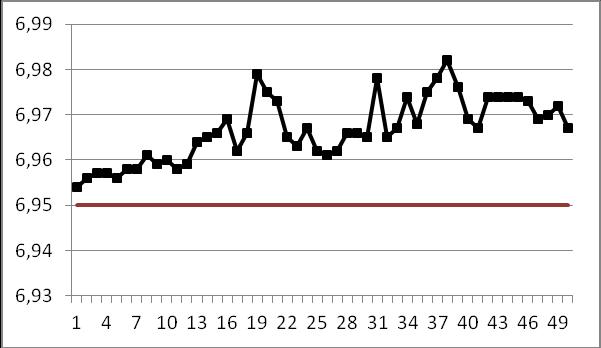
From the table of individual values (Tab. 1), it was assessed that the measured values are chaotically arranged, located in the upper part of the tolerance field and do not follow a normal distribution. Therefore, after consultation, corrective action was taken and the measurements were repeated. The corrective measures were a change in the production technology of the component.
Data recovery
After corrective action, a change in technology, 50 manufactured parts were taken out of the process again, at a time interval of 3 hours and the measurement was repeated. The measured values are shown in tab. 2.
Evaluation of measured values
It could be evaluated from the form of the individual measured values that the measured values are not subject to any trends, are not chaotically arranged and are subject to a normal distribution. It was possible to move on the determination of stability.
Determination of stability of measured values
From the measured values, subgroups of n = 5 were formed, and for each subgroup, the mean Xi and standard deviation Si were calculated according to Eq. The results are presented in the table. Table 2 Form for evaluation of the suitability of a production equipment
ZVS – Armory Form for evaluation of the suitability of a production equipment
Part: Extractor
Machine: Feeler VMP 30 A Controlled dimension: 6.95 +0.03 -0.03 mm
Marginal conditions Power: 7.5 kW Voltage: 380 V Noise: 68 – 70 dB Tools: Automatic tool
Temperature: 24.5 ˚C Speed: 10 000 min -1 Shift: 3.6mm.min-1
Cooling emulsion: Humidity: 50% Hydrol ZUBORA
Measured values
No.. mm No. mm No. mm No. mm No. mm 1 6.952 11 6.947 21 6.952 31 6.952 41 6.953 2 6.949 12 6.949 22 6.951 32 6.952 42 6.951 3 6.951 13 6.950 23 6.947 33 6.947 43 6.949 4 6.95 14 6.952 24 6.953 34 6.949 44 6.948 5 6.948 15 6.951 25 6.950 35 6.953 45 6.951 6 6.95 16 6.951 26 6.948 36 6.952 46 6.950 7 6.949 17 6.949 27 6.953 37 6.948 47 6.948 8 6.95 18 6.948 28 6.949 38 6.949 48 6.95 9 6.949 19 6.951 29 6.95 39 6.952 49 6.952 10 6.951 20 6.95 30 6.951 40 6.952 50 6.949
Values measured card
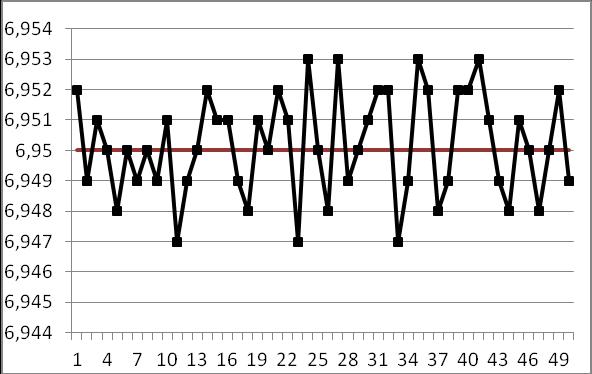
Table 3 Measured values
No. Measured values, mm
X1 X2 X3 X4
X5
1 6.952 6.949 6.951 6.95 6.948 6.95 0.00045 2 6.95 6.949 6.95 6.949 6.951 6.9498 0.00024 3 6.947 6.949 6.950 6.952 6.951 6.9498 0.00055 4 6.951 6.949 6.948 6.951 6.95 6.9498 0.00037 5 6.952 6.951 6.947 6.953 6.950 6.9506 0.00066 6 6.948 6.953 6.949 6.950 6.951 6.9502 0.00055 7 6.952 6.952 6.947 6.949 6.953 6.9506 0.00072 8 6.952 6.948 6.949 6.952 6.952 6.9506 0.00056 9 6.953 6.951 6.949 6.948 6.951 6.9504 0.00056 10 6.95 6.948 6.95 6.952 6.949 6.9498 0.00042
The overall average value was then calculated :
and the average standard deviation :
Determination of limit values for the average value and standard deviation The values for the mean Xi were calculated – the upper limit:
and the lower limit:
The calculated values of Xi and the limiting values of HMZx and DMZx for the average value of Xi are plotted on the X – diagram in the figure.
Fig. 3 X- card
Subsequently, the upper limit of the HMZs hit for the standard deviation si was calculated:
The calculated values of the standard deviation si and the upper limit of the HMZs:

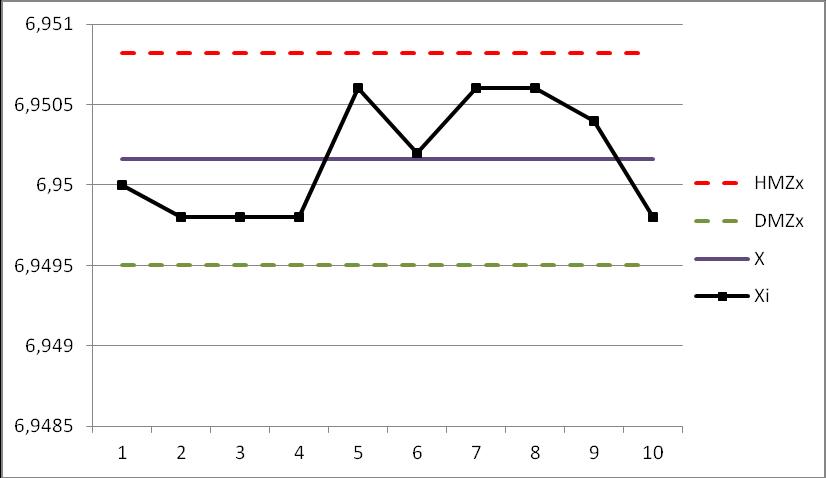
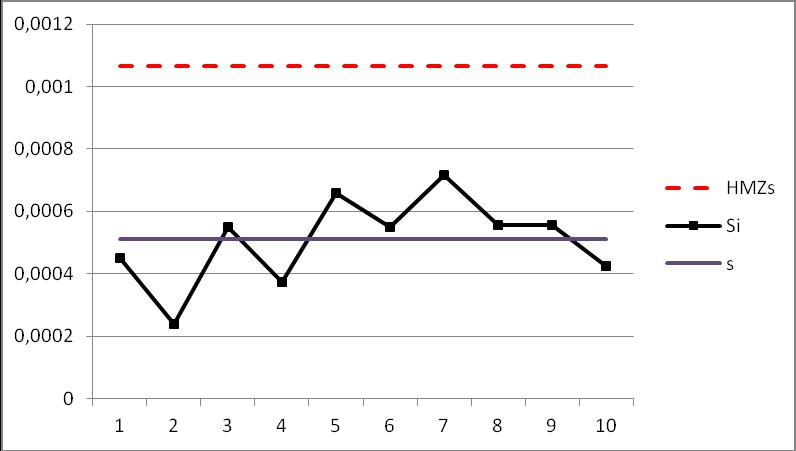
Fig. 4 s- card
The stability tests showed that there were no disturbing elements acting on the process and it was possible to proceed with the calculation of the capability indices of the production facility Cm and Cmk.
Calculation of the capability indices of the production facility Cm and Cmk
To calculate the capability indices of the production facility Cm and Cmk , the average of all measured values XN had to be calculated:
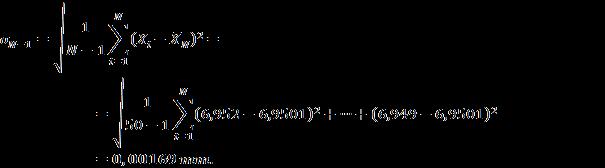
and the standard deviation of all measured values :
It was then possible to proceed to the calculation of the capability index of the production equipment Cm:
and corrected index Cmk:


CONCLUSION
The capability of the production equipment of the Feeler VMP 30 A CNC machine was evaluated. Fifty samples were taken, labelled in the order in which they were taken. In the first measurement, the measured values were within the tolerance range, but after plotting the values on the chart, it was found that the values did not follow a normal distribution. Corrective action had to be taken and this was to change the manufacturing technology of the extractor component. On re-measurement, the measured values were again recorded on the form and recorded on the individual value card. The values were subject to a normal distribution and so could be divided into artificial subgroups, the mean Xi values calculated and the standard deviation si for each subgroup. The joint mean value of X and the mean standard deviation of s were then calculated. Before applying the mean values to the X - card, the upper limit of the HMZx hit and the lower limit of the DMZx hit were calculated. Also, the upper hit limit for the standard deviation of the HMZs was calculated and the values of the standard deviation of si were plotted on the s - card.
From the previous results, it was possible to move on to the calculation of the manufacturing equipment capability indices Cm and Cmk. The requirements for the manufacturing equipment capability indices were met with Cm = 5.900 > 1.66 and Cmk= 5.869 > 1.67, respectively.
ACKNOWLEDGEMENT
This paper was created with financial support of the grant project VEGA no. 1/0102/21 - Reducing chemical loads and degradation of agricultural and forestry soils by selecting appropriate agri-technology with regard to climate change.
This paper was created with financial support of the grant project KEGA no. 016SPU4/2021 - Implementation of modern educational approaches and tools to enhance creativity and practical skills of graduates with special focus on agricultural and forestry science using.
REFERENCE
[1] Bujna, M., Kotus, M., Matušeková, E., (2019). Using the DEMATEL model for the
FMEA risk analysis. In System Safety: Human - Technical Facility - Environment. 1, 1 (2019), p. 550--557. ISSN 2657-5450. [2] Hrubec, J., Cservenáková, J., (2016). Engineering of quality production. Publisher SUA,
Nitra. ISBN 978-80-552-1536-5. [3] Hučka, M., (2017). Models of company processes. C.H. Beck, Praha, p. 512. ISBN 97880-7400-468-1. [4] ISO 9000: 2015 - Quality management system, Basic vocabulary. [5] ISO 9001:2015 - Quality management system. Requirements. [6] Jančichová, K., (2020). Improving the quality of the production process in the selected organization. [Diploma thesis], Nitra, 2020. [7] Kangalov, P., (2013). Methods and diagnostic tools. Ruse: University of Ruse Angel
Kanchev, ISBN 978-619-90013-3-2. [8] Kangalov P., (2013) Determining the initial structural characteristics of shaft-slide bearing of internal combustion engine during sliding friction. Selskostopanska tehnika, 2013, Vol.50, No 1, pp. 14-21., ISSN: 0037-1718 [9] Mateides, A., (2006). Management of quality. ISBN 80-8057-656-4, [10]Nikolov, M., Kangalov, P. (2012). Benefits from maintenance and repair in utilization of resources. Mendeltech international 2012. International scientific conference, Brno..
ISBN 978-80-7375-625-3
[11]Nikolov, M., Kangalov, P., (2018). Total Productive Maintenance as Quality Providing
Tool for Repaired Machines. // Proceedings – Agricultural Machinery, Year II, Vol. 1/3,
June 2018, pp. 40 – 42, ISSN: 2535-0269 (Print), ISSN: 2535-0277 (Online) [12]Paulová, I., (2009). Approaches to quality management in educational organization/schools. Methodological- pedagogical centre, Bratislava, ISBN 978-808052-346-6. [13]Paulová, I., (2013). Complex quality management. Iura Edition,Ltd., Bratislava. ISBN 978-80-8078-574-1. [14]Závadský, J., (2004). Process management in managerial practice. SP Synergia, Trnava.
ISBN 80-968734-8-2.
CONTACTS
Miroslav Prístavka, Institute of Design and Engineering Technologies, Faculty of Engineering, Slovak University of Agriculture in Nitra, Tr. A. Hlinku 2, 949 76 Nitra, Slovakia, e-mail: miroslav.pristavka@uniag.sk
Hristo Beloev, Department of Agricultural Machinery, Agrarian and Industrial Faculty, University of Ruse, 8, Studentska Str., 7017 Ruse, Bulgaria, e-mail: hbeloev@uni-ruse.bg
Pavol Findura, Institute of Agricultural Engineering, Transport and Bioenergetics, Faculty of Engineering, Slovak University of Agriculture in Nitra, Tr. A. Hlinku 2, 949 76 Nitra, Slovakia, e-mail: pavol.findura@uniag.sk
Maciej Kuboń, Department of Production Engineering, Logistics and Applied Computer Science, Faculty of Production and Power Engineering, University of Agriculture in Kraków, Poland, email: maciej.kubon@urk.edu.pl
Grzegorz Dzieniszewski, Faculty of Mechanics and Technology of Rzeszow University of Technology in Stalowa Wola, e-mail: g.dzieniszew@prz.edu.pl


