11 minute read
Marian Bujna, Plamen Kangalov, Mitko Nikolov

from Agricultural, Forest and Transport Machinery and Technologies (ISSN: 2367– 5888) vol VIII, 2021
by kangalov

Marian Bujna, Plamen Kangalov, Mitko Nikolov
Advertisement
Abstract: Establishing comprehensive reliability indicators is an important aspect for improving the overall durability of equipment. Comprehensive indicators consist of the determination of reliability indicators such as Mean Time between Failure (MTBF), Failure rate (λ), Mean Time to Repair (MTTR) and availability index (Kp). The objective of this paper was to determine these indices on a selected equipment. The failure modes occurring for the calendar year 2021 were identified. The causes of the failure modes mechanism were identified and a method of fault elimination was proposed. For each failure mode, the length of downtime and repair time in hours were determined. Based on this data, we quantified each indicator. We found that even with high equipment availability, it is necessary to address the reduction of the failure-free indicators, in particular by adopting the proposed measures and consequently by a good preventive maintenance setup. The monitored indicators are also important from an Industry 4.0 perspective, as they are part of key performance indices (KPIs) and contribute to reliability optimization and risk management. Keywords: Durability, Reliability, MTBF, MTTR, Failure Rate, Availability
INTRODUCTION
When manufacturing the machine, the necessary quality is ensured both by the quality of the parts, and by the quality of the assembly of the machine and its units, by finishing methods and other process indicators. The modern level of development of science and technology makes it possible to achieve any indicators of machine reliability. The decision on the need to improve the quality of products should be based on an economic analysis Modern manufacturing industries uses high level of automation with complex machines. The function of automated machines is to achieve higher production rate with better quality (Kolte and Uday A, 2017).
An effective operation of process plant depends on the maintenance practices followed and its operating reliability. In process plants having increasing demand for its product, the effective operation is very important. This must be met by increasing its production. Prior to an increase in production, reliability evaluation and maintenance planning are unavoidable (Kiran et al., 2016).
Creation of new technical systems necessitates the search for solutions aimed at improving their quality, reliability and durability. In this regard, the most important task in their design, manufacture and operation consists perhaps in ensuring the reliability of technical systems. When manufacturing the machine, the necessary quality is ensured both by the quality of the parts, and by the quality of the assembly of the machine and its units, by finishing methods and other process indicators. The modern level of development of science and technology makes it possible to achieve any indicators of machine reliability (Goroshko et al., 2018).
Reliability, availability and maintainability is one of several quality management techniques applied to improving efficiency and productivity on food production lines. It can be applied with other total quality management (TQM) tools, that is, failure mode and effect analysis, Pareto analysis, statistical process control, etc (Defense Science Board, 2007).
Reliability is characteristic of an item, generally designed by R, and expressed by the probability that the item will perform its required function under given conditions for a state time interval. Considered qualitatively, reliability can also be defined as the ability of an item to remain functional (Birolini, 1994).
The term "reliability" is often used as an overarching concept that includes availability and maintainability. Reliability in its purest form is more concerned with the probability of a failure occurring over a specified time interval, whereas availability is a measure of something being in a state (mission capable) ready to be tasked (i.e., available).
Maintainability is the parameter concerned with how the system in use can be restored after a failure, while also considering concepts like preventive maintenance and Built-In-Test (BIT), required maintainer skill level, and support equipment. It is often necessary to decompose these upper level requirements into lower level design-related quantitative requirements such as Mean Time Between Failure/Critical Failure (MTBF or MTBCF) and Mean Time To Repair (MTTR) (Tsarouhas, 2012).
Fulfillment of high demands on the availability and safety of the provided function affects the inherent failure rate itself, as well as the method of operation and maintenance of individual devices (Zajíček, 2015).
Kiran et al. (Kiran et al., 2016), a model for improving plant availability has been proposed. By applying this model, an optimum maintenance schedule for the process plant can be formed. Improvement in availability of plant after employing the optimum schedule was calculated. Results indicate that the methodology is successful in identifying the critical equipment’s and improving the availability of the system.
FMEA methods and FTA fault tree analysis can be used to improve reliability (Bujna and Matusekova, 2018; Carlson, 2012; Mandal et al., n.d.; Markulik et al., 2021; Yazdi, n.d.).
MATERIALS AND METHODS
Partial procedure: Select a subject to track.
The machine is designed for the assembly of ball joints, it is divided into individual step assembly stations. It is divided into 10 stations in which individual steps and assembly checks are carried out.
Table 1 Parameters of the machine
Type: 98300 Power 11 kW Dimensions: lenght 6.600mm; width; 5.900 mm; height 2.700 mm Weight: 5200 kg Tyre pressure: 5.5 - 6.5 bar Tyre working force: max. 420 N Working speed of pneumatic piston: max. 1.5 m.s-1 Total air consumption: 150m3/h Tank capacity: 60 l Hydraulic pressure: 125 bar Hydraulic working force: max. 2.2 kN Total machine power: 11 kW Machine noise: 74 dB
Select the monitoring period for individual machines - for the calendar year 2021. Monitor the occurrence of faults and their causes. Process the information on the cause of the individual faults and break them down into their individual subsystems. Quantify and evaluate the faultiest parts of each subsystem of each machine. Quantify complex reliability indicators of the whole system.
Indicators monitored:
Mean time between failures
MTBF = (1) where: tp - cumulative running time, which means the sum of all running times for thunder consideration, n- number of outages caused by faults.
Fault intensity λ - is the inverse of the mean time between faults. It can also be thought of as the mean frequency of system failures, see relation: λ = (2) Mean Time to Repair MTTR- indicates the average value of the repair time.
MTTR = (3)
Where: top - cumulative repair, n - number of failures. Immediate availability factor Kp- expresses the immediate or long-term usability of the object to be repaired. It indicates the probability that at time t the system will be in working order.
Kp = (5)
Using the previous formulas, the following can be determined:
Kp = = (6) where: tp – cumulative operating, t0 – cumulative repair time.
RESULTS AND DISCUSSION
The individual failures are divided into three basic categories (electrical, mechanical and pneumatic. In the article itself, we have focused on the electrical ones listed in Table 2.
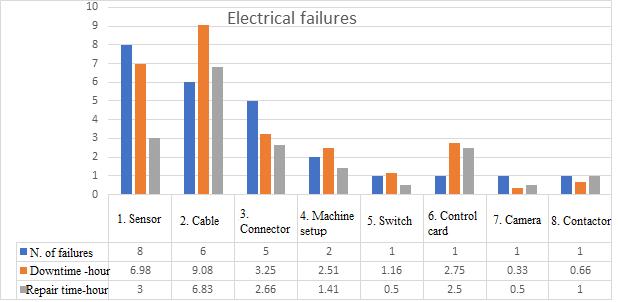
Fig. 1 The most faulty electrical parts on the machine
Fig. 1 shows that the most faulty part of the electrical system on the machine is the encoder. It accounts for up to 32% of the total cause of electrical component failures with the longest downtime caused by wiring faults. There can be several reasons for sensor failures: System congestion at some parts or stations. Sensor lifetime. To the mechanically impaired.
Table 2 Description of electrical failures on the machine
Electrical faults on the machine
Length of downtime [h] Description of the fault Description of the fault rectification
Repair duration [h]
1:10:49 Non-functional auto button Switch/terminator - setting 0:30:00
0:43:22 Unable to start the machine, broken circuit breaker Connector - replacement 0:40:00
0:33:59 Non-functioning cup check Sensor - replacement 0:30:00 0:17:27 does not feed the delineation ring, flashed the sensor on the jaw Sensor - replacement 0:15:00 0:39:21 Station error 3 Sensor - adjustment/cleaning 0:20:00 1:28:41 Station - damaged sensor thread Sensor - replacement 0:30:00 0:33:11 Station 1-camera Camera - create/change
product 0:30:00 1:00:00 Station 4-rotating arm for cup Connector - repair/cleaning 1:00:00 0:34:49 Station 6 can't set the sensors to rings Sensor - adjustment/cleaning 0:35:00 4:40:43 Station 8 - taxi error Cable - repair 2:30:00 0:49:02 jaws for segment control do not stay in the basic position Cable - replacement 0:50:00 0:27:03 Station 5 lifting unit does not extend pin to measure Connector - repair/cleaning 0:25:00 1:03:31 lack of cups in the drum, hopper does not push the cups into the drum Cable - replacement 1:00:00 1:15:50 not enough cups in the drum, the hopper does not push the cups into the drum Cable - replacement 1:00:00 0:30:05 Station 5 broken sensor Sensor - replacement 0:30:00 1:50:39 Station 3-micrometer programming OP panel - machine settings 1:20:00 2:13:16 Station 2 damaged pin presence sensor Sensor replacement 0:15:00 0:35:00 does not take over the cup from the lubricating mandrel Connector - repair/cleaning 0:05:00 0:30:00 Broken connector 4.13 Connector - replacement 0:30:00 0:41:30 Station 7-sequencing separator Sensor - adjustment/cleaning 0:05:00 0:28:21 The vibrating bar on the cups does not turn on Cable - repair 0:30:00 0:40:00 the infeed conveyor is inoperative Contactor - replacement 1:00:00
2:45:54 st.4-functional vibrating leaves Control card - replacement 2:30:00 1:00:06 non-functional regulation of vibration blades Cable - repair 1:00:00 0:40:26 measurement throws out a lot of OK parts Machine setup 0:05:00
Table 3 Calculations of reliability indicators of electrical components of the machine
Elements of the system
Sensor Cable Connector Machine setup Switch Control card Camera Contactor
MTTR Kp
325 0,003 0,375 0,999 433,3 0,0023 1,138 0,997 520 0,0019 0,532 0,999 1300 0,00076 0,705 0,999 2600 0,00038 0,5 1 2600 0,00038 2.5 0,999 2600 0,00038 0,5 1 2600 0,00038 1 1
Table 3 shows that all facilities have a high availability factor. Despite the high availability, it is necessary to address the reduction of the availability indicators
On the machine, we propose, due to the observation of faults in the electrical part, to develop statistics on the lifetime of individual types of sensors used on the assembly machine due to the deteriorating quality of individual sensors and to create a market survey for possible cooperation with another supplier of individual sensors. Furthermore, I propose to develop a workshop to optimise the maintenance tasks and to review the individual steps with operators, maintainers and technicians. To increase sensor fouling that causes unnecessary downtime, I propose to optimize the cleaning steps in the TPM document that will focus on cleaning and maintenance of the sensors. The proposed steps may result in an increase in the cost of procuring a new vendor for electronic sensors or purchasing new cleaning products for operators but there should be a noticeable increase in uptime issues and a reduction in overall downtime.
CONCLUSION
Mean time between failure (MTBF), mean time to failure (MTTF) and mean time to repair (MTTR) are the three commonly used key maintenance performance indicators (KPIs). Indicators act as a delay indicator that provides an overview of past events. In this way, they enable proactive measures and help predict future events. The setting of key maintenance performance indicators (KPIs) and key risk indicators (KRIs) is important in terms of a proactive approach to management not only in reliability but also in risk management. This is also an important feature of Industry 4.0. The MTBF needs to be kept as high as possible to make the system more reliable. This can be achieved by optimizing preventive maintenance. MTTR needs to be kept as short as possible to reduce equipment downtime. This can be achieved by optimising preventive maintenance. The key is to identify all failure modes The failure rate λ is the number of failures in a component or piece of equipment over a specified period. It is important to note that the measurement excludes maintenance-related outages. In industrial applications, the failure rate represents past performance based on historical data. But in engineering design, it is also important to predict failure rates.
The availability coefficient is an operating parameter. We found the device to be available at a very high level (almost 100%).
REFERENCES
[1] Birolini, A., 1994. Quality and Reliability of Technical Systems. Quality and Reliability of Technical Systems. https://doi.org/10.1007/978-3-662-02970-1 [2] Bujna, M., Matusekova, E., 2018. New trends by FMEA, RAM-Verlag. ed. [3] Carlson, C., 2012. Effective FMEAs: achieving safe, reliable, and economical products and processes using failure mode and effects analysis. [4] Defense Science Board, 2007. Report of the Defense Science Board Task Force on
Developmental Test & Evaluation [WWW Document]. URL http://purl.access.gpo.gov/GPO/LPS110797 (accessed 4.7.22). [5] Goroshko, A., Royzman, V., Zembytska, M., 2018. Quality and Reliability of Technical
Systems: Theory and Practice. [6] Kiran, S., Prajeeth Kumar, K.P., Sreejith, B., Muralidharan, M., 2016. Reliability
Evaluation and Risk Based Maintenance in a Process Plant. Procedia Technology 24, 576–583. https://doi.org/10.1016/J.PROTCY.2016.05.117 [7] Kolte, T.S., Uday A, 2017. Machine Operational Availability Improvement by
Implementing Effective Preventive Maintenance Strategies-A Review and Case Study.
International Journal of Engineering Research and Technology 10, 700–708. [8] Mandal, S., applications, J.M.-E. systems with, 2014, undefined, n.d. Risk analysis using
FMEA: Fuzzy similarity value and possibility theory based approach. Elsevier.
[9] Markulik, S., Šolc, M., Petrík, J., Balážiková, M., Blaško, P., Kliment, J., Bezák, M., 2021. Application of fta analysis for calculation of the probability of the failure of the pressure leaching process. Applied Sciences (Switzerland) 11. https://doi.org/10.3390/app11156731 [10]Tsarouhas, P., 2012. Reliability, availability and maintainability analysis in food production lines: a review. International Journal of Food Science & Technology 47, 2243–2251. https://doi.org/10.1111/J.1365-2621.2012.03073.X [11]Yazdi, M., n.d. Hybrid Probabilistic Risk Assessment Using Fuzzy FTA and Fuzzy AHP in a Process Industry. Journal of Failure Analysis and Prevention 17. https://doi.org/10.1007/s11668-017-0305-4 [12]Zajíček, J., 2015. Pohotovost výběrových systému podle návrhu konfigurace K z N a způsobu provozování . Bezporuchovost a pohotovost 11–22.
CONTACTS
Marián Bujna, Institute of Design and Engineering Technologies, Faculty of Engineering, Slovak University of Agriculture in Nitra, Tr. A. Hlinku 2, 949 76 Nitra, Slovak Republic, marian.bujna@uniag.sk
Plamen Kangalov, Department of Repair, Reliability, Mechanisms, Machines, Logistics and Chemical Technologies, Agrarian and Industrial Faculty, University of Ruse, 8, Studentska Str., 7017 Ruse, Bulgaria, e-mail: kangalov@uni-ruse.bg
Mitko Nikolov, Department of Repair, Reliability, Mechanisms, Machines, Logistics and Chemical Technologies, Agrarian and Industrial Faculty, University of Ruse, 8, Studentska Str., 7017 Ruse, Bulgaria, e-mail: mnikolov@uni-ruse.bg


