URBAN WIND ENVIRONMENT ANALYSIS AND IMPLEMENTATION
Part 2
NATIONAL UNIVSERSITY OF SINGAPORE
AR5959D INTEGRATED URBAN WIND ENVIRONMENT
KEVIN KUAH KAI YING
A0147107L
DR YUAN CHAO

NATIONAL UNIVSERSITY OF SINGAPORE
AR5959D INTEGRATED URBAN WIND ENVIRONMENT
KEVIN KUAH KAI YING
A0147107L
DR YUAN CHAO
The report aims to migrate low wind permeability in the urban context of Orchard Road. The target buildings, Mandarin Orchard & Cineleisure and The Heeren are selected as the current building massing hinders and obstructs airpaths of North eastern prevailing winds. As such, a list of design iterations will be suggested, tested and compared with the utilization of appropriate wind simulation software. From the study, findings and outcomes will be discovered and evaluated; this aids in the selection of the ideal iteration.
Keywords: Wind Permeability, Porosity, Building Geometry, Wind Velocity
As an extension from the previous report, this report aims to discover the ideal iteration of selected buildings through the utilization of appropriate modelling tool and wind simulation software. The study of massing iterations developed upon an experimental approach, employing a single strategy or integrating several at once. The ideal iteration should allow optimal airflow to be present by seeking potential paths that have least hindrance.
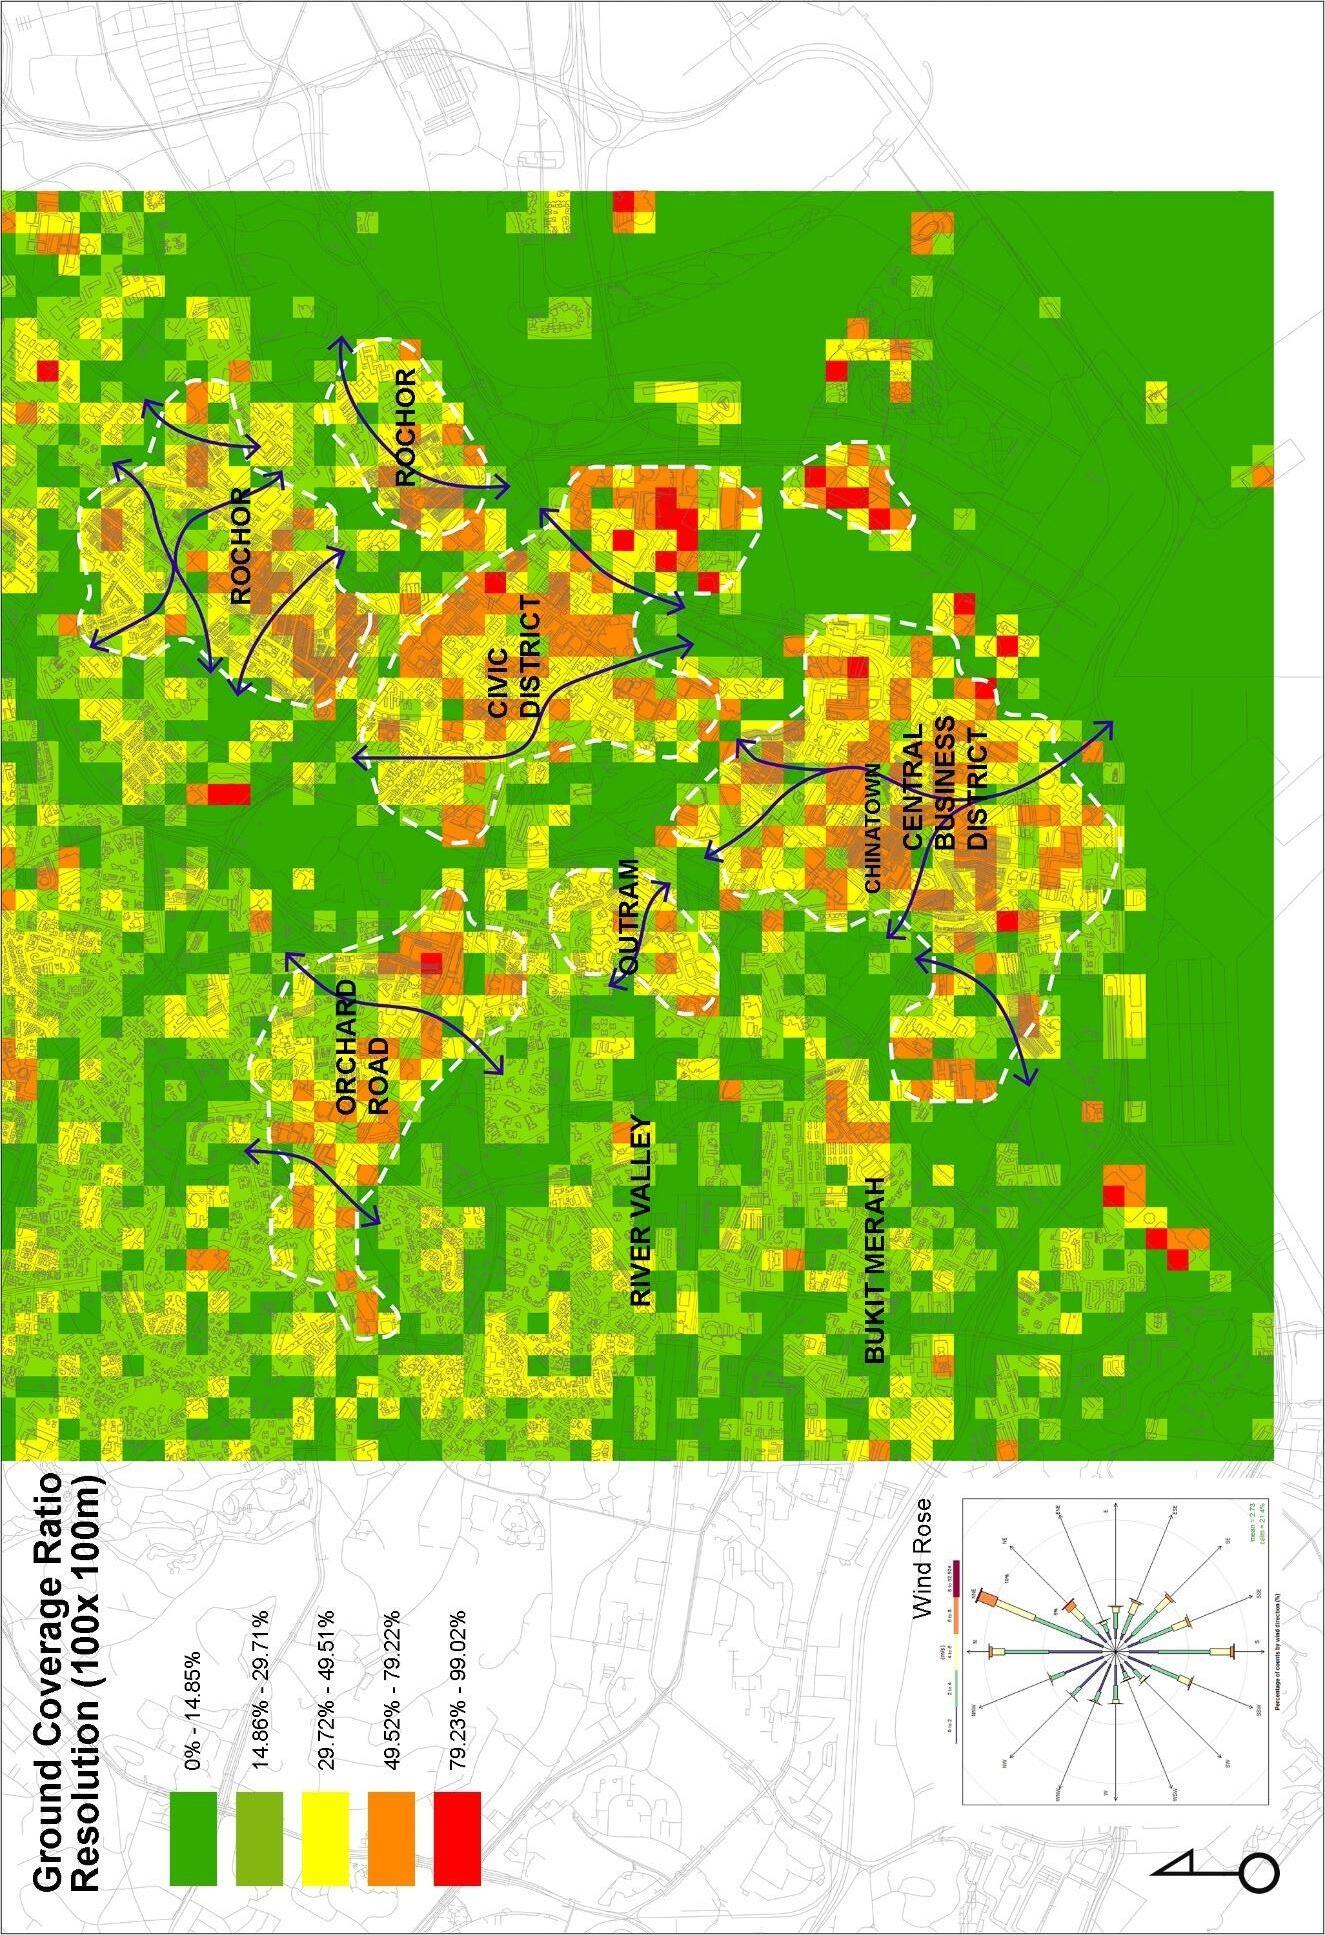
The previous report sought to identify the analysis of modelling results, by identifying low permeability areas in the Central Business District (CBD). This formed a basis of the study. Thereafter, addressed by provision of implementations and strategies of maintaining high permeability of natural ventilation. In order to avoid decreasing the district’s urban density, the analysis was conducted on two scales, urban and neighbourhood, denoted as Airpath I and Airpath II.
1 Chao Yuan. (2018). Lecture 2_AR5959D [7]. Retrieved from https://ivle.nus.edu.sg/v1/File/Student/default.aspx?CourseID=4baa2e00-9bba-4aee-9ba7880979f557c6&WorkbinID=0367fdcd-d739-4c37-beb3-7728903c5e20&FolderID=f1f20de1-c2cd-409a-92075a121defd308
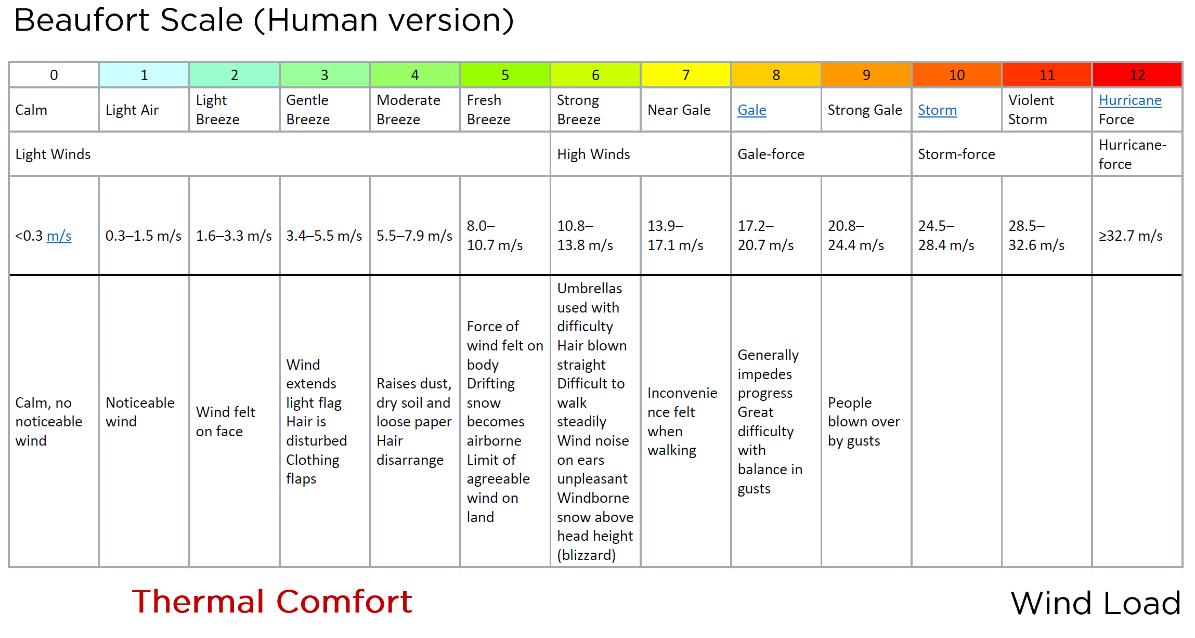
The analysis looked at potential air paths through the formation of low permeability clusters. Airpaths are generated by the direction of prevailing winds and sea breezes, allowing airflow to ventilate deeper into the city. As a consequence of the urban densification, the potential airflow has thus been impeded. The figure above provides a table of standards, suggesting a relationship between thermal comfort and wind load.
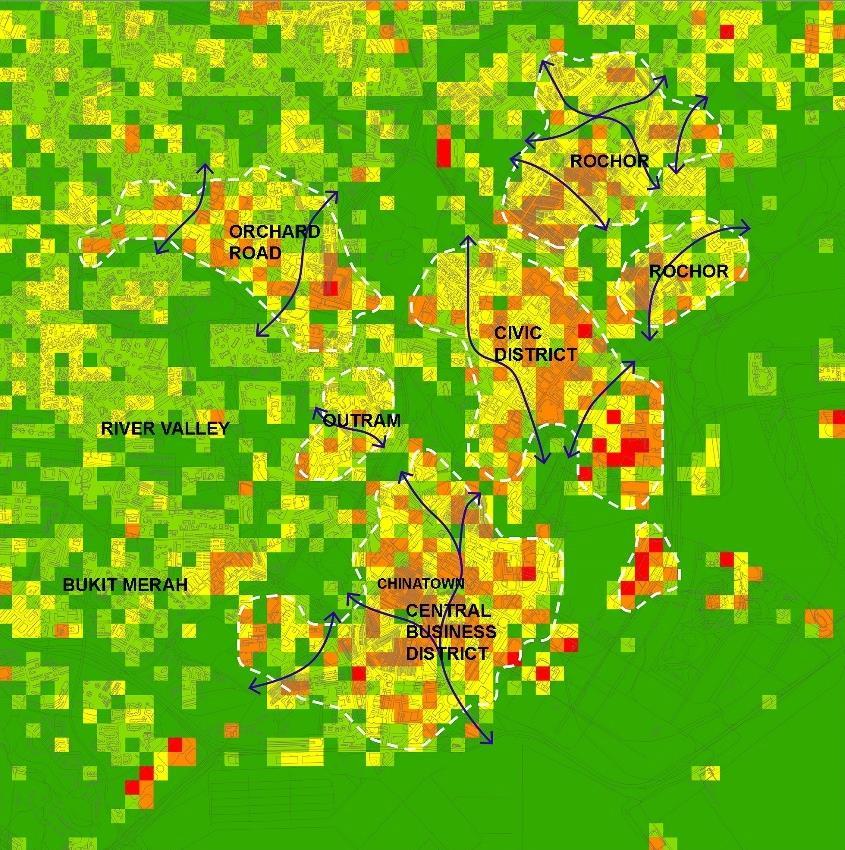
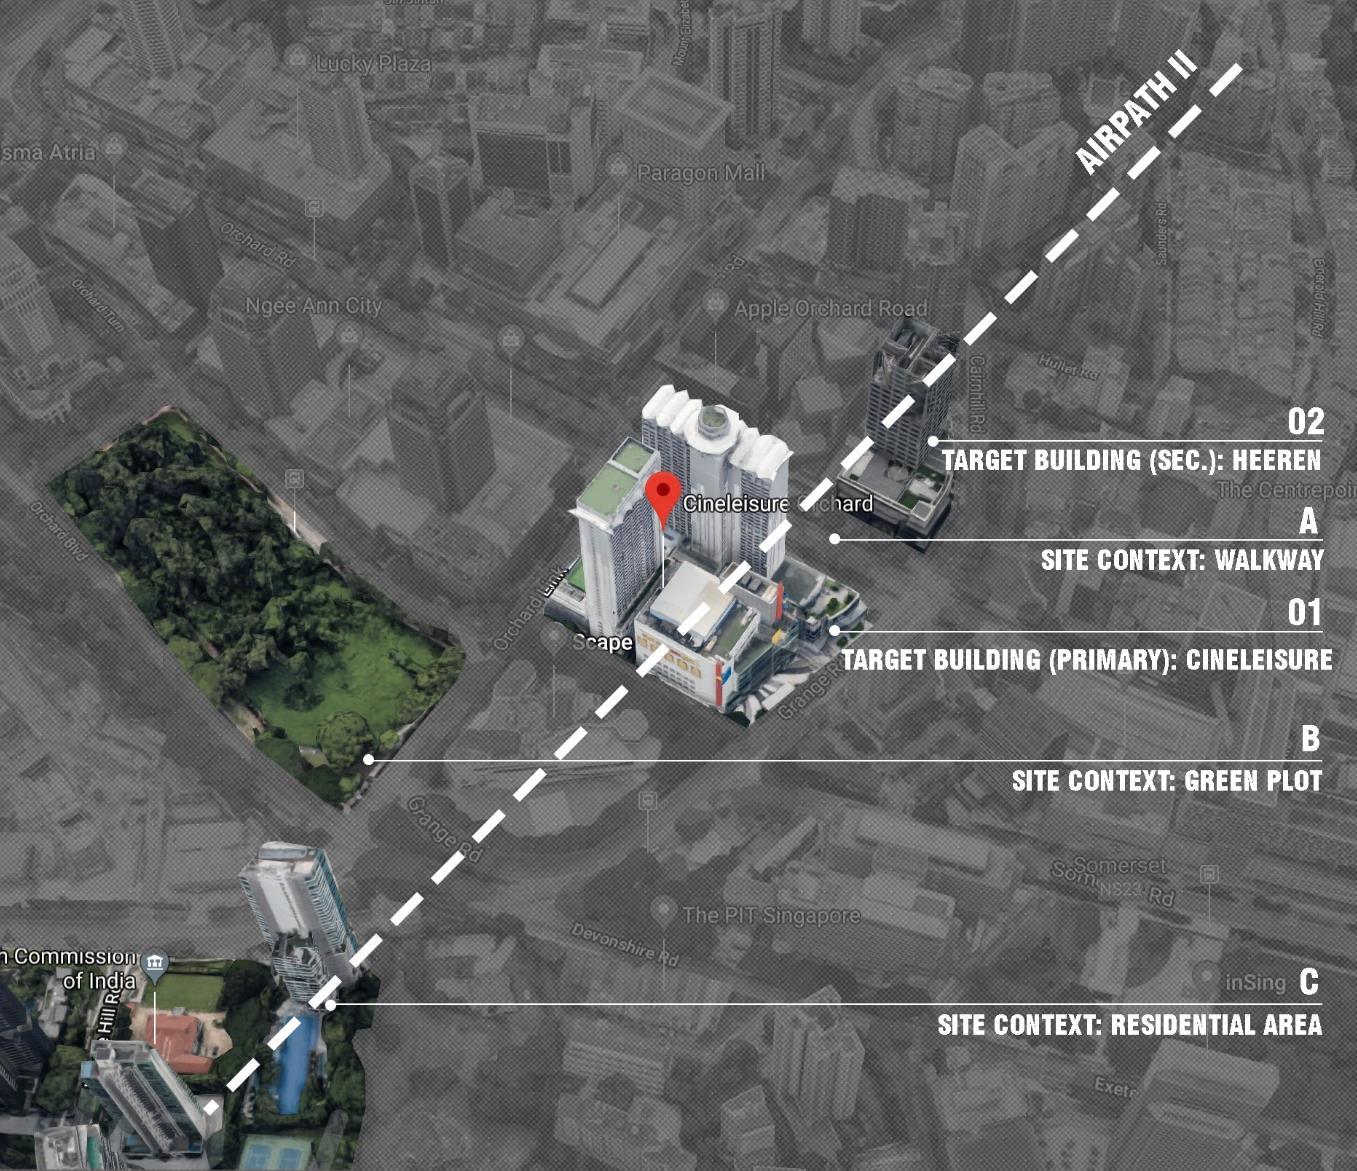
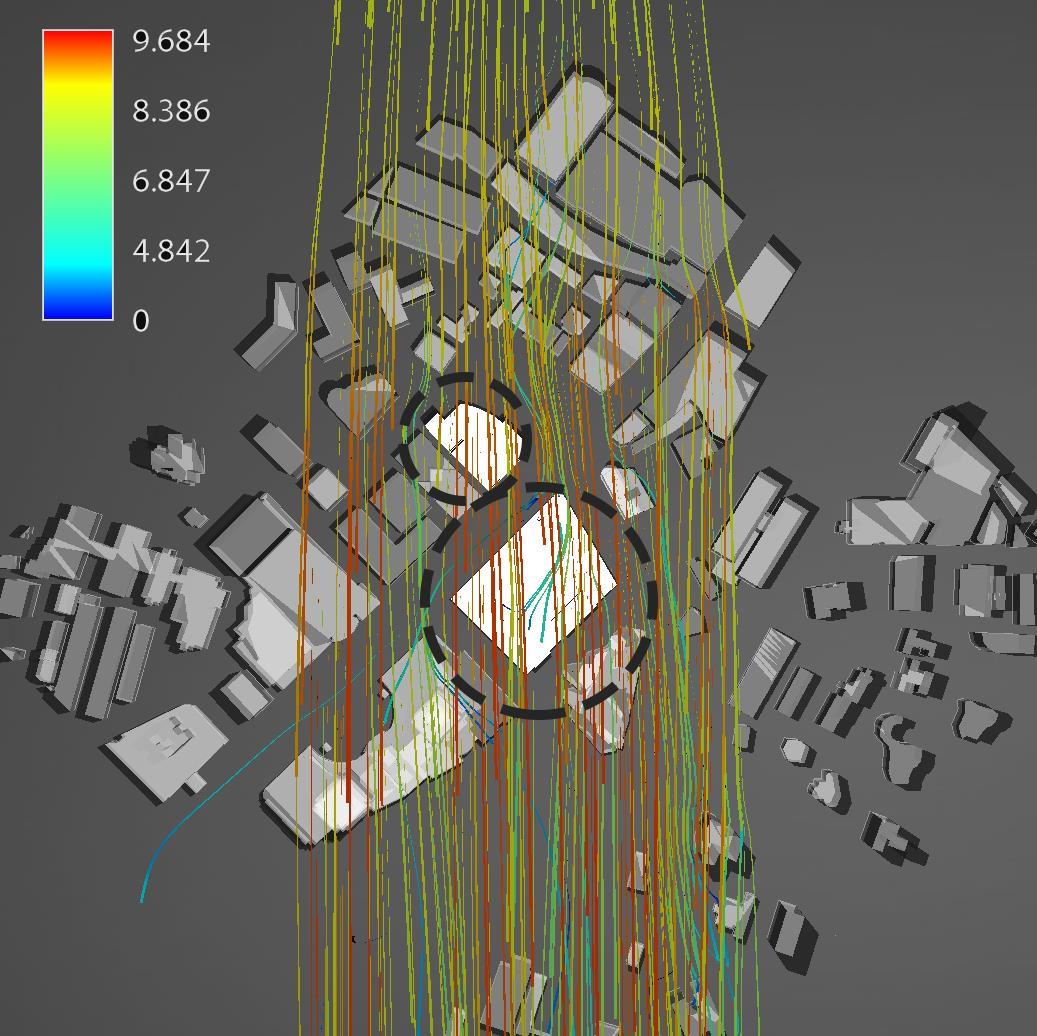
Based on the analysis on Airpath II, two target buildings are identified. The considerations of selection are established on two factors, 1. Building positions which hinder the direction of prevailing winds. 2. Buildings with high ground coverage ratio. The primary target buildings, Mandarin Orchard hotel and Cineleisure shopping mall, consist of two 110m rectangle block
towers on a podium and a 45m high building block, respectively. The current massing of the buildings limit wind permeability due to the lack of porosity and building orientation. Similar to the adjacent building, The Heeren, impedes the permeability of NE prevailing winds, as illustrated in figure above. The building will be identified as the secondary target building, performing alongside Mandarin Orchard and Cineleisure to achieve a desired outcome. The Heeren consists of a single 65m square block tower on a podium with a height of 18m. The current building form has a high ground coverage ratio and uniformed shape across the levels. These considerations are essential for the next massing iteration study. In addition, the surrounding site contexts will also be addressed in this report; specifically:
A. The pedestrianised walkway along Orchard Road
B. Green plot behind Ngee Ann City
C. The residential areas along Grange Road
Beyond its functionality on a building scale, the location and orientation of buildings blocks also affects the direction of airflow to the surrounding contexts. Buildings may be expressed as ‘conductors’ in the sky which help direct and construct a possible airpath from one location to the other. To elaborate further, desire of wind presence and ventilation is required to increase the thermal comfort. The recipients on the pedestrianised walkway would benefit if the design of target buildings is well considered. The three surrounding site contexts will be addressed to allow high possibility of wind ventilation by the target buildings.
Below are the diagrams which represent the original massing of the selected buildings. The massing block will be utilized as a foundation and starting point for analysis and iteration studies.
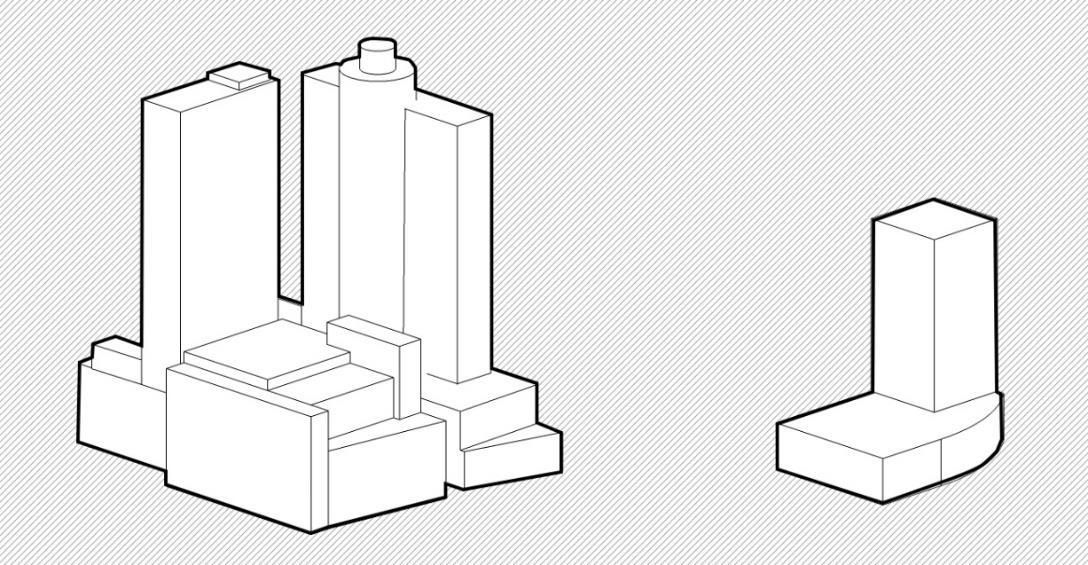
The objective of this study analyses the original building massing and the provision of enhanced iterations to increase potential airflow, wind permeability and ventilation on the neighbourhood and building scale. The methodology involves two parts, (1) The selection of appropriate modelling tool and wind simulation software, and (2) Utilization of design massing strategies at stages. The selection of modelling tool is a comparison between Autodesk Flow Design and Computational Fluid Dynamics (CFD) which will be addressed in next section. In addition, the design massing strategies will be discussed and established on predetermined stages
The considerations of modelling tool and simulation selection lies on five underlying factors: Cost, Time, User-friendliness, Accuracy of results and Resolution; along with the focus of the report. The report primarily emphases on the student’s methodology of analysing, evaluating, providing iterations and selecting the most ideal massing strategy. Instead of the student’s capabilities on handling complex software which consumes long periods of time to generate accurate results. The basic criteria of selecting software should be able to analyse the wind permeability, airflow direction and wind velocity. The available modelling tools are listed and compared below:
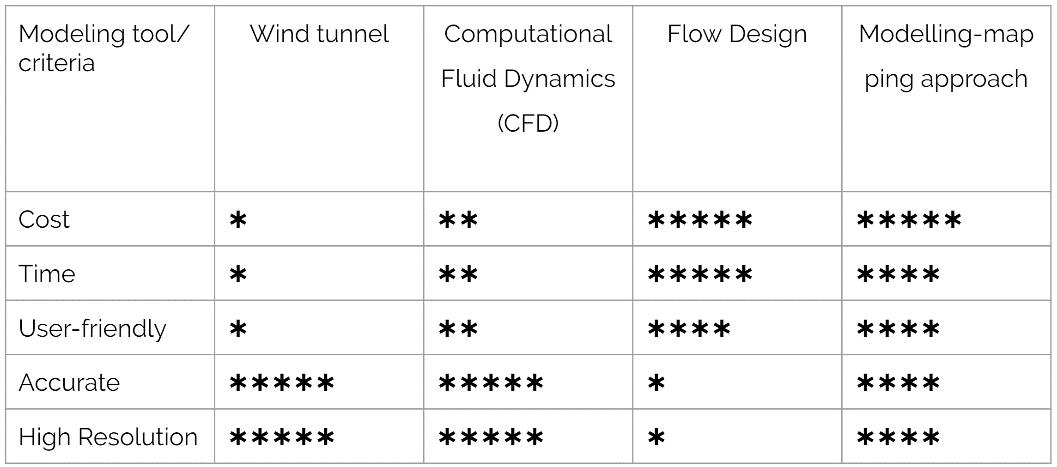
From the table, two software have been selected, specifically, Computational Fluid Dynamics (CFD) and Flow Design Compared to the other tools, the selected software are readily available for students’ usage. However, the softwares have polarising qualities, particularly five factors mentioned above. Adhering to the objectives and focus of the project, Flow Design is selected as an appropriate modelling tool and wind simulation. Due to its user-friendly interface, Flow design generates quick results and information, as compared to CFD. Despite the lack of accuracy, Flow Design is able to provide sufficient information to analyse and identify areas for improvement in building massing strategies.
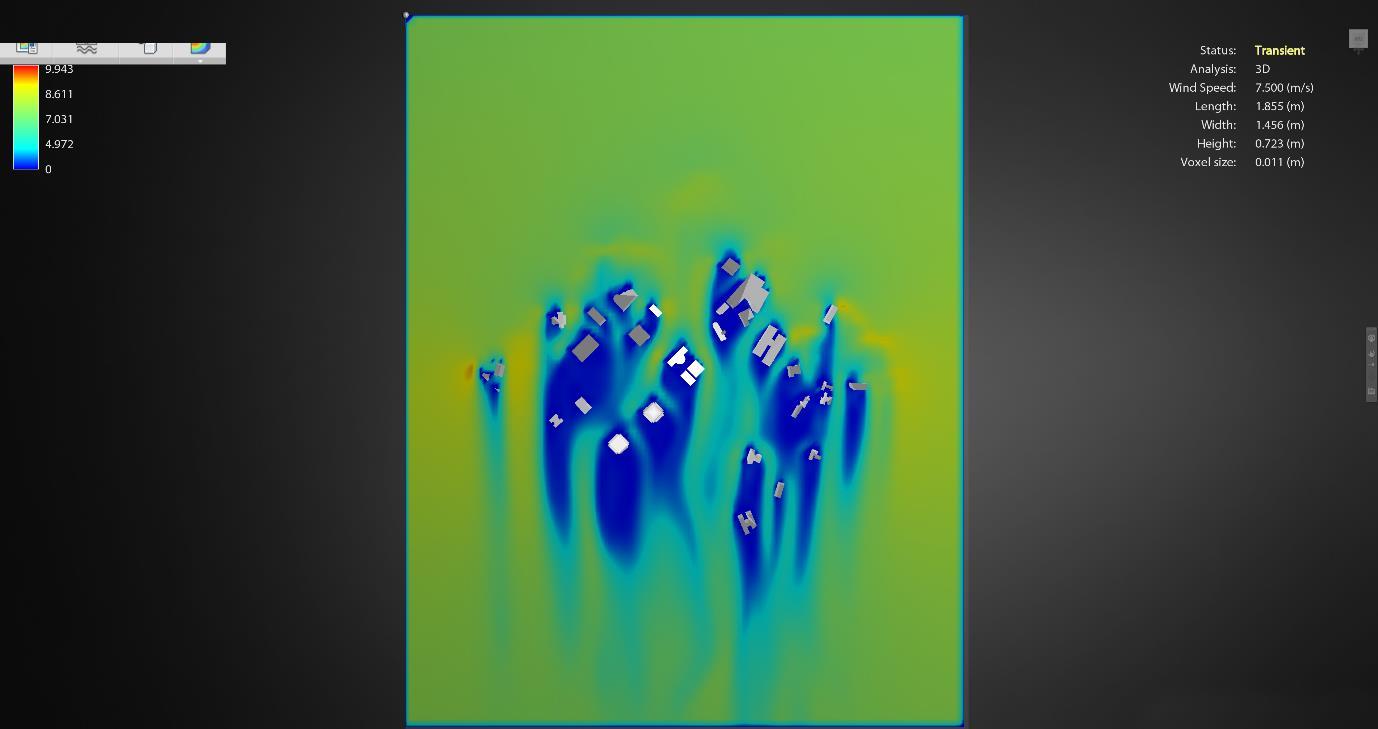
In addition, to reduce the lack of accuracy in Flow Design, a standardised set-up shall be followed every round of iteration; specifically, the dimensions of wind tunnel box (LxWxH), Orientation, Wind Speed, Plane @ various heights, and flow line setting. Furthermore, the standardized representation in Plan, Section and Axonometric view is required. These settings will be displayed in the next section.
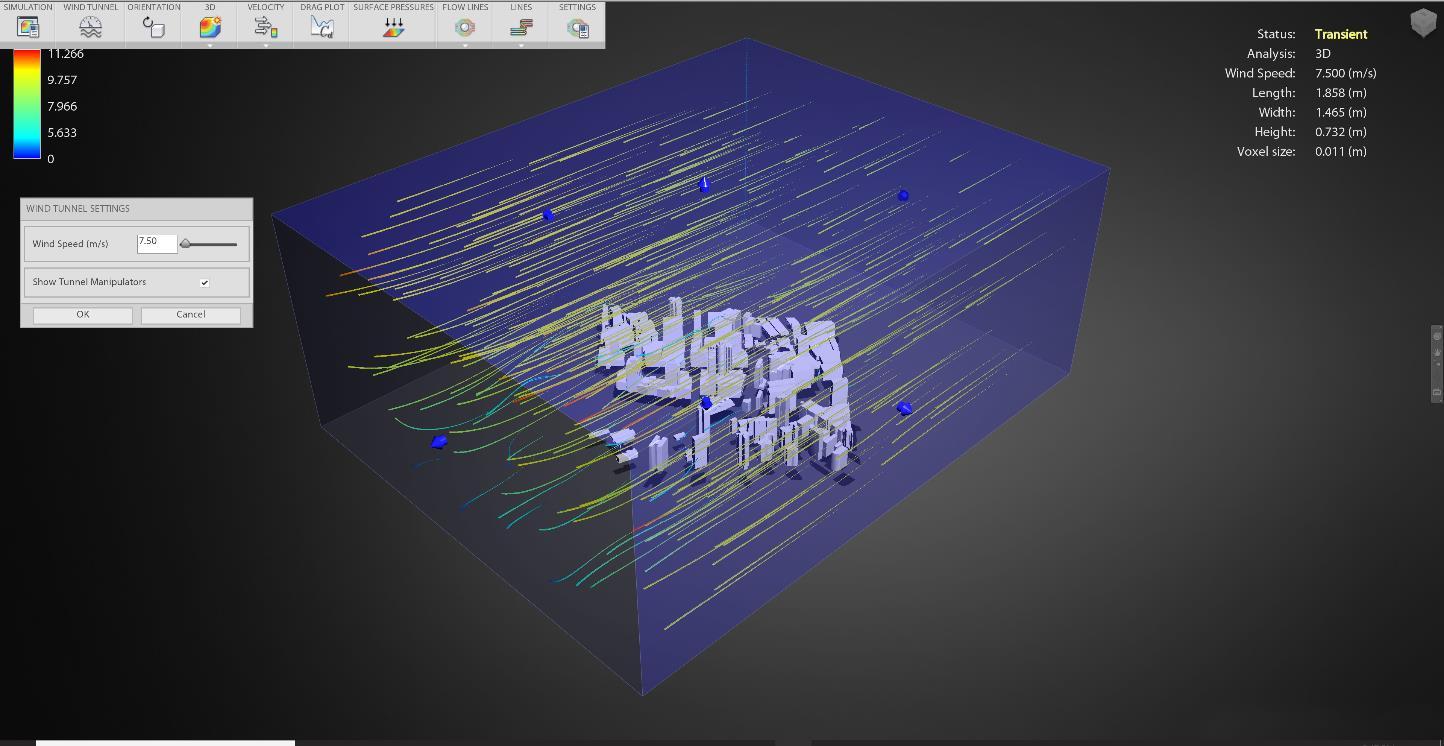
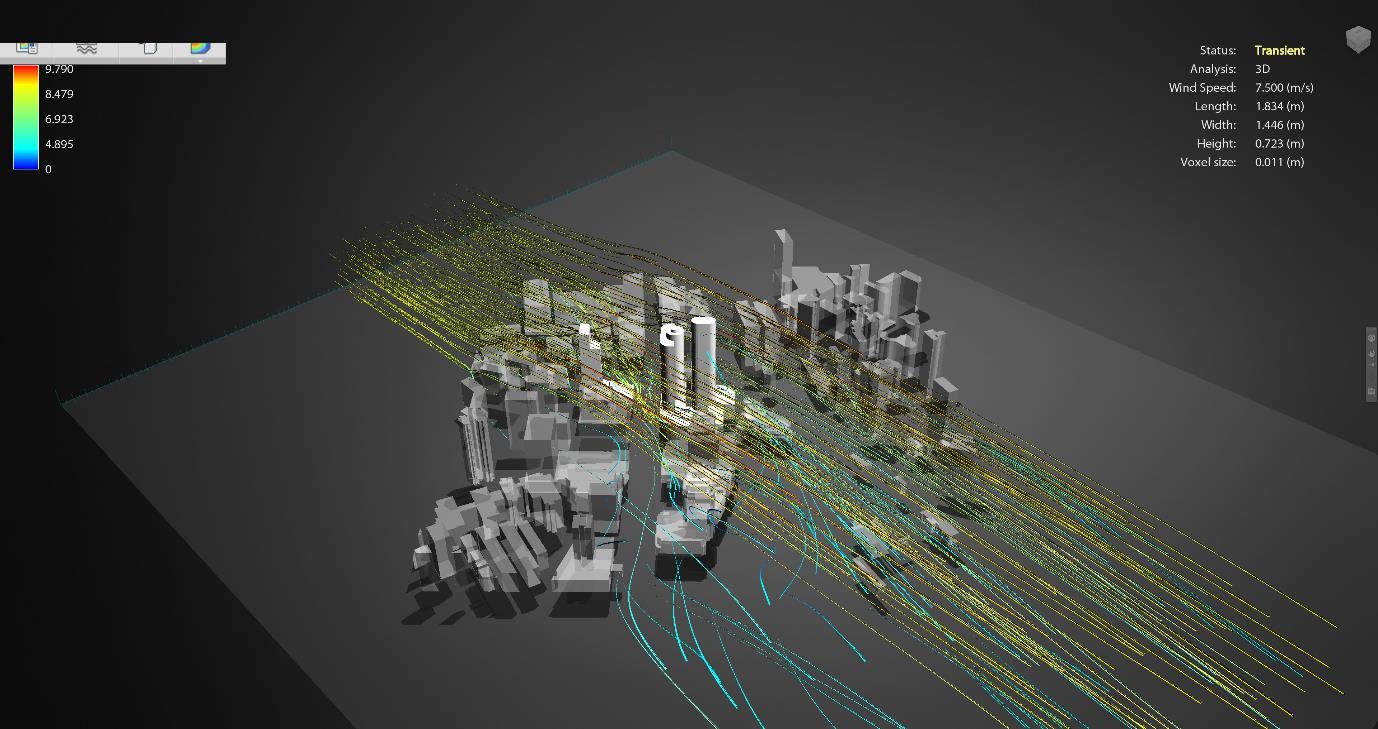
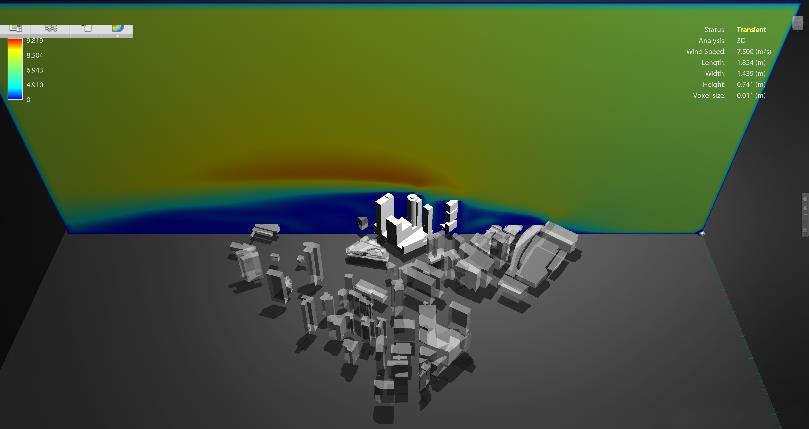
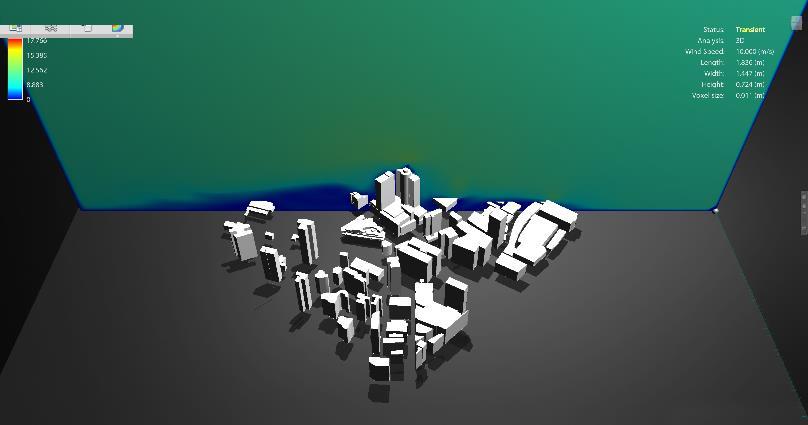
Considering the lack of accuracy in results, it is crucial to establish a standardised set-up for wind simulation. The target buildings, Mandarin Orchard & Cineleisure and The Heeren stands at the maximum height of 155m and 83m respectively. As such, the wind tunnel box is roughly measured at 1 858 * 1 465 * 732m. The urban context model is orientated towards to direction of Airpath II, the north-eastern prevailing winds. However, due to the interface of Flow Design, the settings of each wind simulation may vary slightly Figure 4 demonstrates the basic settings below.
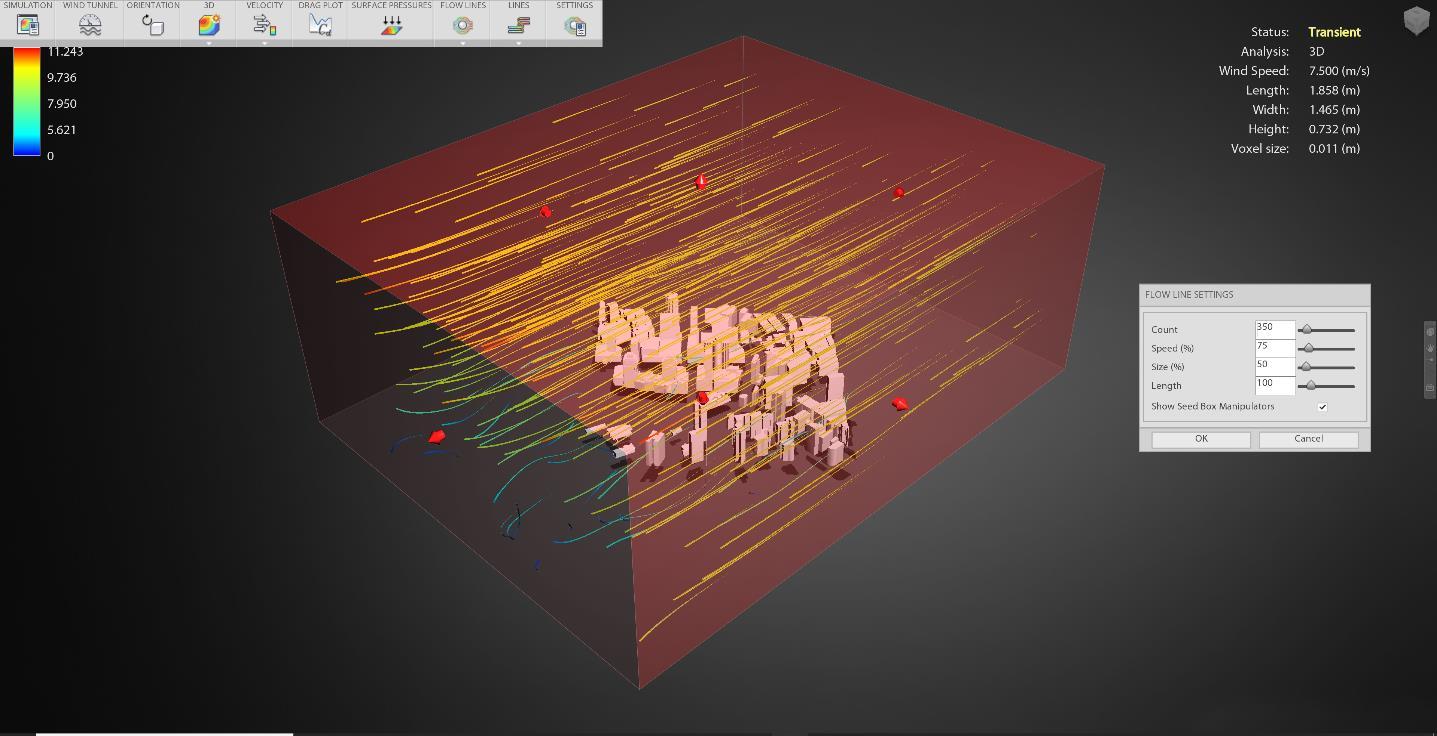
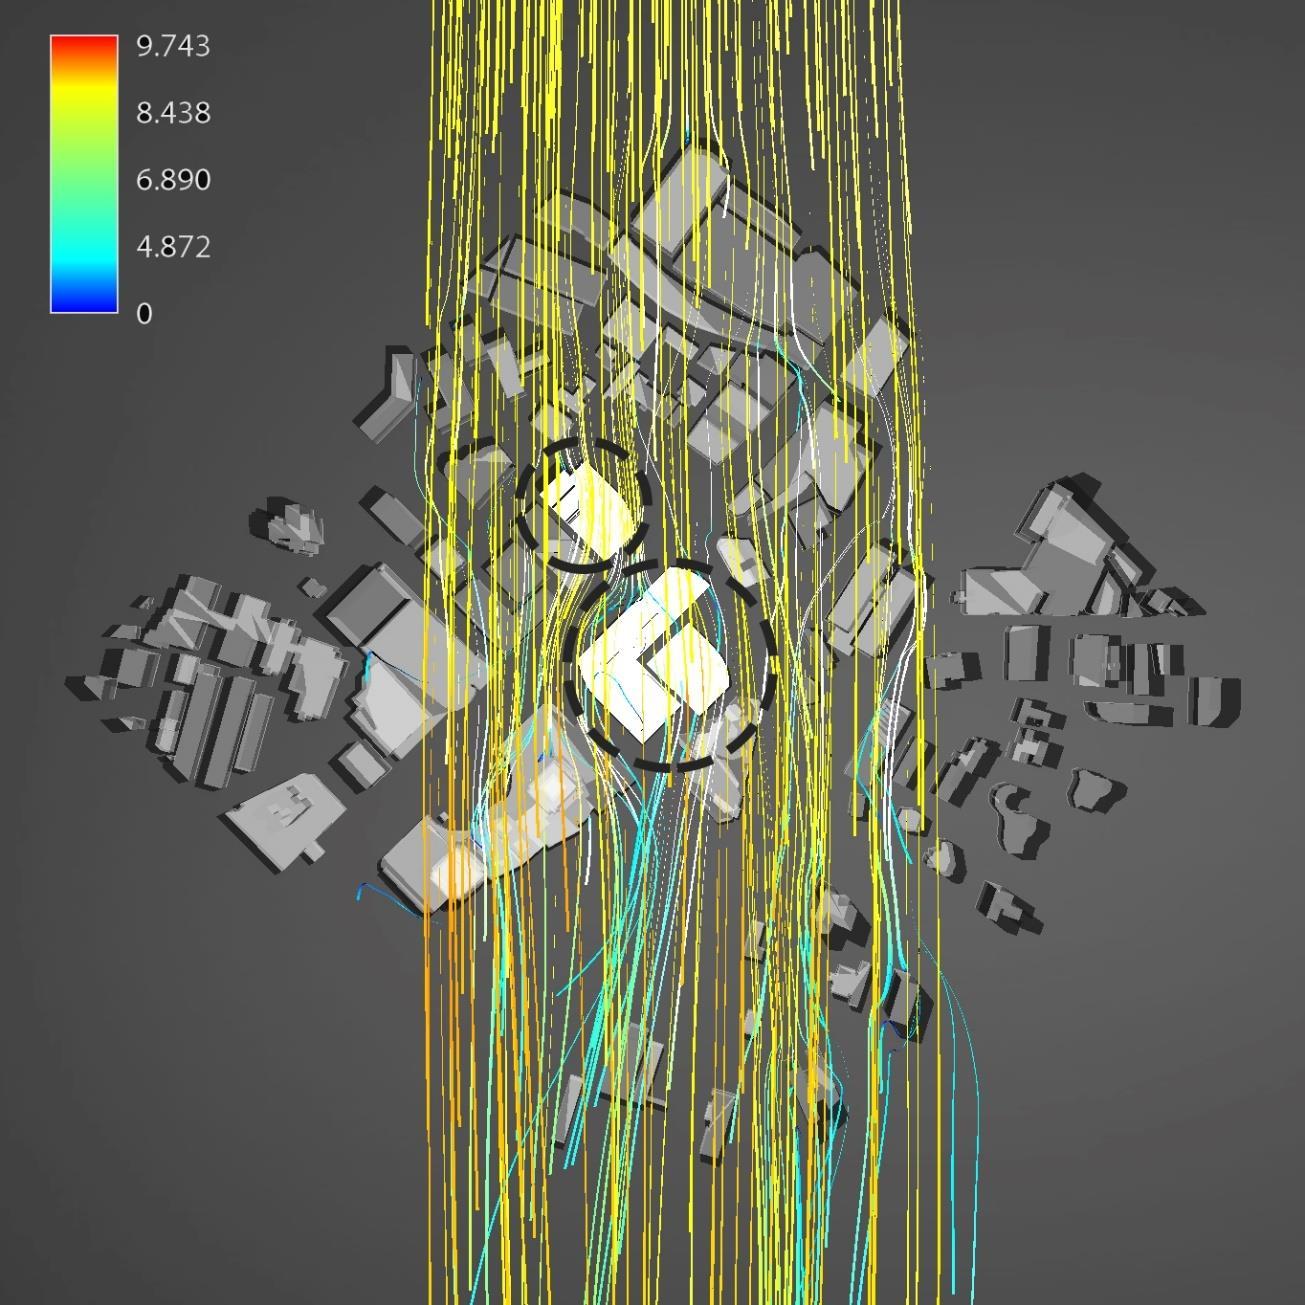
Moving to the setting of flow lines, the utilisation allows the users to visualise the direction and velocity of airflow three dimensionally. The flow line settings are important to provide a clear representation for analyses purposes. The settings are configured as such, Count: 350, Speed: 75%, Size: 50% and Length: 150. Figure 5 is a screenshot, displaying the flow line settings.
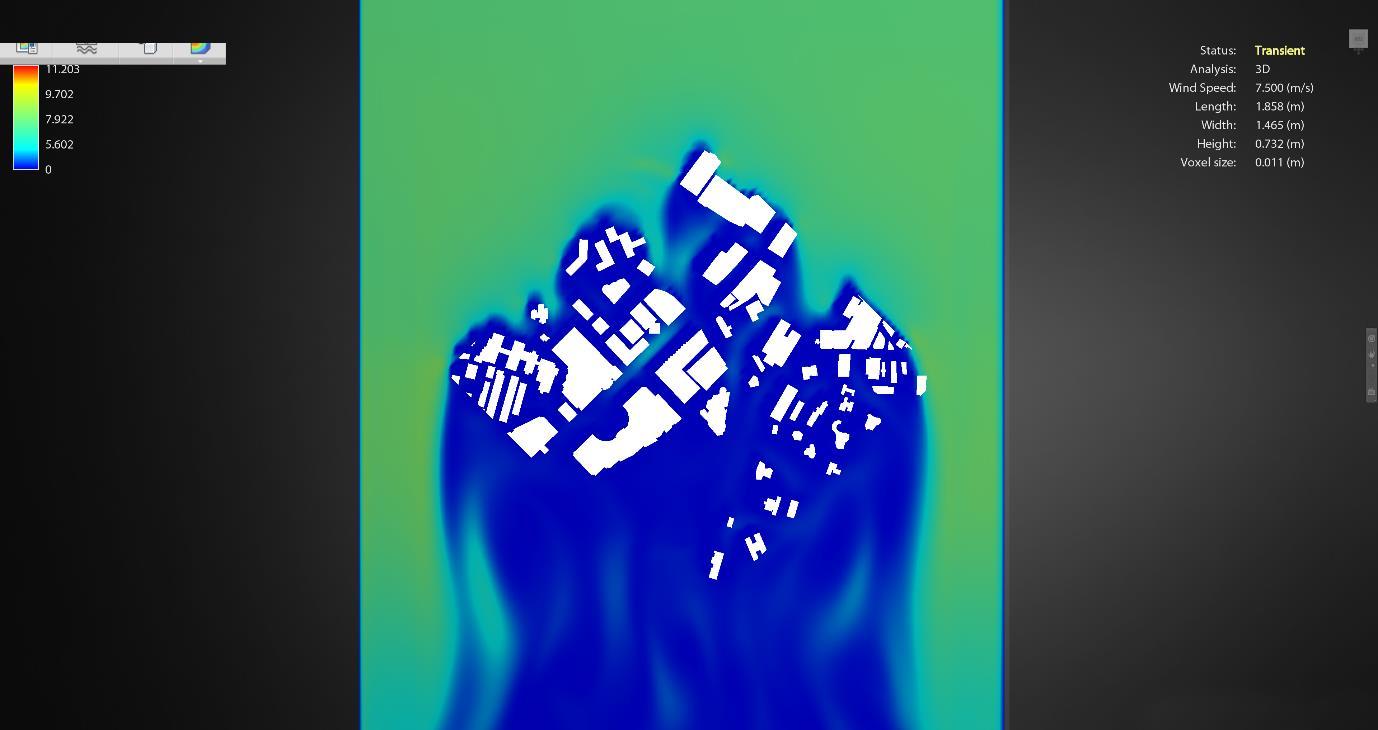
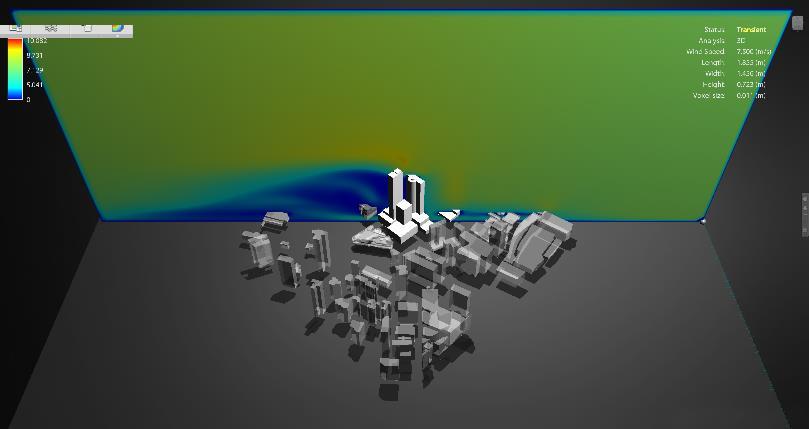
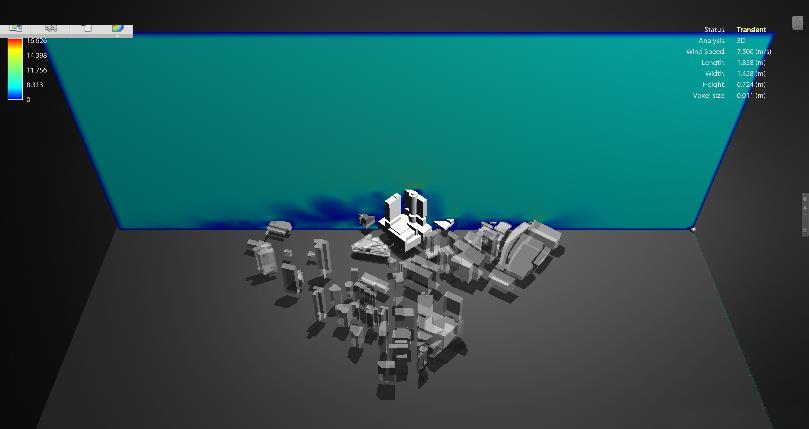
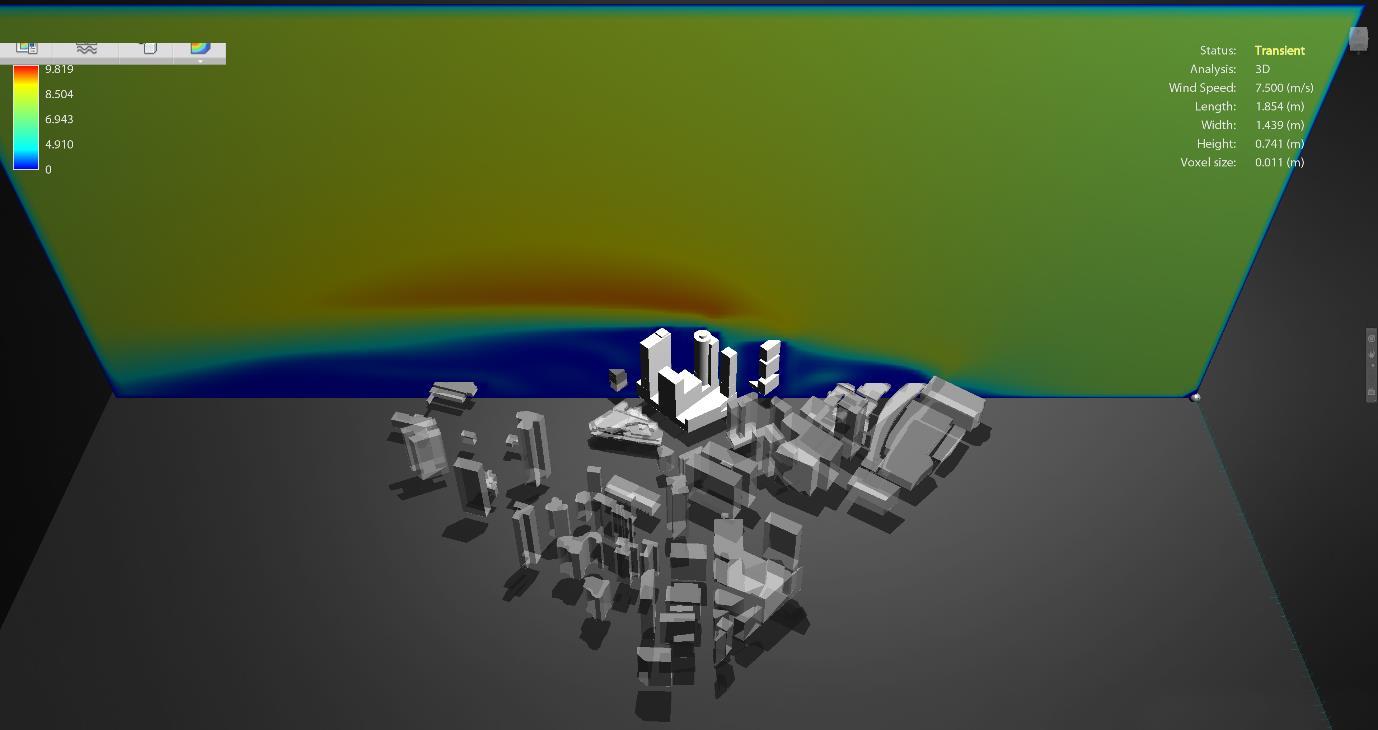
The application of plane provides a “two-dimensional slice through the wind tunnel”.
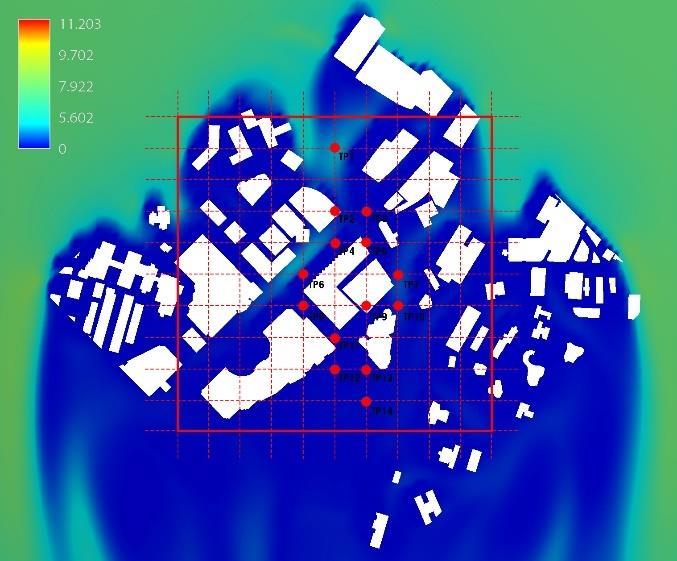
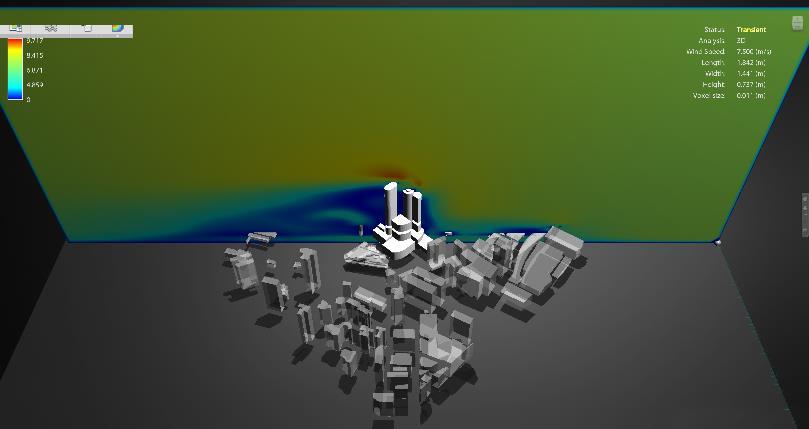
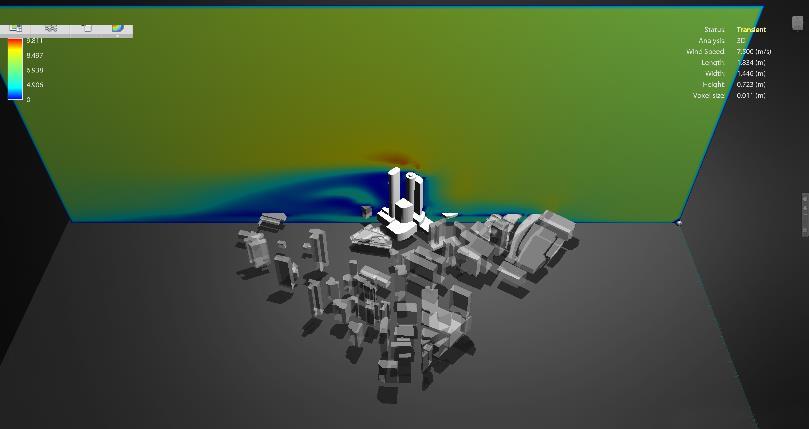
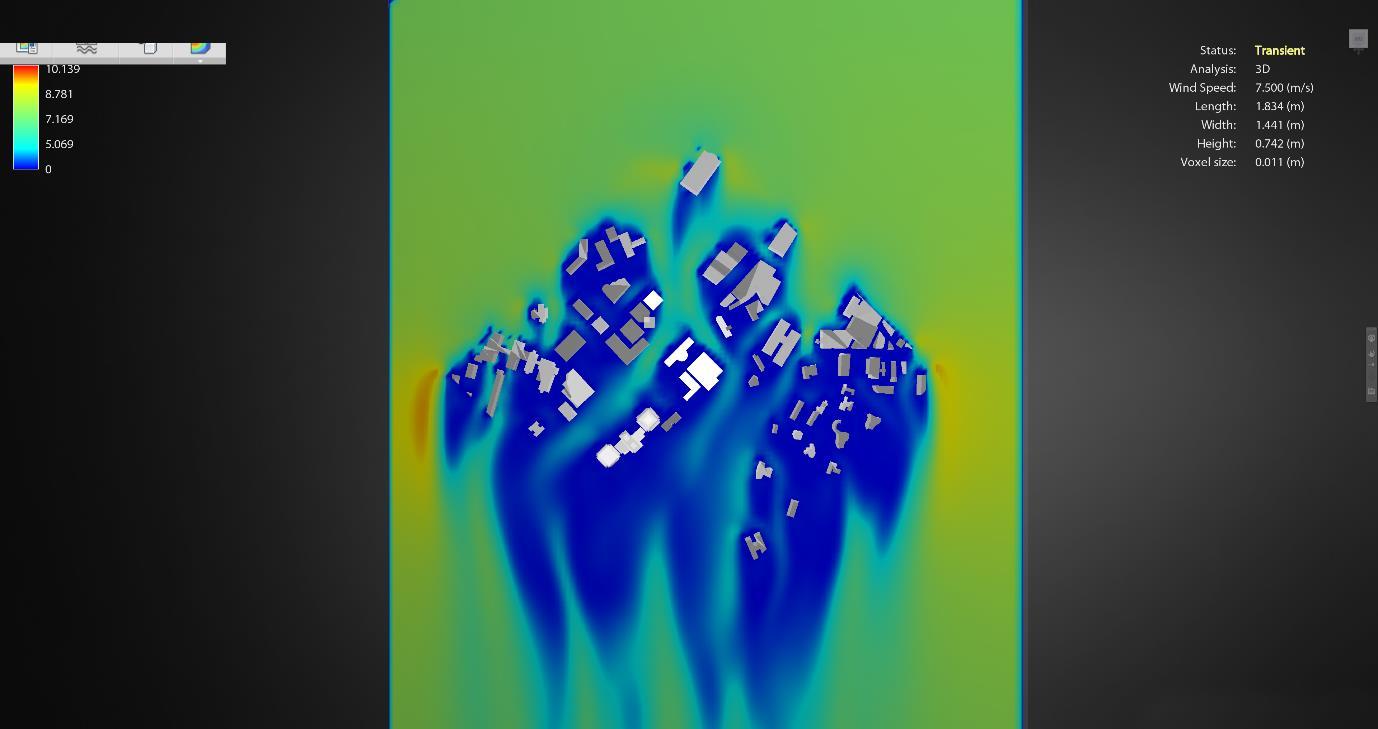
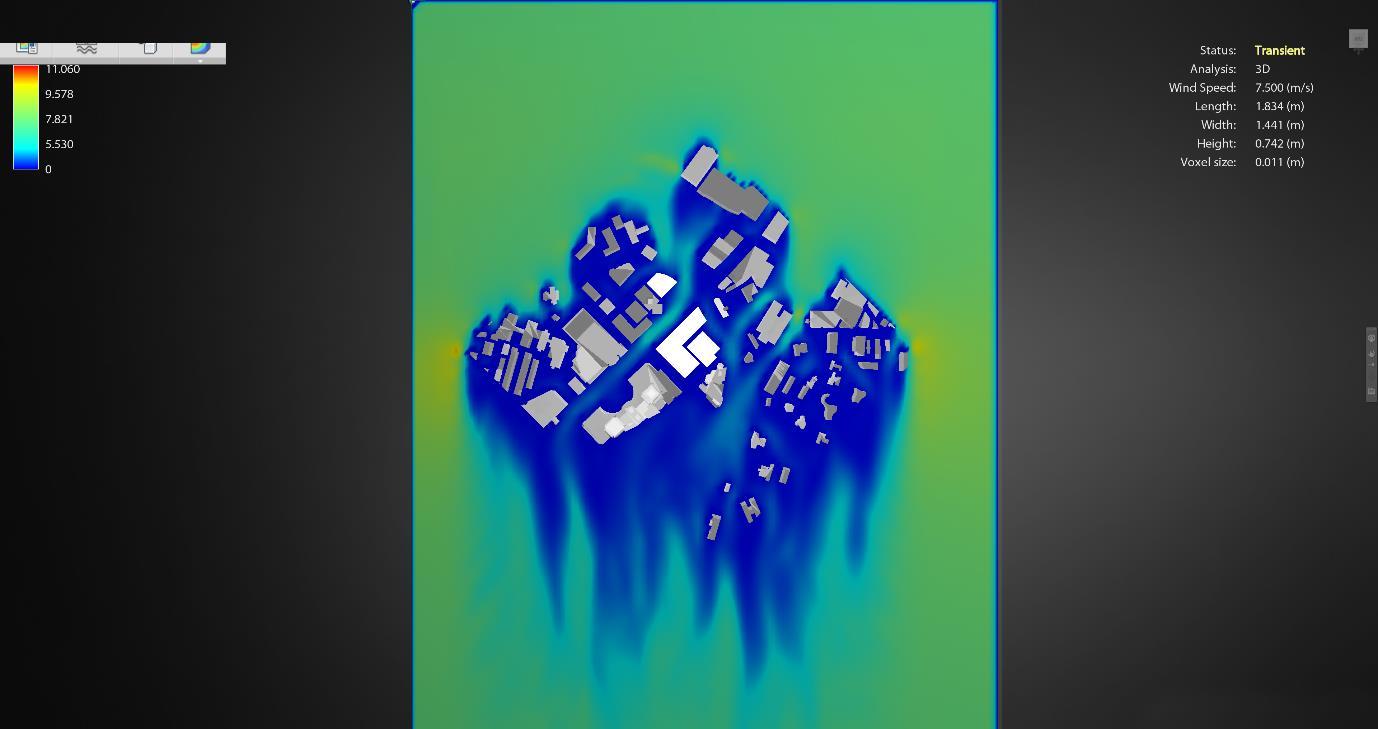
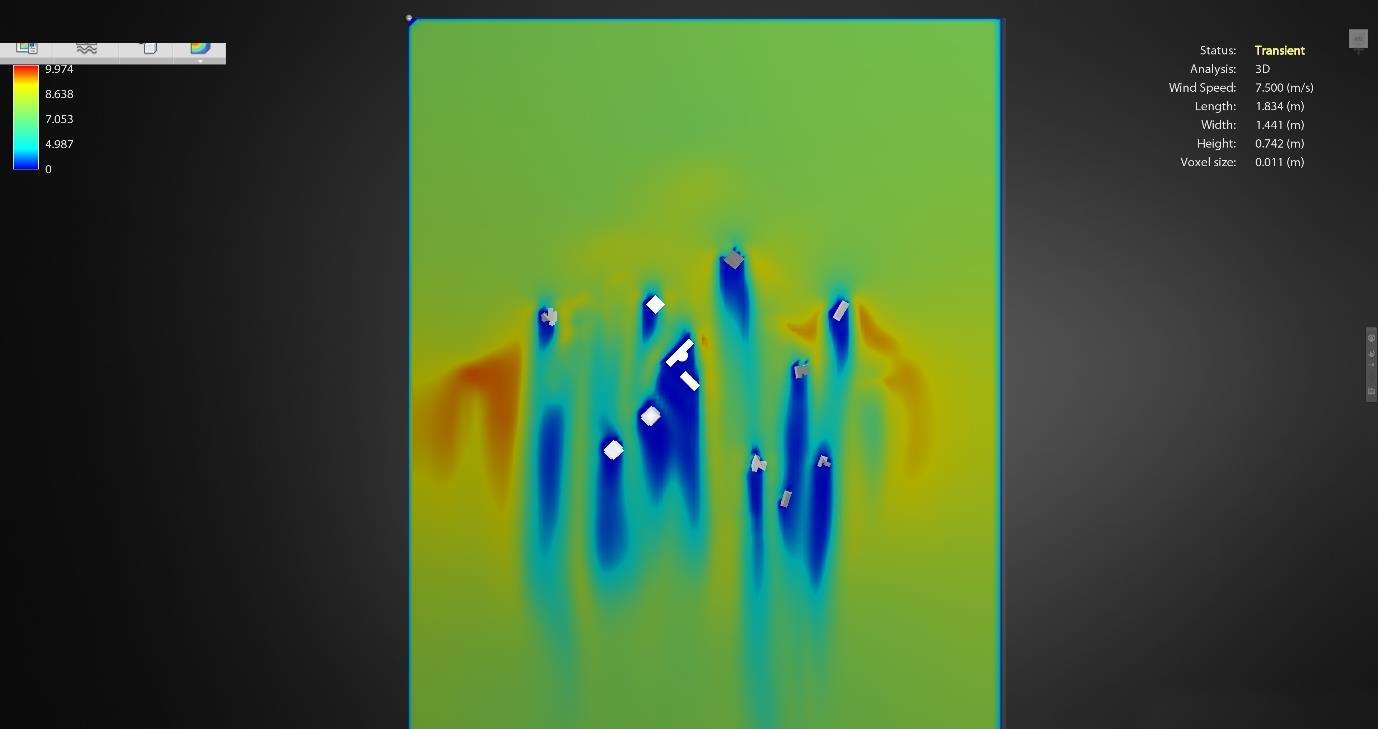
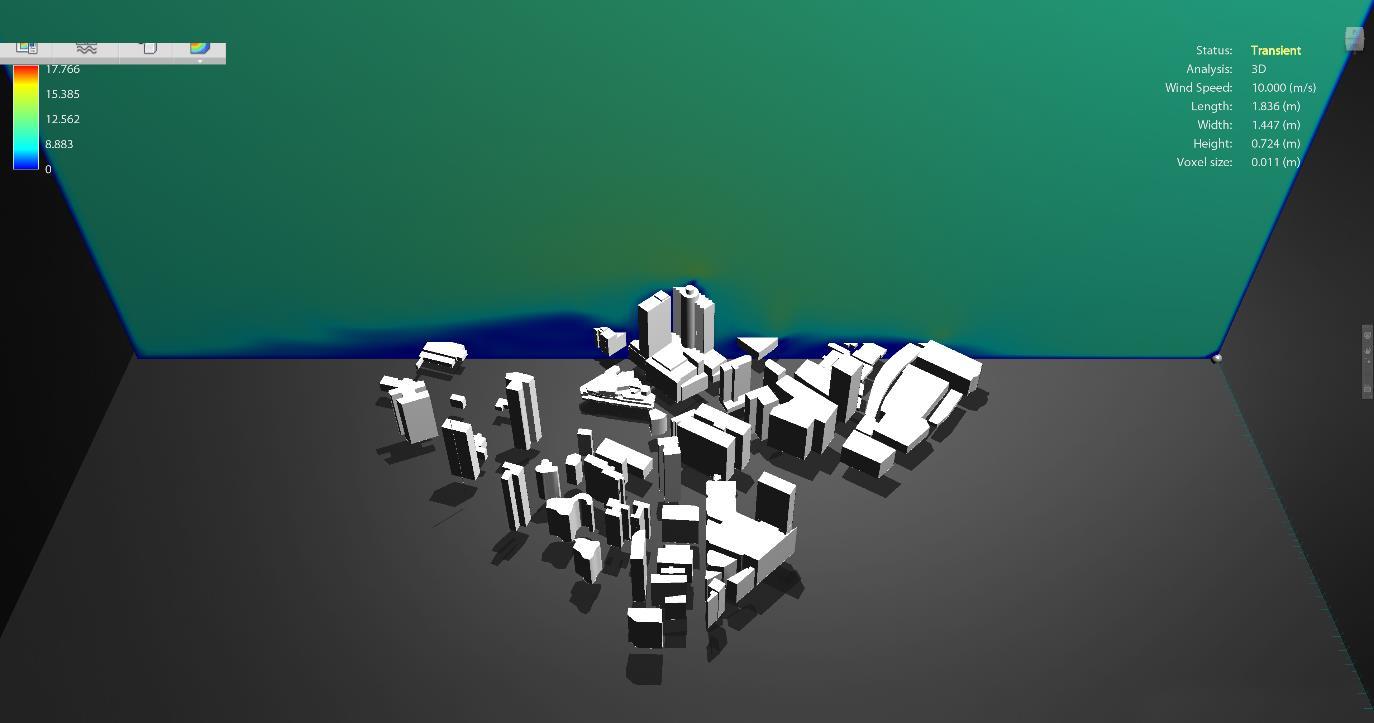
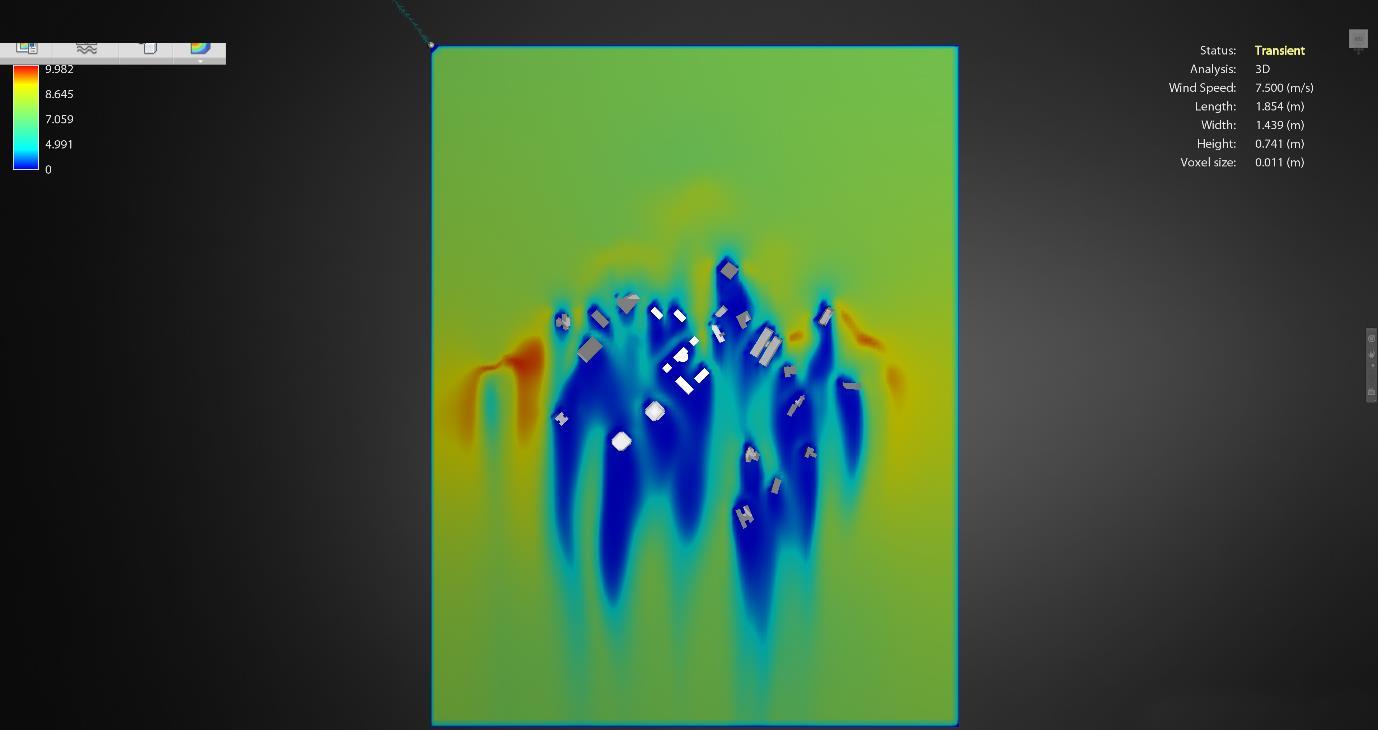
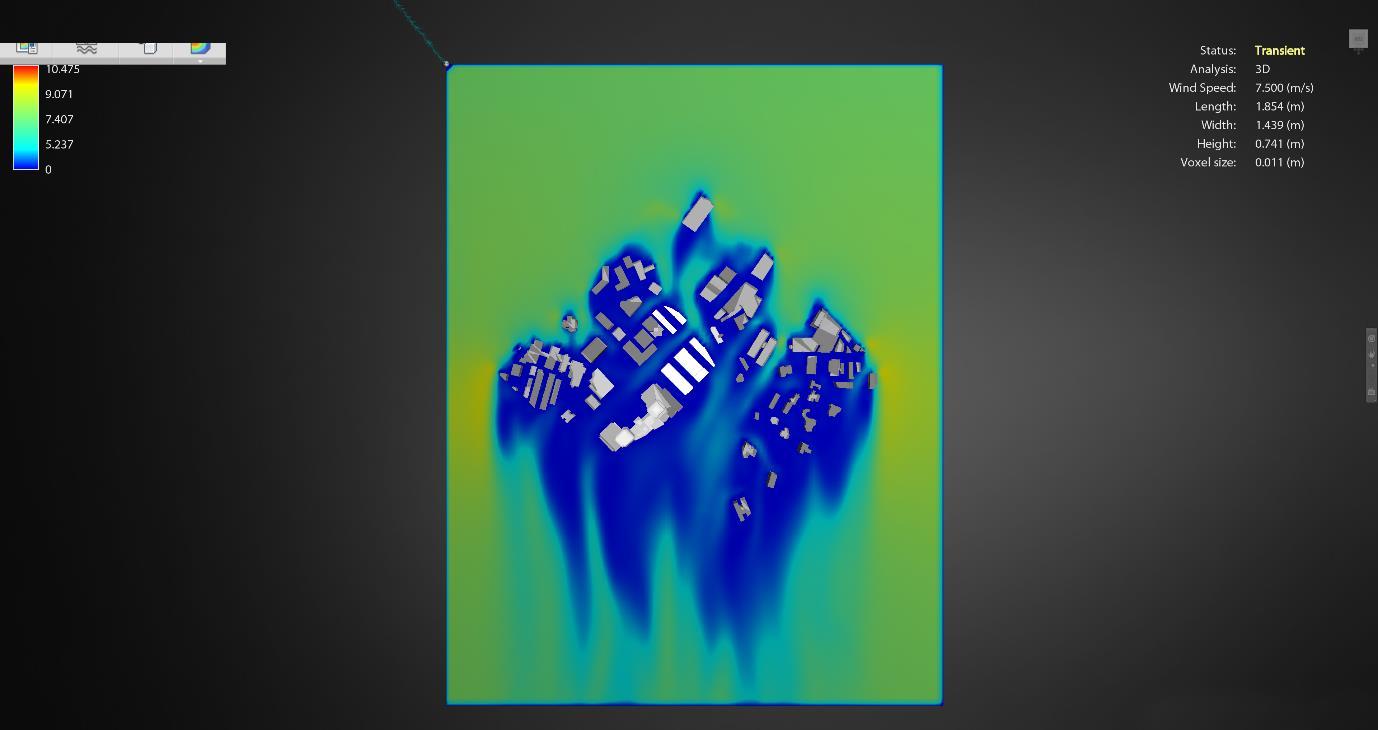
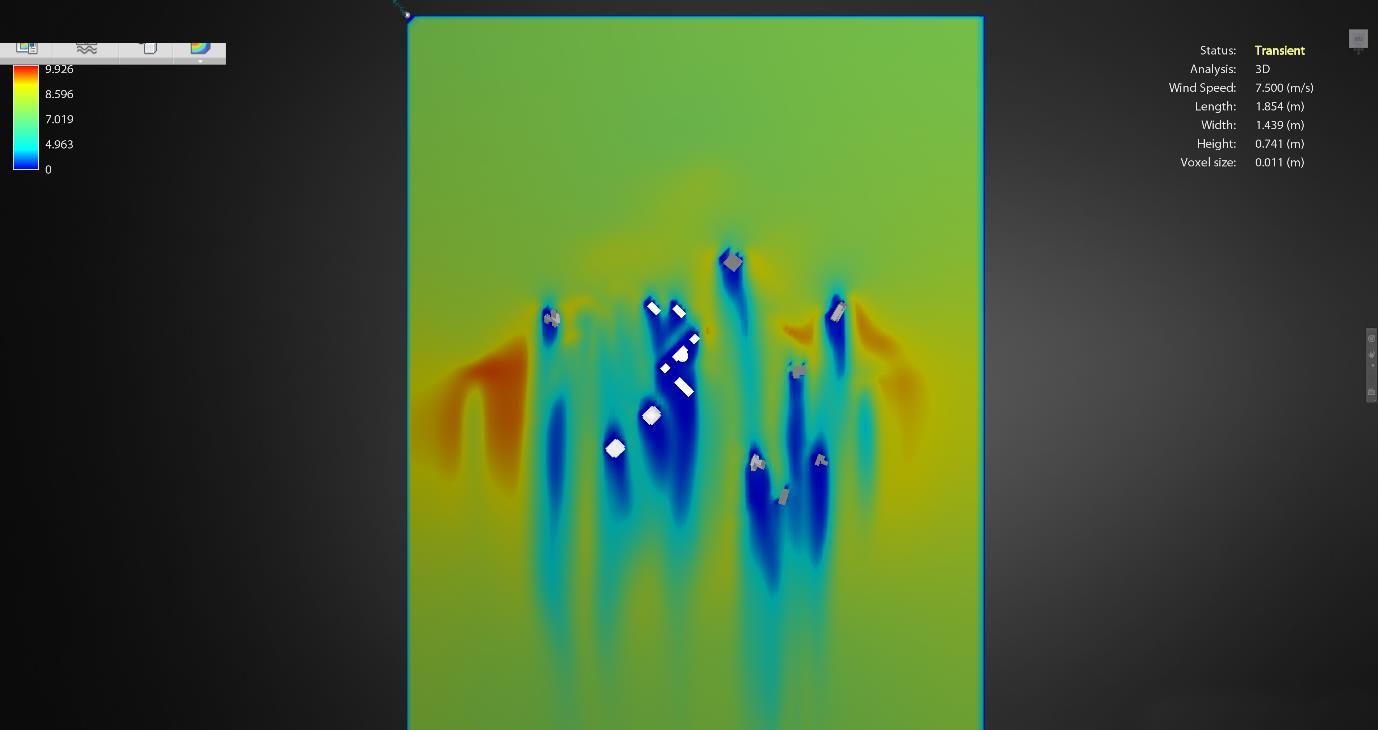
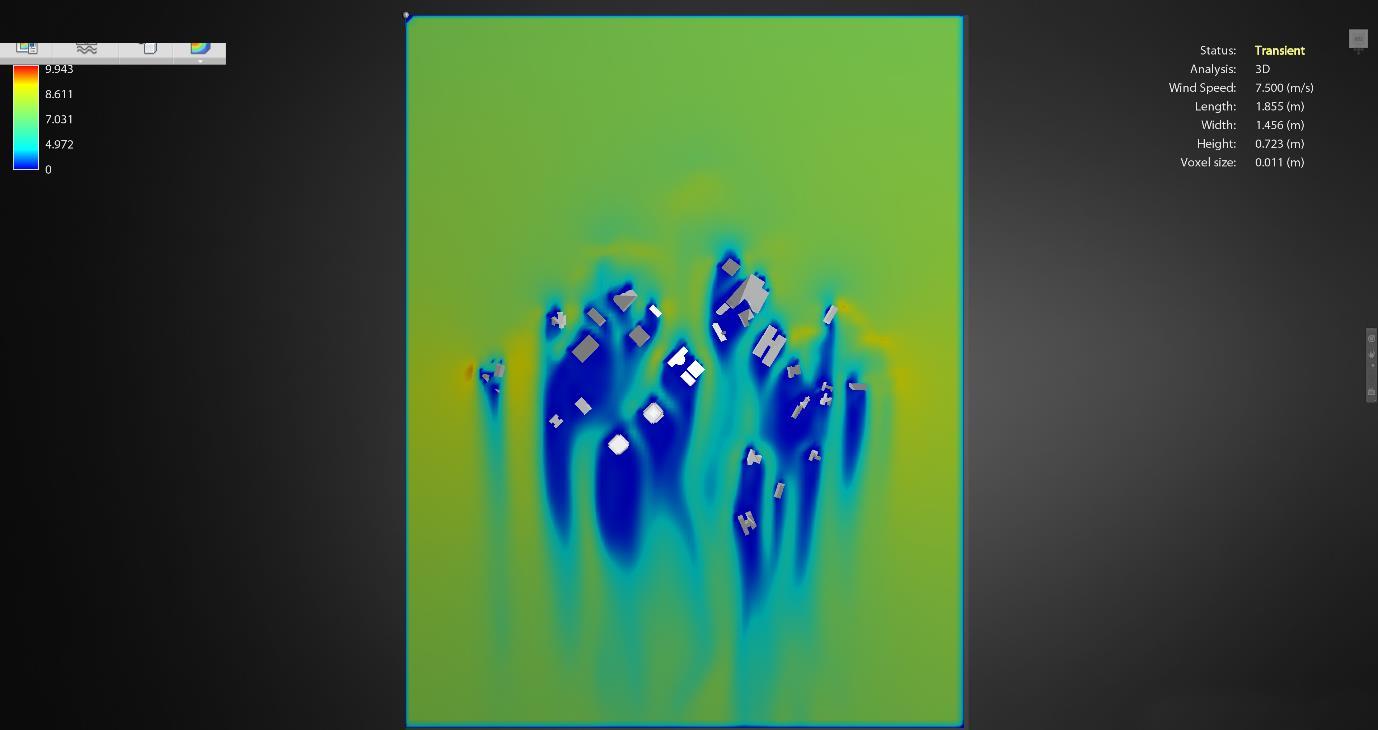
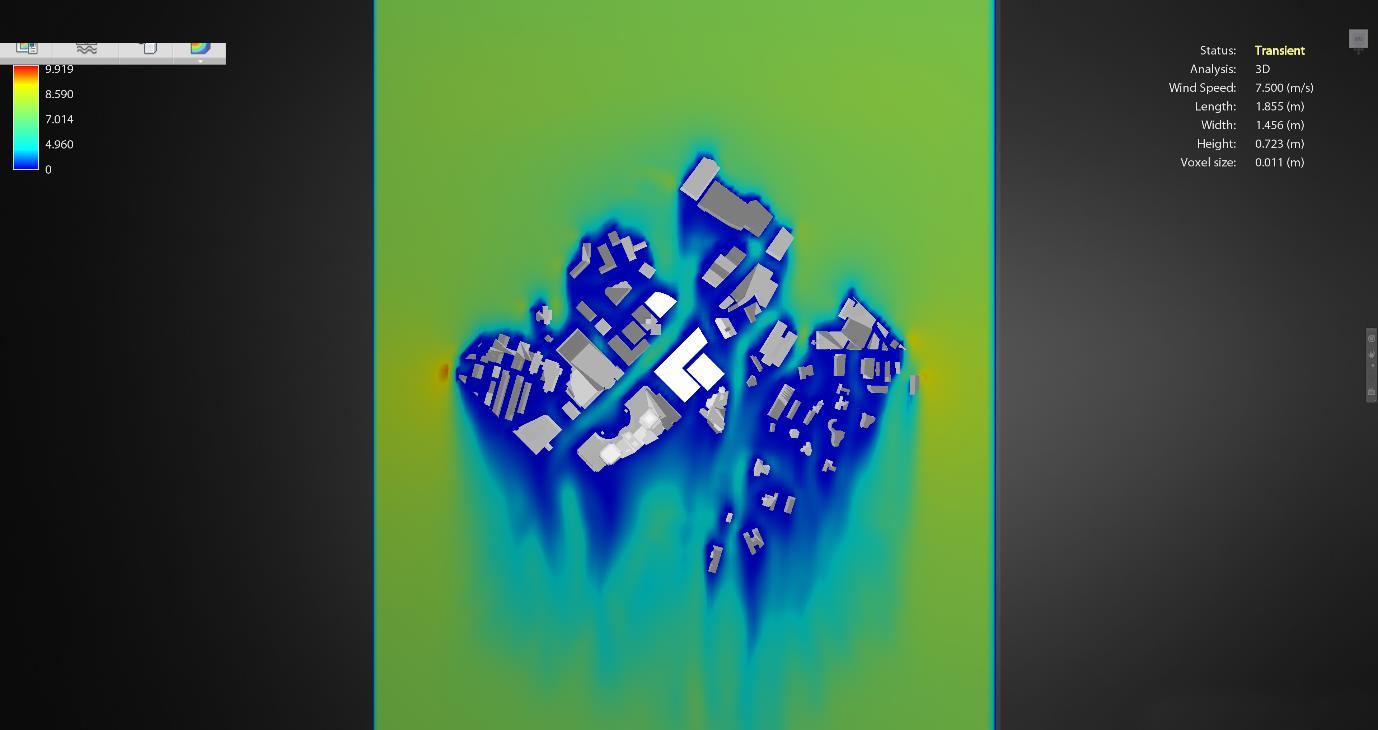
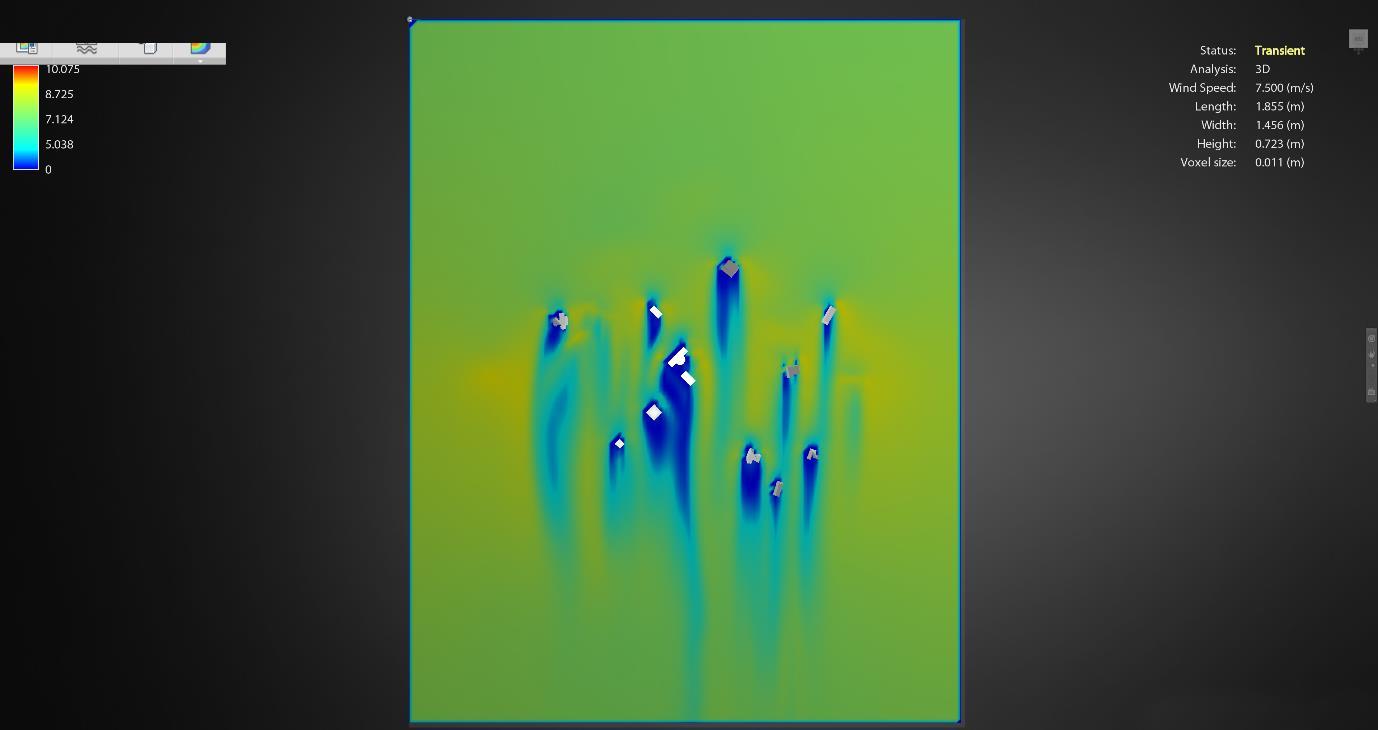
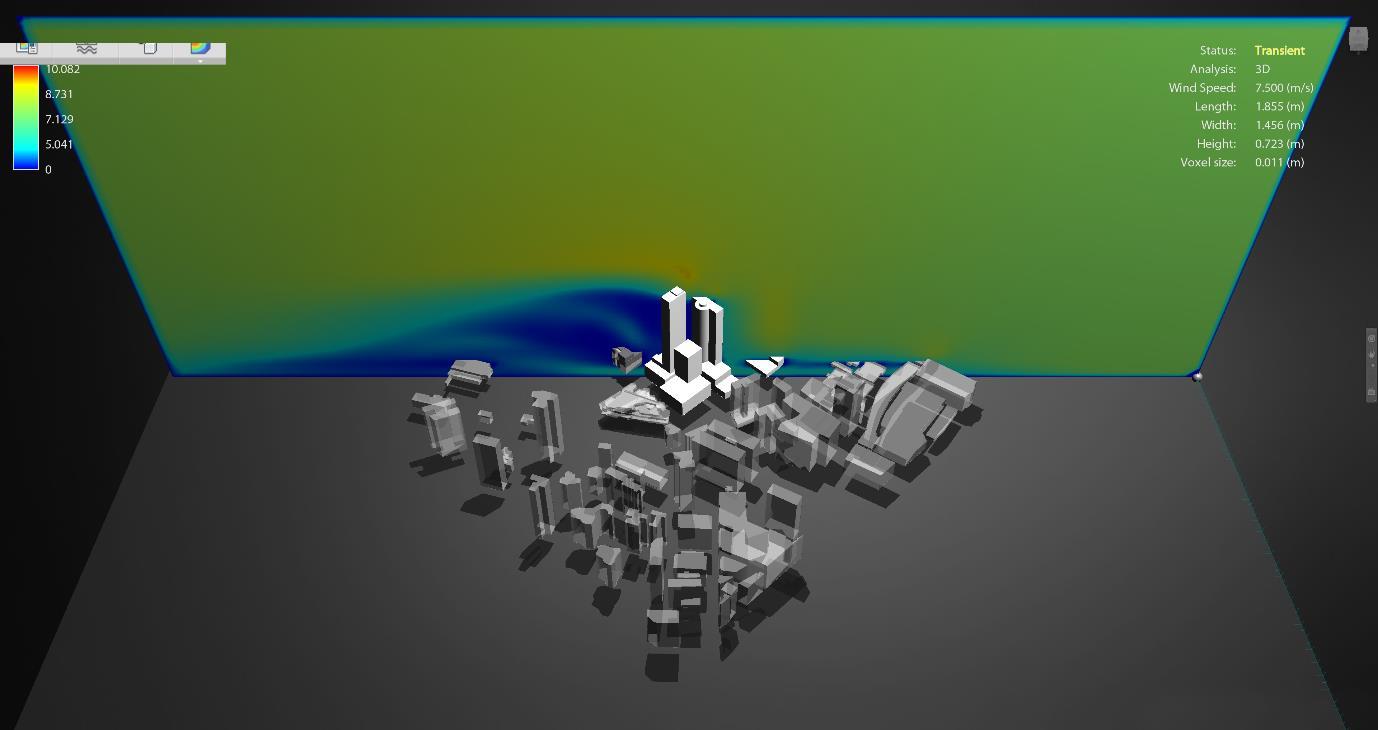
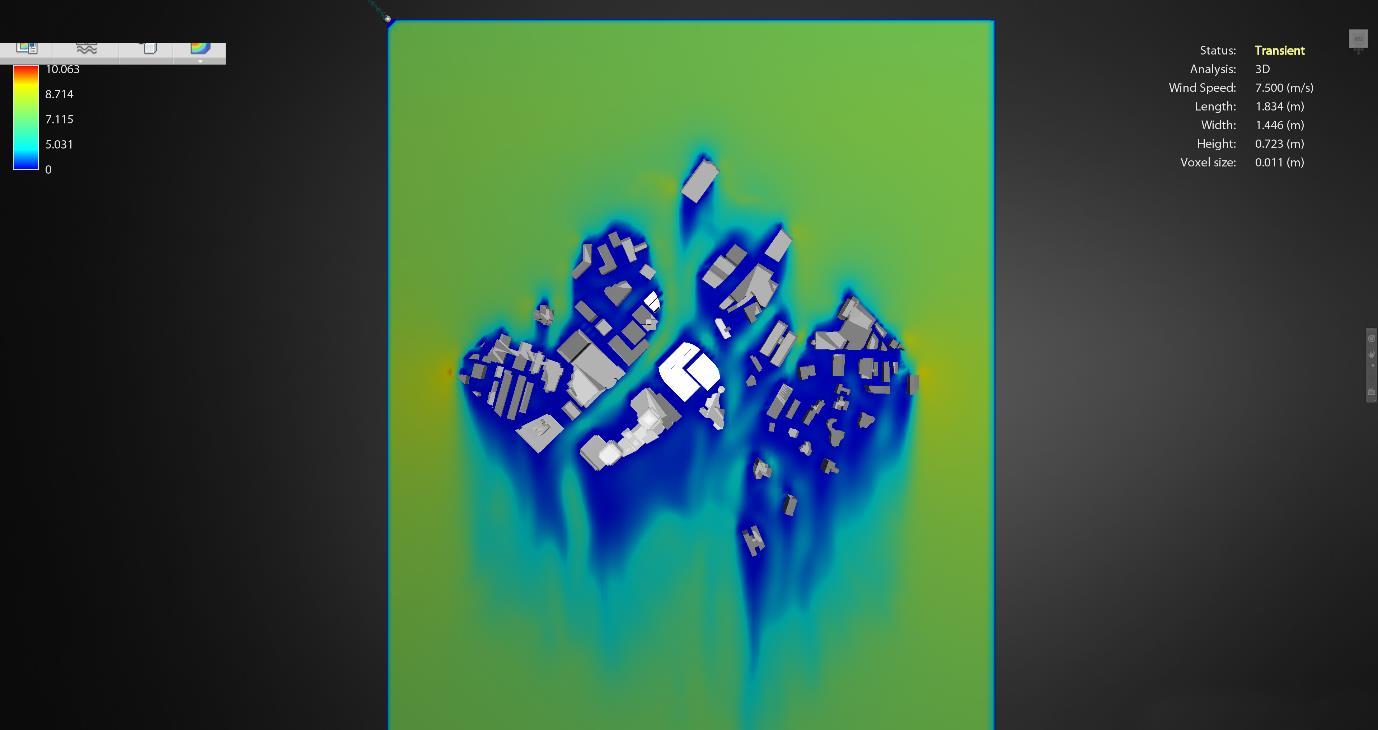
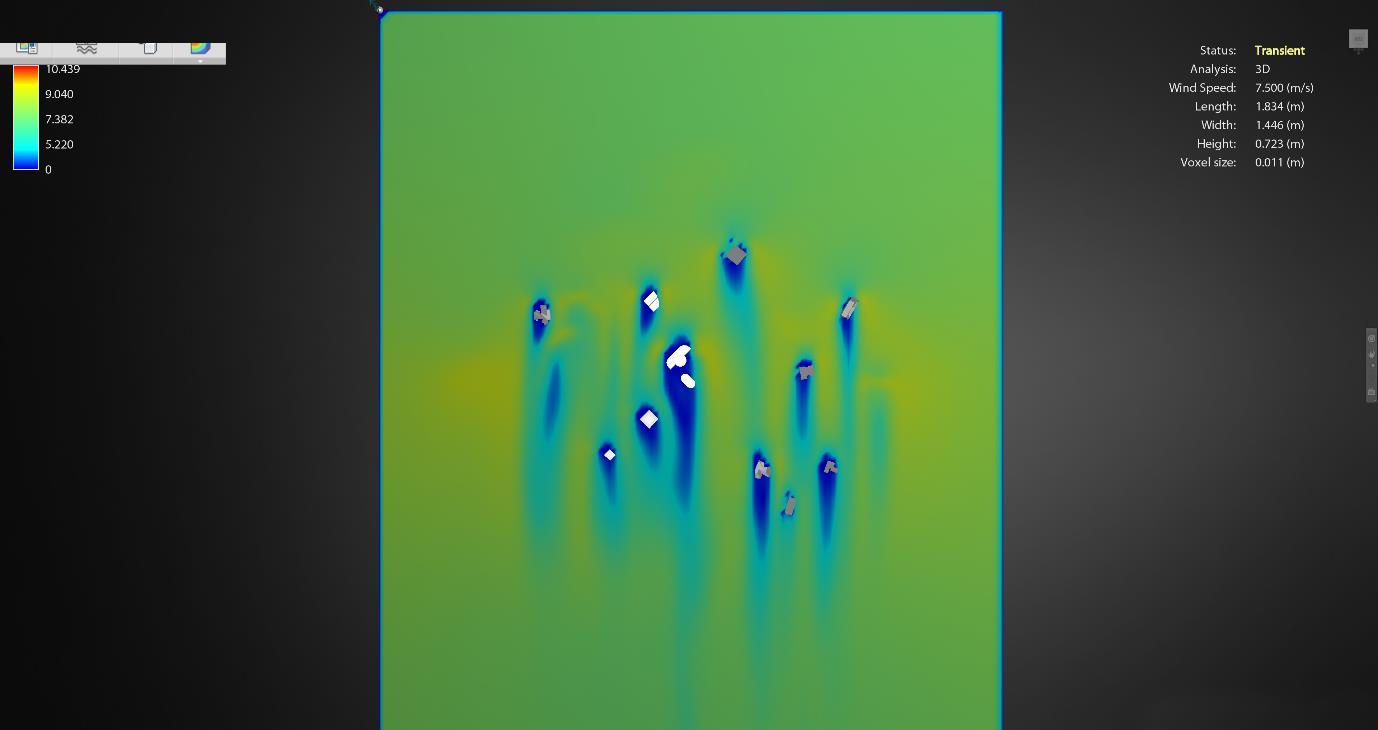
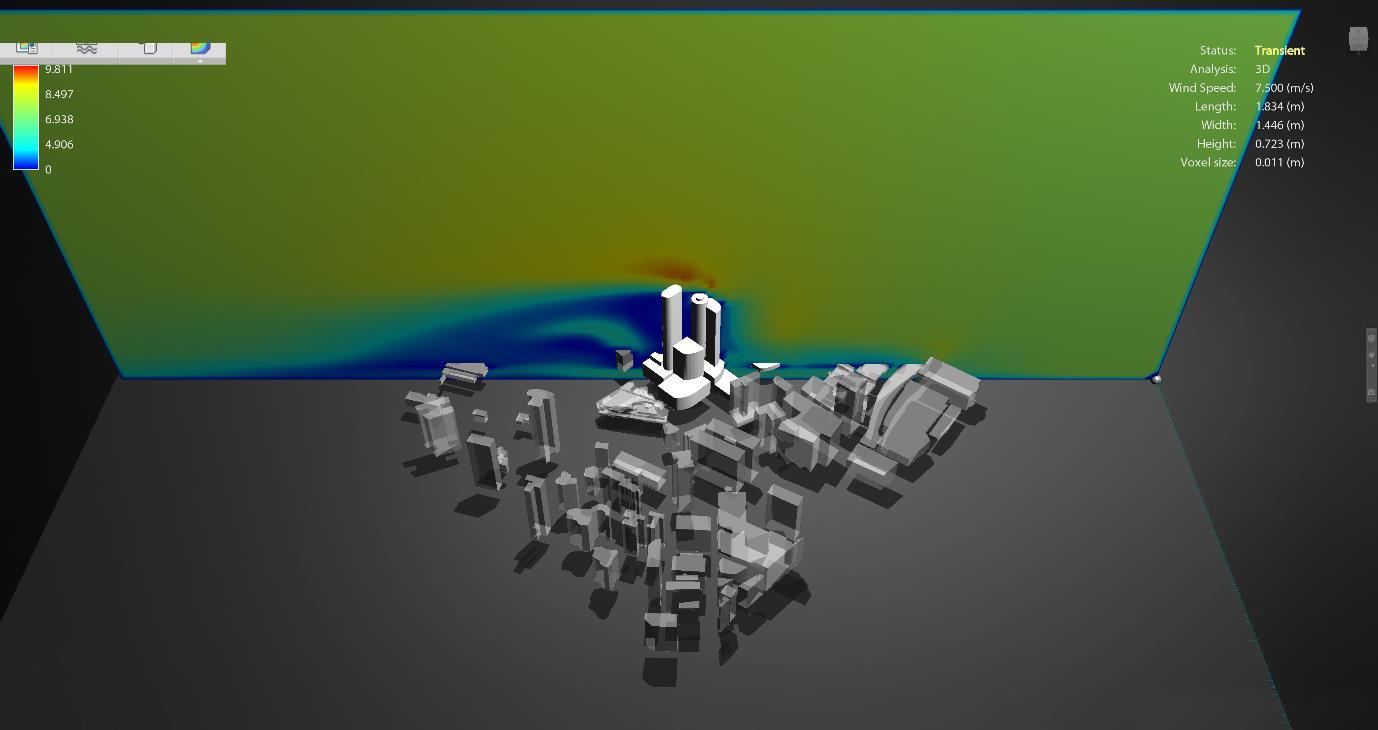
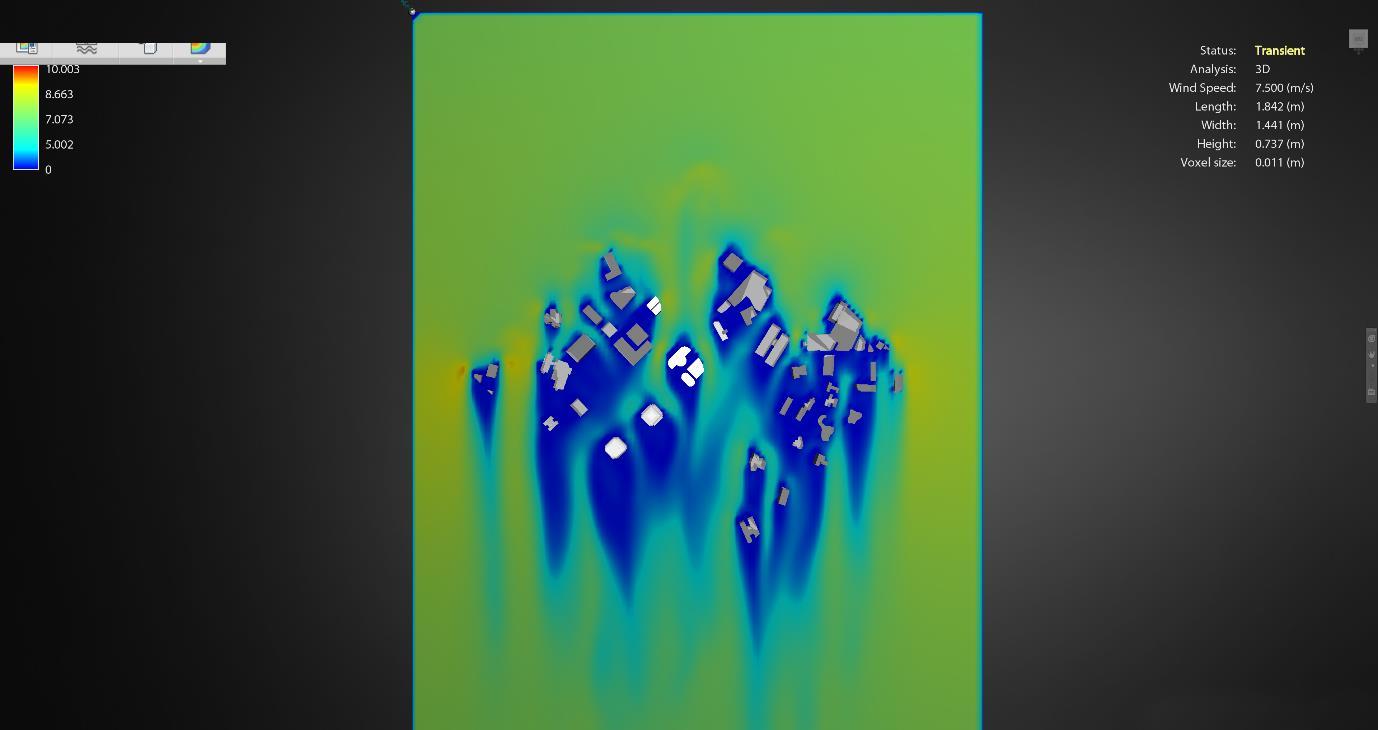
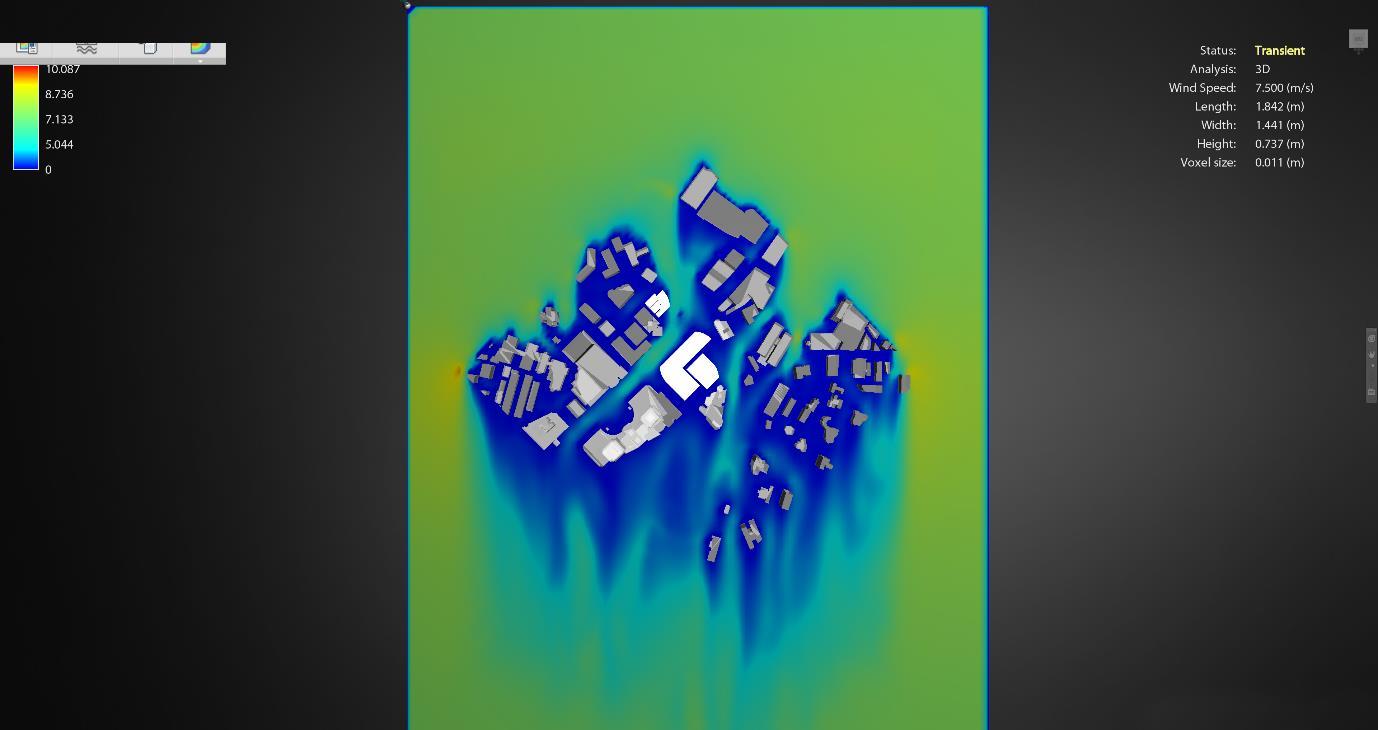
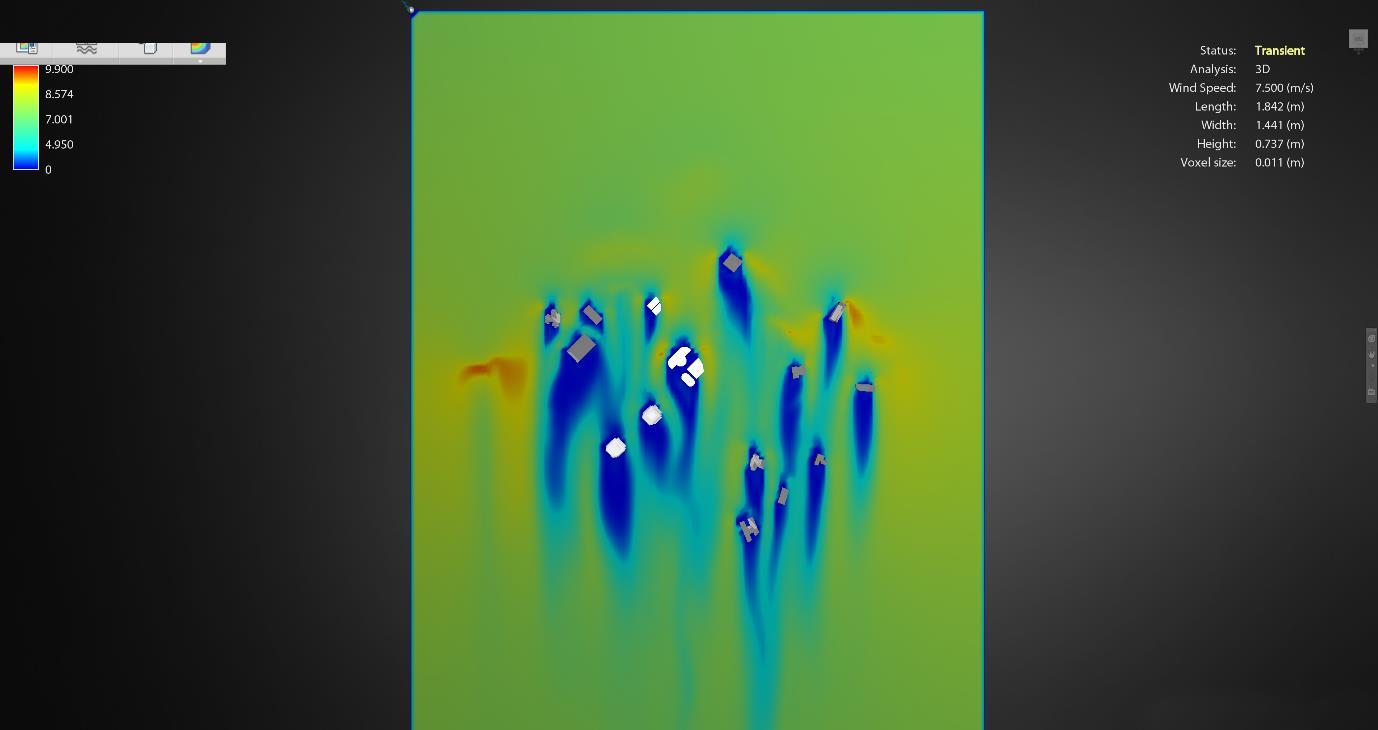
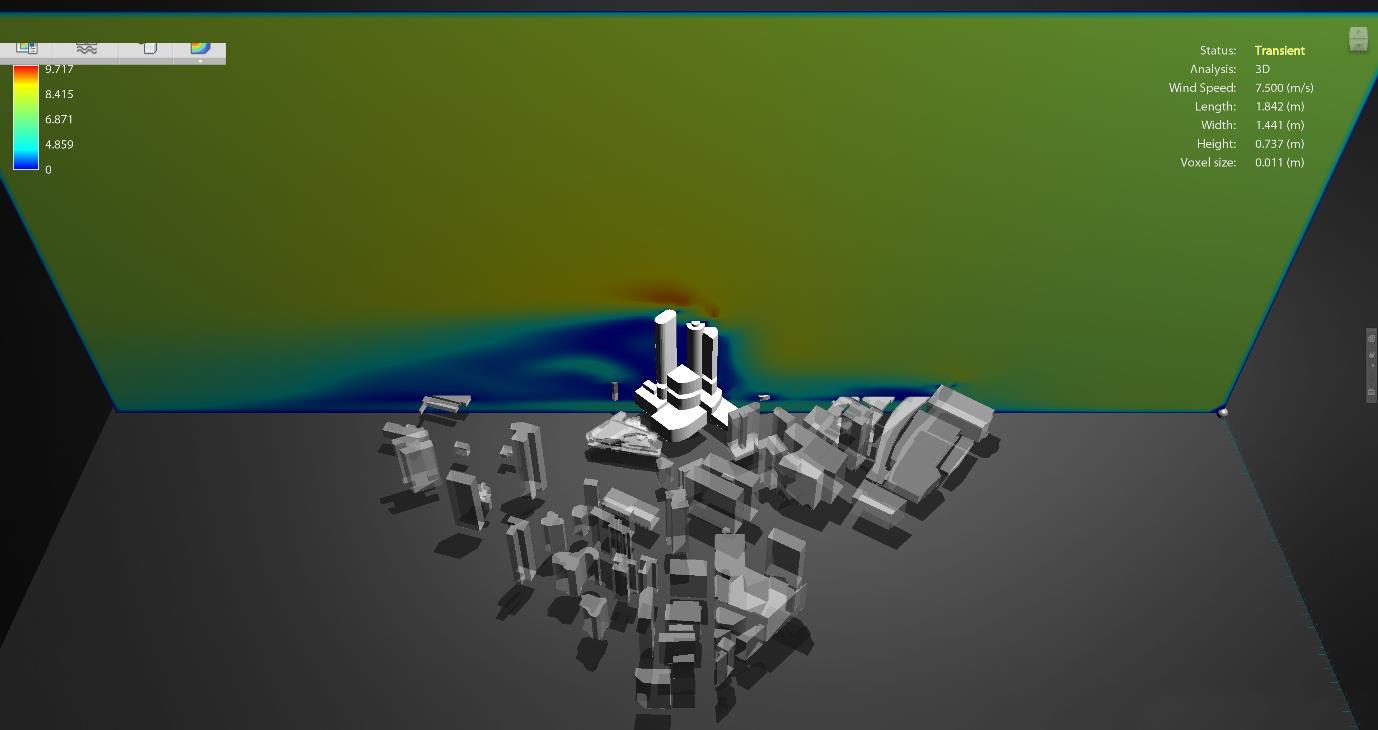
2 The importance of the 2D slice offers a wind calculation at the determined location, horizontally or vertically. The plane delivers a more precise representation as compared to the 3D simulation of flow lines. In addition, the cross-section of wind tunnel allows the user to examine wind profile at three layers, podium level (15m), building layer (15-60m) and urban canyon layer (>60m). The following figures are screenshots of cross section plane at three layers.
2 “Plane.” Autodesk Support & Learning, knowledge.autodesk.com/support/flow-design/learnexplore/caas/CloudHelp/cloudhelp/ENU/FlowDesign/files/GUID-B0FB3A1F-A472-4485-9D47B40E20637B23-htm.html.
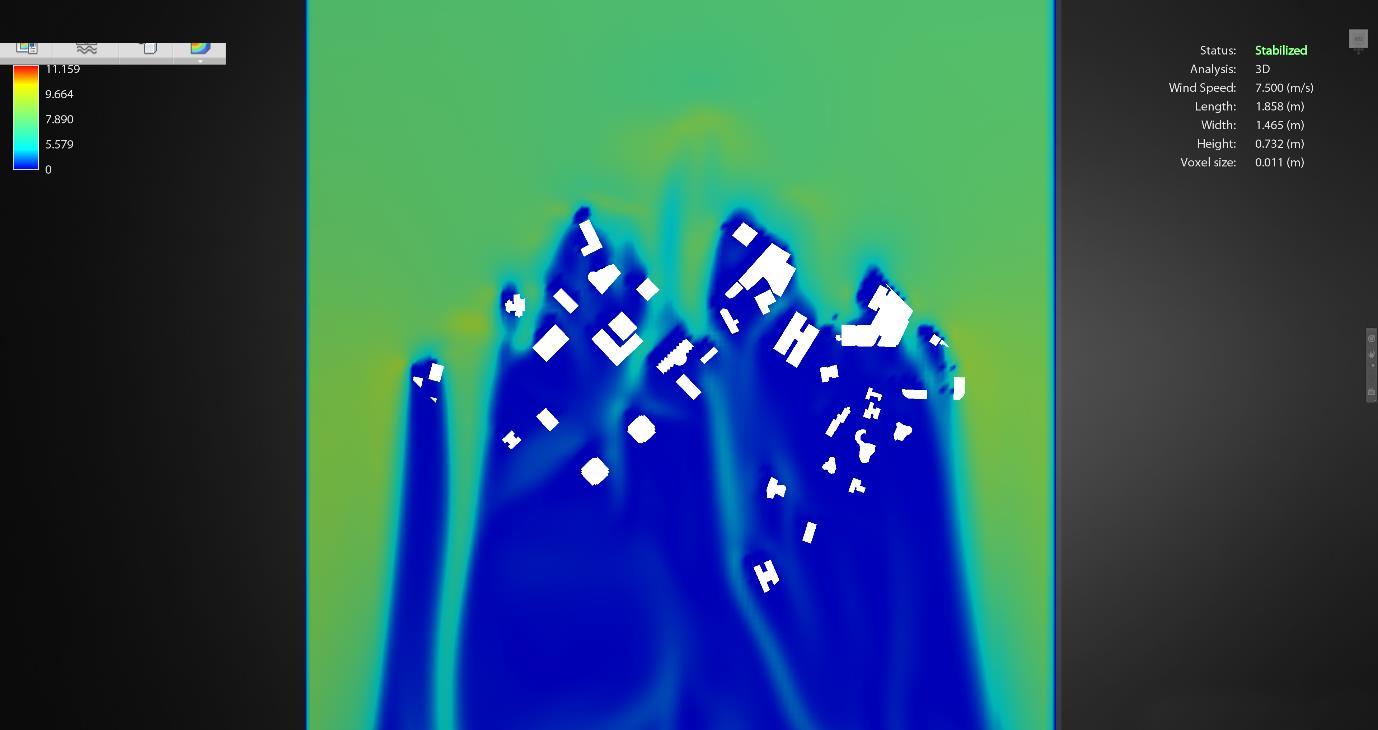
In order to understand and quantify the given information, application of test points is required. The location and amount of test points as well as the analysis will be discussed in the next section.
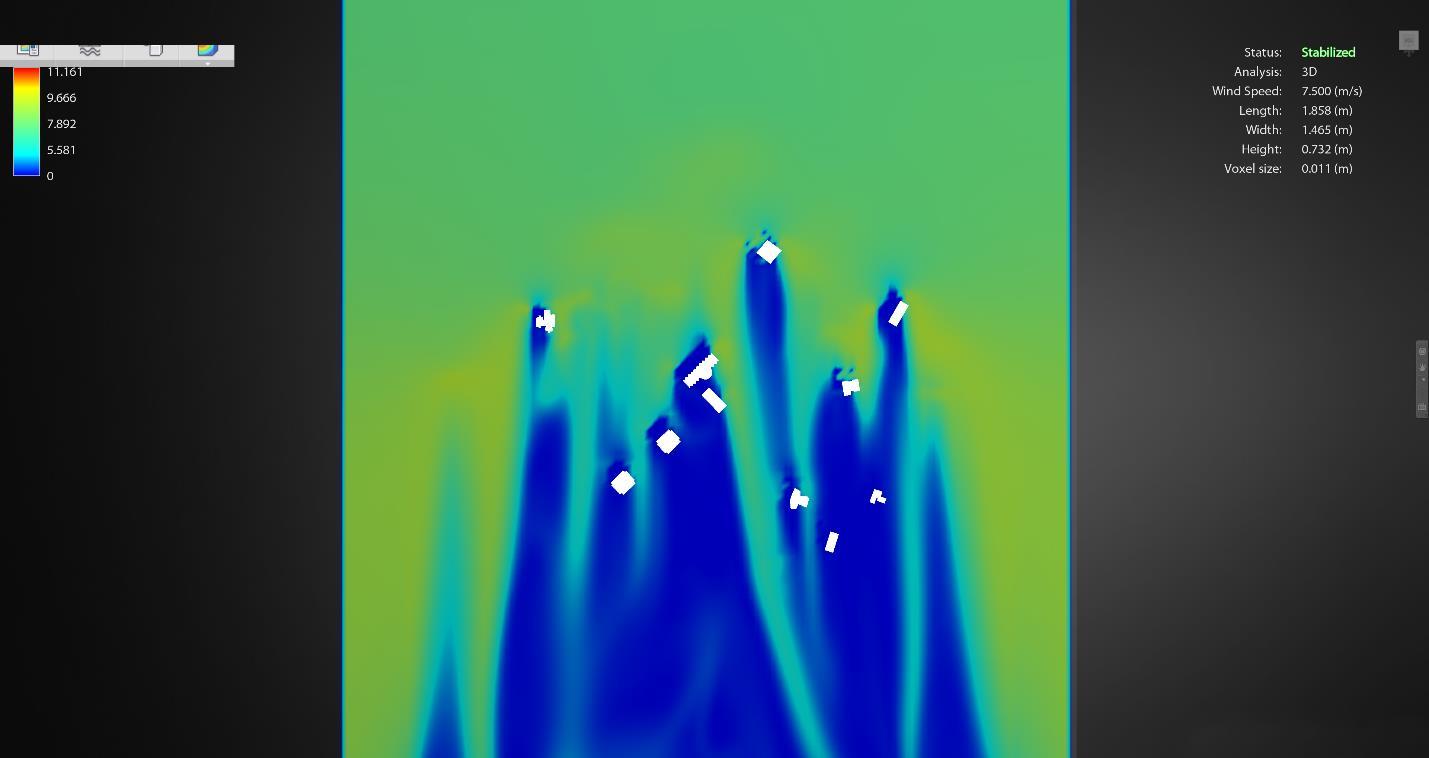
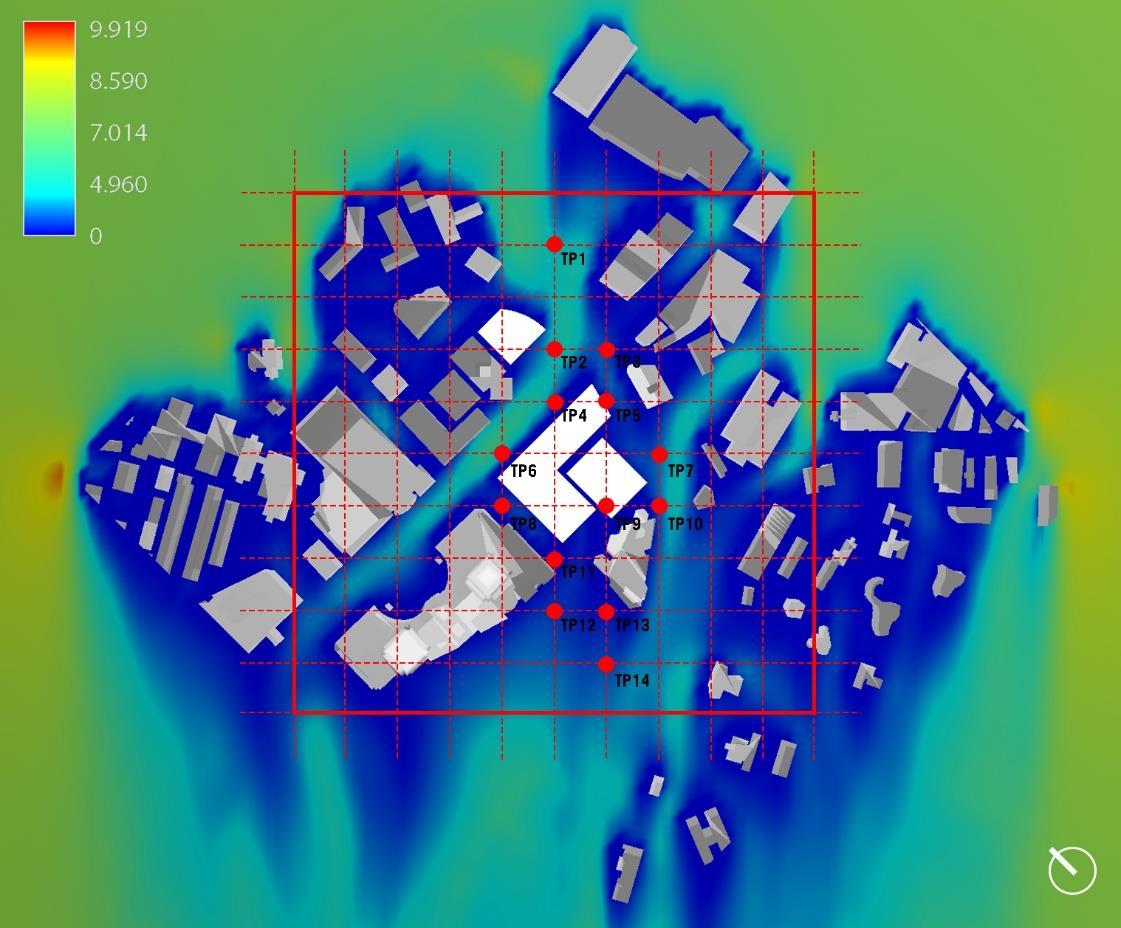
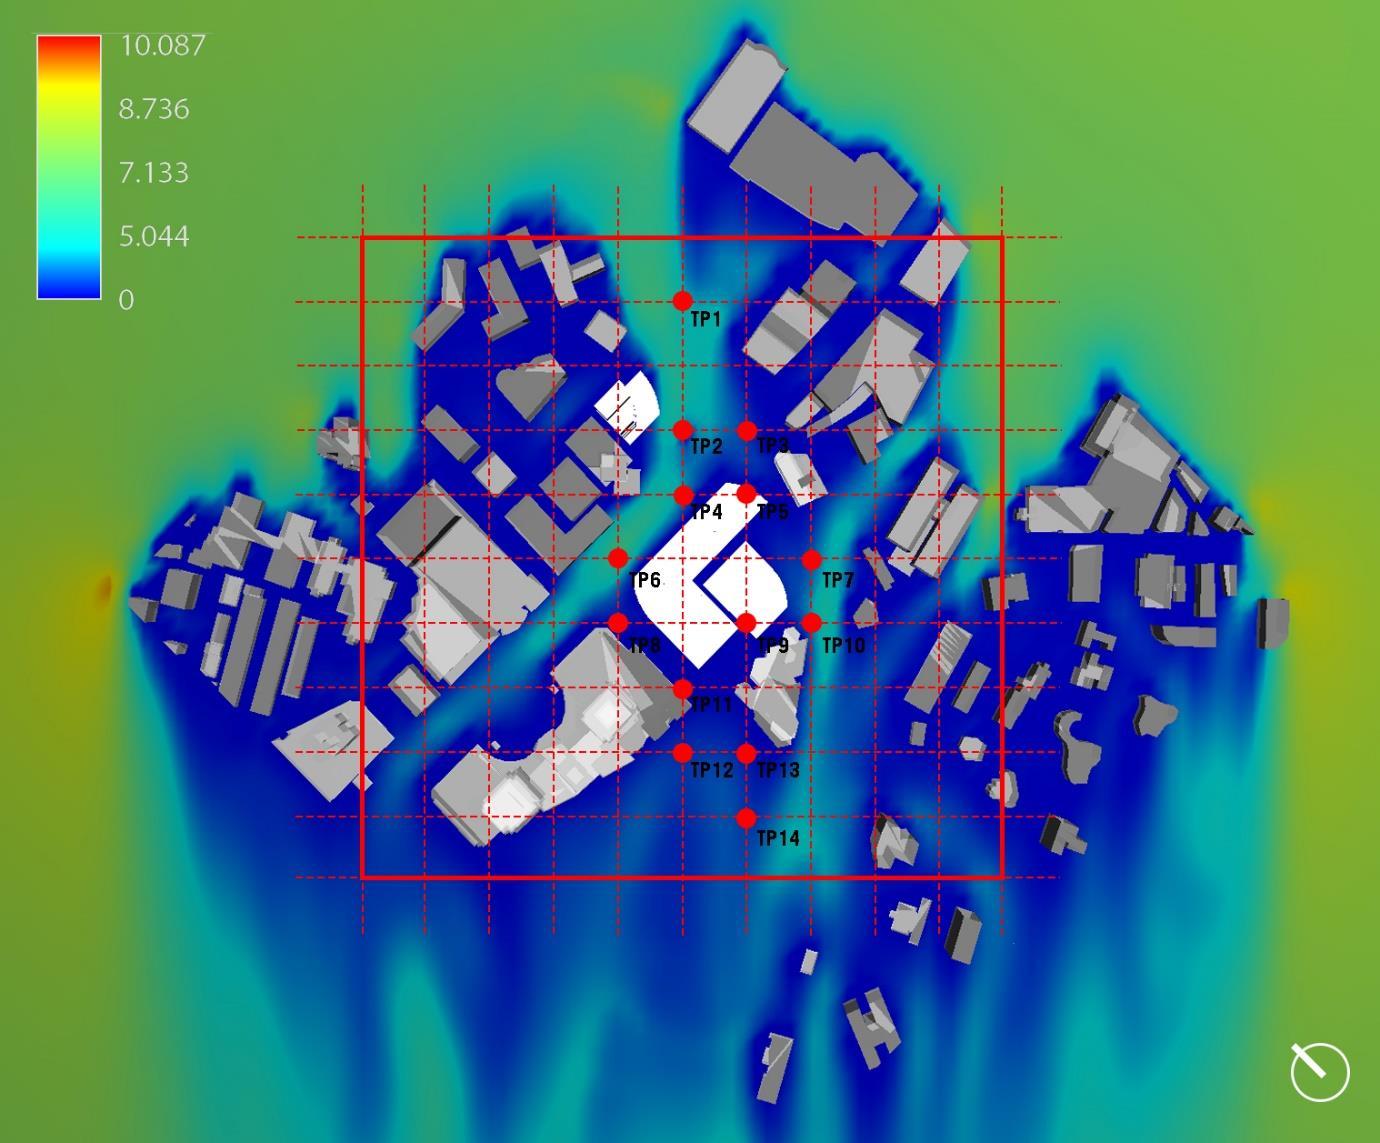
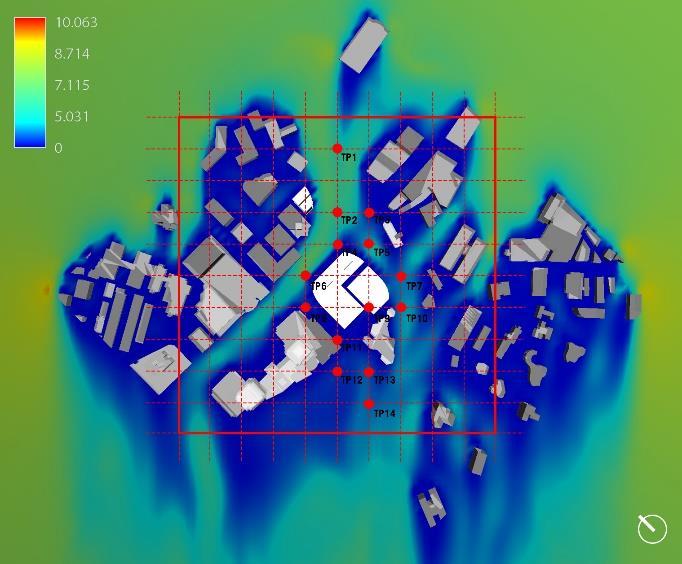
The location of test points is positioned in the 50m grid form. The grid is orientated towards the direction of North-eastern prevailing winds. Here, 14 test points are utilized and distributed on the range of 200 metres from the target buildings. The figure below, displays the superimposing of test points on podium level where there is a high presence of human traffic. The readings of test points are recorded in Table 2.
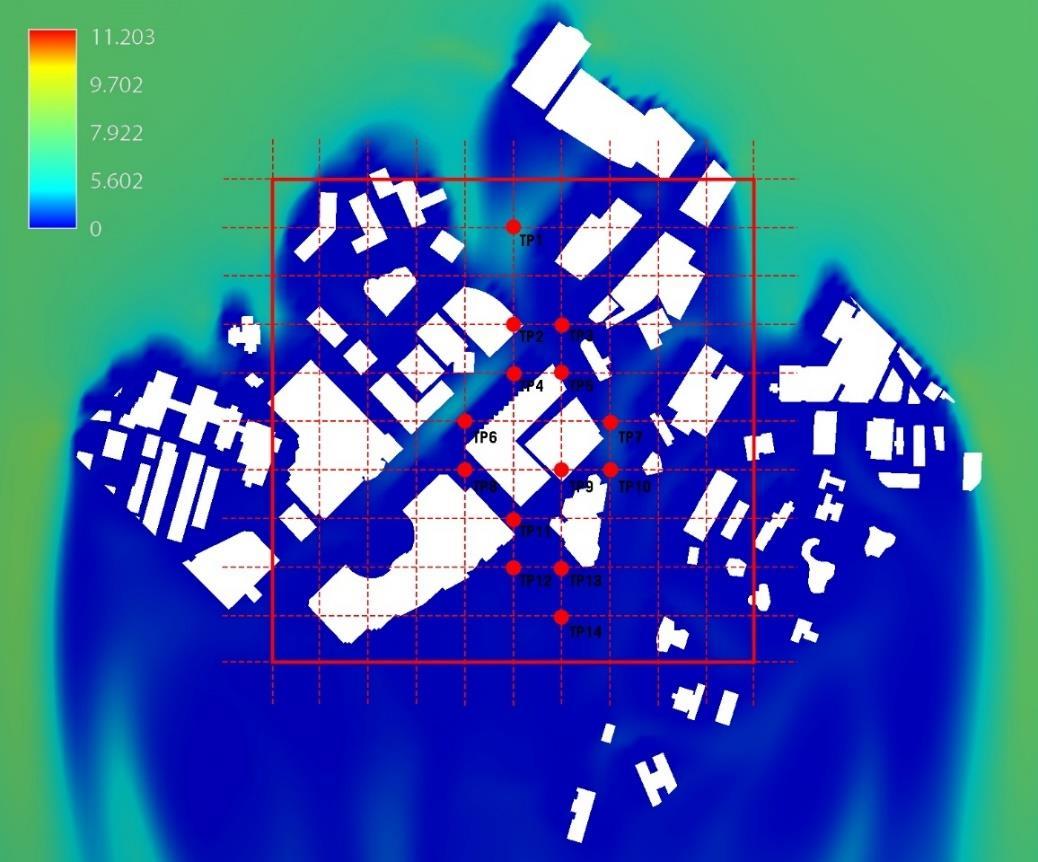
From the reading, the current building massing restricts wind velocity on the podium level. As the NE prevailing winds enter into urban site study, there is a wind velocity of 3m/s on windward side, TP1. As they flow deeper in the site, the wind velocity and ventilation are significantly reduced; particularly, on the leeward sides. The test points around and behind the target buildings, TP8
14. In addition, the walkways along Orchard Road do not receive noticeable wind velocity, TP 4-5. Lastly, the green plot behind Ngee Ann City is affected by the similar situation, TP 12- 14.
With the existing conditions, list of strategies will be discussed to mitigate low wind permeability and improve the thermal comfort in Orchard Road.
This section explores the various iteration of the original massing. The aim to improve on the existing design will be implementation by specific design strategies. The iterations are based on an experimental approach. The following strategies are:
1. Horizontal Porosity
2. Vertical Porosity
3. Ground Coverage Ratio + Height Variation
4. Ground Coverage Ratio with Building Geometry
5. Integration
Additionally, considerations and design parameters are required to form a more structured experiment. The three considerations are:
1. Retain building typology, Tower and podium blocks.
2. Maintain the volume of massing.
3. Uphold design sensitivity in the urban context, i.e. the height restrictions.
As such, this section consists of five massing iterations. Each iteration will be presented with a description of the applied strategies and a hypothetical airflow. Thereafter, the iteration massing will undergo simulation tests to determine the outcome and results. The results will be examined through the application of test points. Lastly, a short evaluation will be discussed to identify areas for improvements.
3.1 Iteration A-0
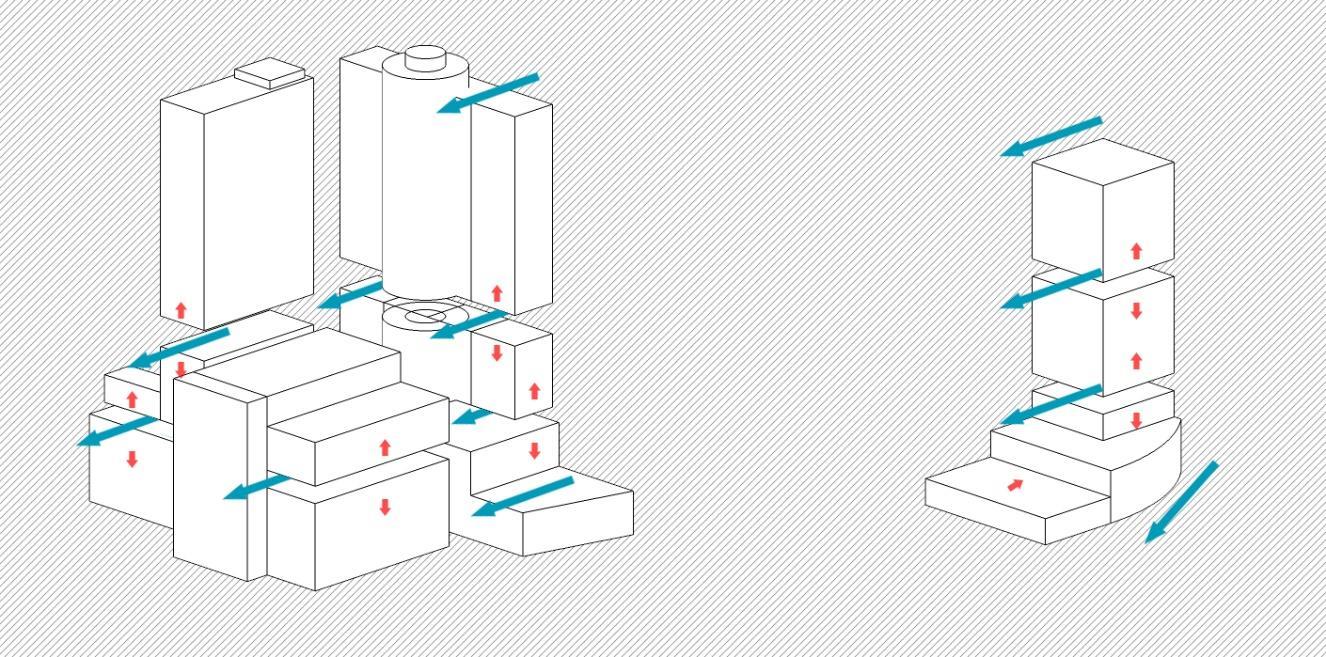
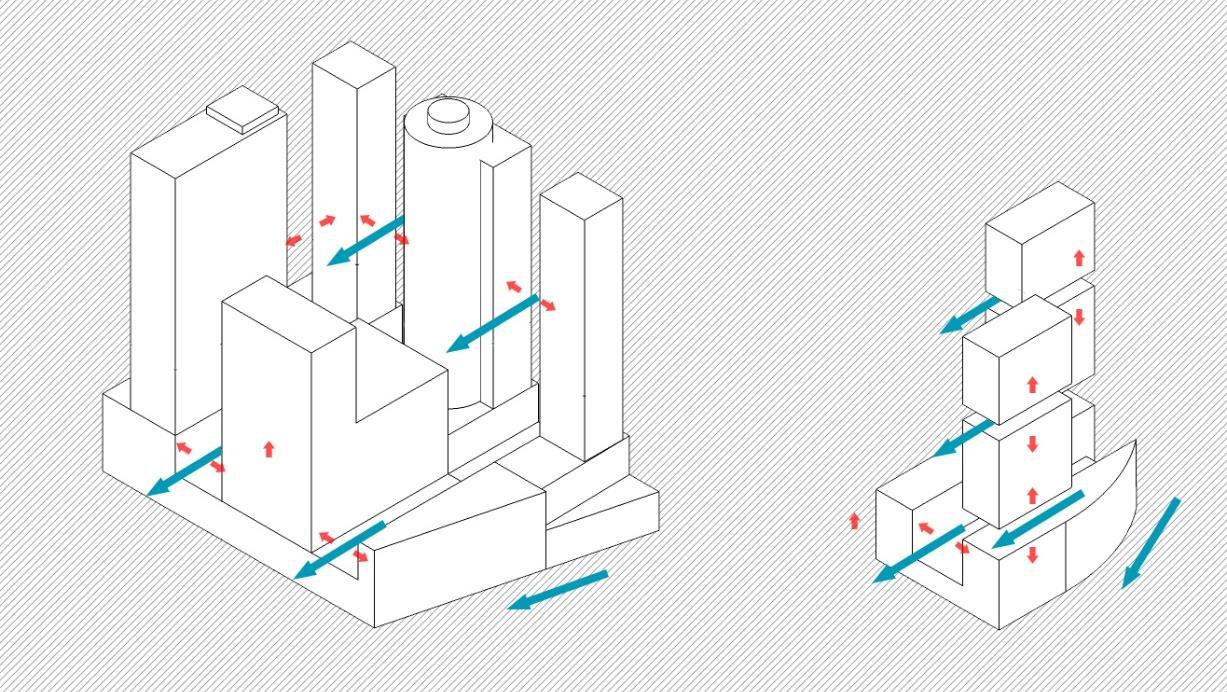
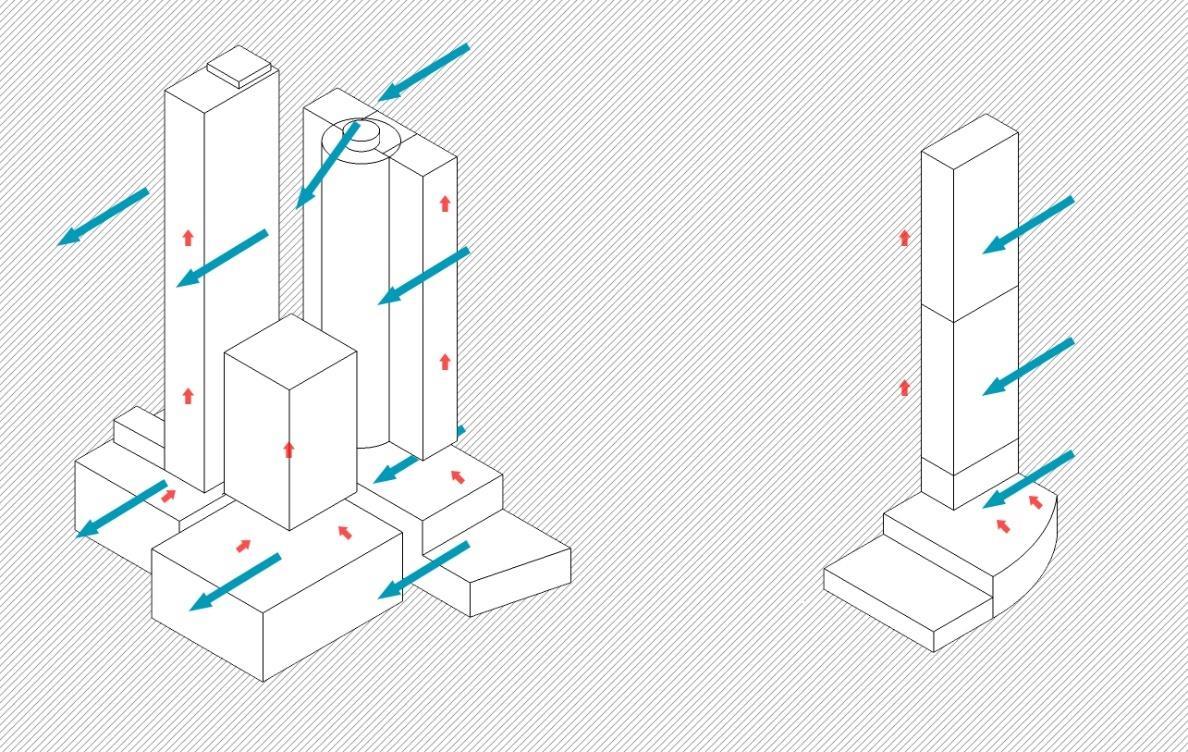
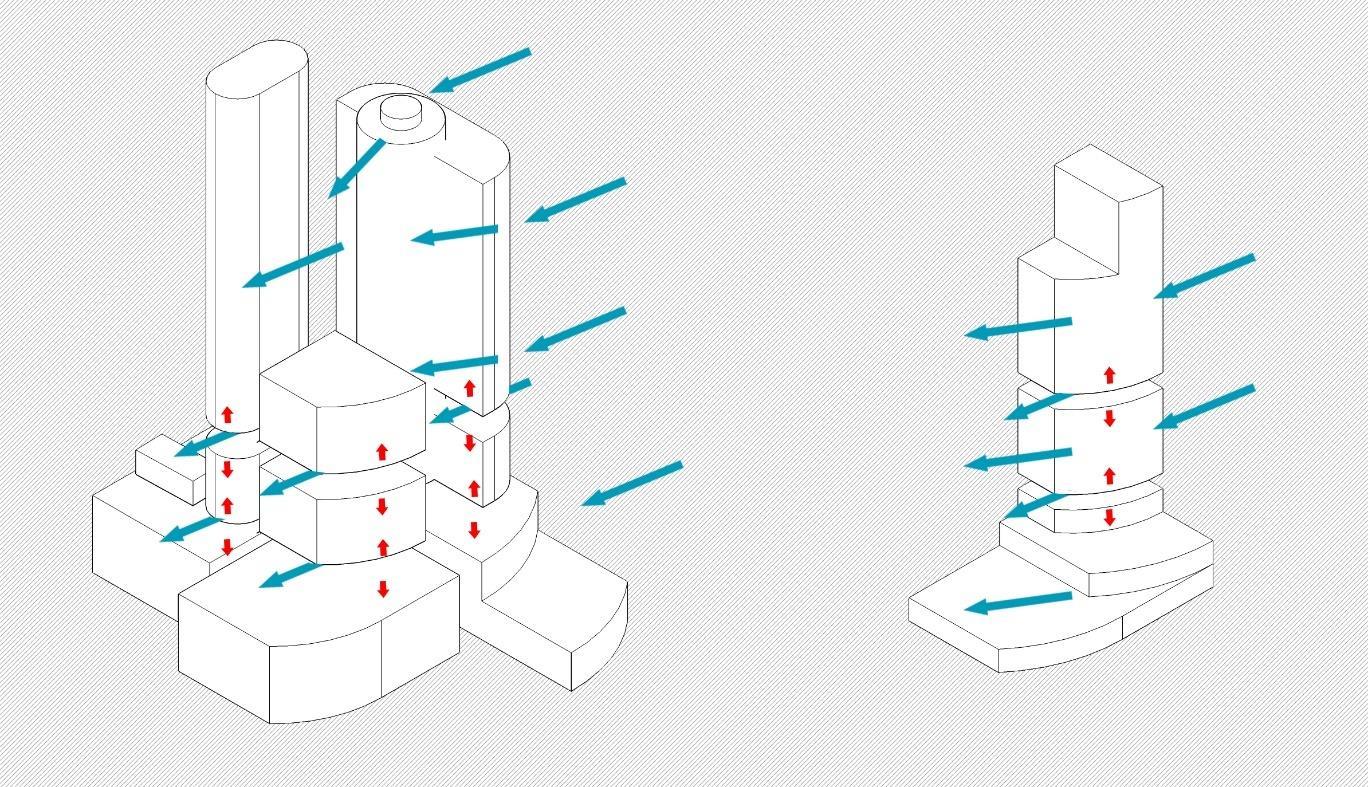
The first iteration involves the utilisation of horizontal porosity. Retaining the existing building typology, the target buildings consist on towers on podium blocks. The existing massing is fragmented into parts according to the three urban layers, podium, building and urban canyon layers. Horizontal voids of 6 meters are created, (1) between the tower and podium blocks and (2) between the tower blocks. This aims to improve wind permeability and potential airpaths through the urban context and target buildings. Additionally, the podium of The Heeren is terraced and increased in height. The terraces of podium ‘washes’ the street air, improving the air ventilation on the podium levels. Moreover, Cineleisure block is fragmented into two parts, creating a horizontal void. Both target buildings, Mandarin Orchard + Cineleisure and The Heeren form a relationship of dependency to achieve a desired outcome. The figure above, demonstrates the design intent and how wind may be travel hypothetically.
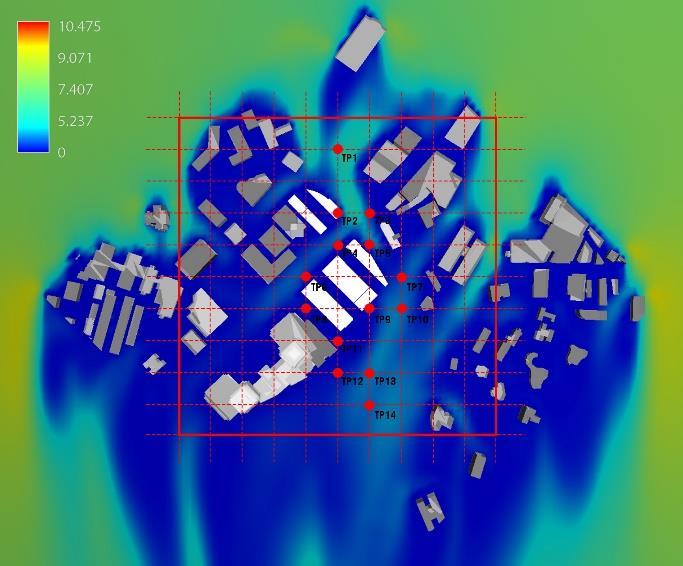
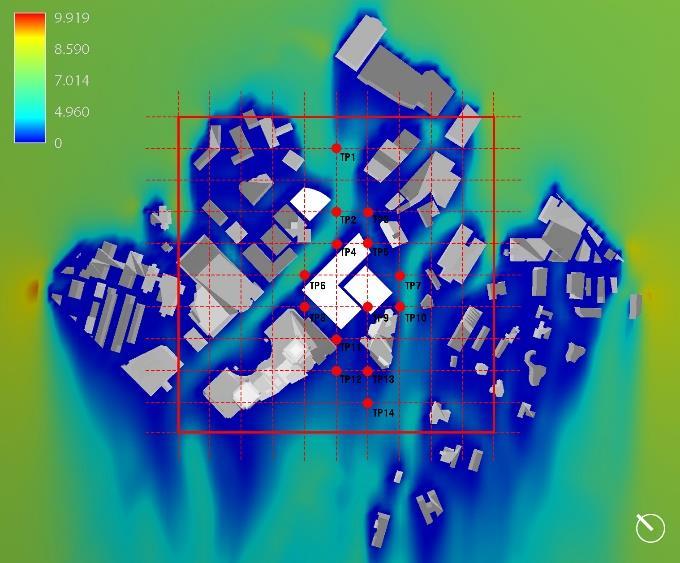
From the results, there is a noticeable improvement in wind velocity on the windward side, specifically, TP1-2. The terraced podium on The Hereen directs and generate wind velocity to the walkways along Orchard Road, TP 4 and 6 where estimated velocity reaches 2m/s.
Referring to Figure 1, the velocity is considered as light breeze felt on face. However, due to the shape of podium, wind is not directed through the narrow road between Ngee Ann City and Mandarin Orchard, TP 8 and 11. Furthermore, the leeward side of NE prevailing winds, test points around and behind the target buildings have not significantly improved,
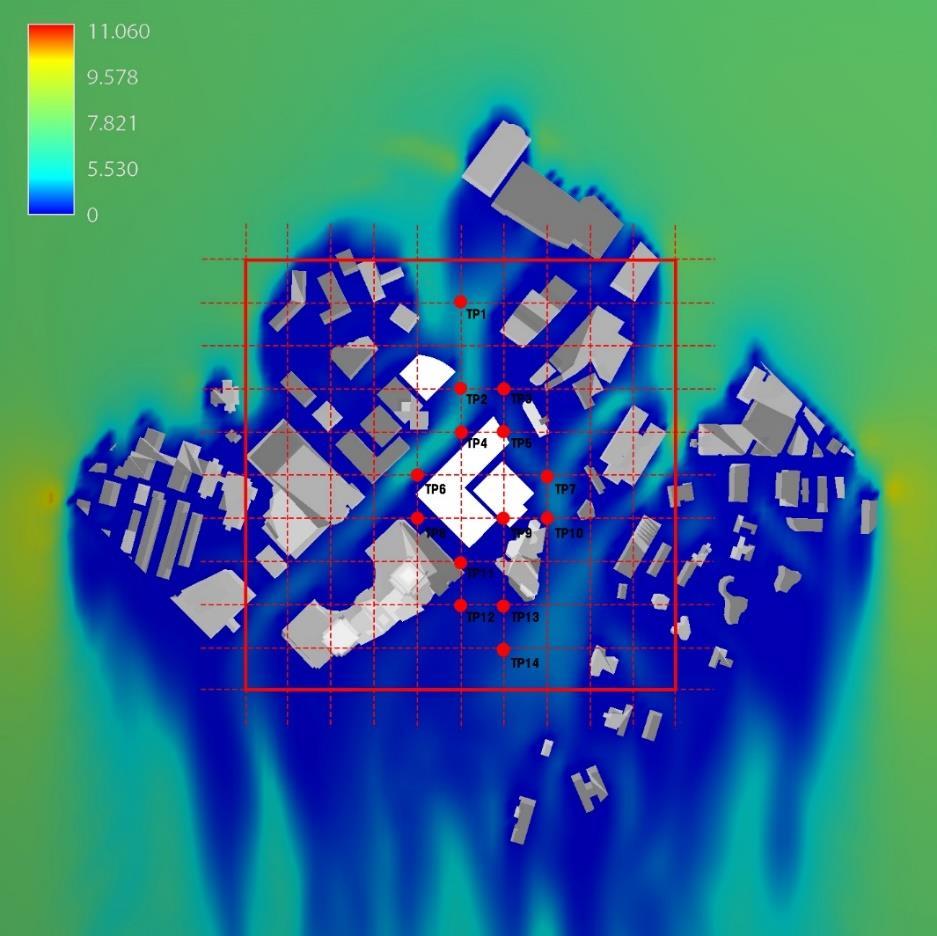
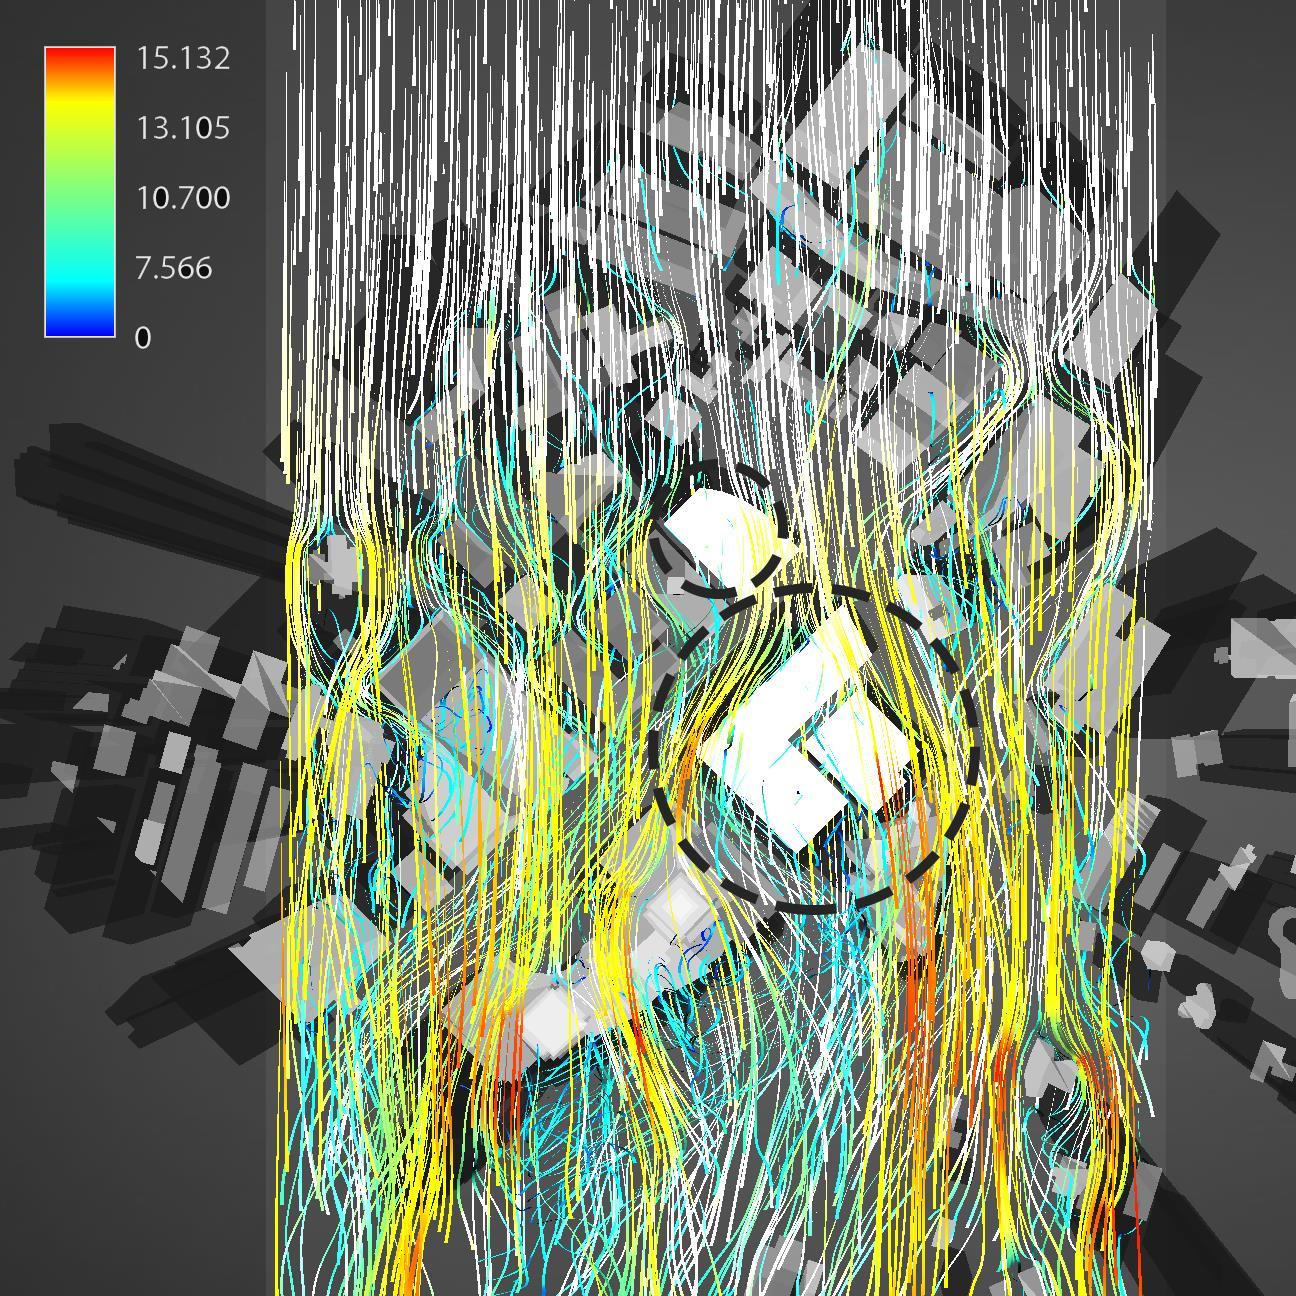
particularly, TP 9 – 14. Appendix A would illustrate the completed simulation results of plane calculation.
The implementation of horizontal porosity demonstrates improvement in airflow through the target buildings. The hypothetical airflows are relatively correct. The figure displays the direction of flow lines below:
The second iteration involves the utilisation of vertical porosity. Similar to the previous iteration, the implementation of porosity aims to improve wind permeability and potential airpaths through the urban context and target buildings. The target buildings are fragmented and split vertically (1) between the individual tower block of Mandarin Orchard (2) tower block of The Heeren The tower blocks are then re-positioned on the podium with cavities in-between. The distance between building block is approximately 15-20 meters. Additionally, ‘Valleys’ are formed across the podium blocks, allowing wind to permeate. Similar, the design of the target buildings forms a relationship of dependency. The figure above shows the hypothetical airflows that demonstrate how wind may be travel through the vertical cavities.
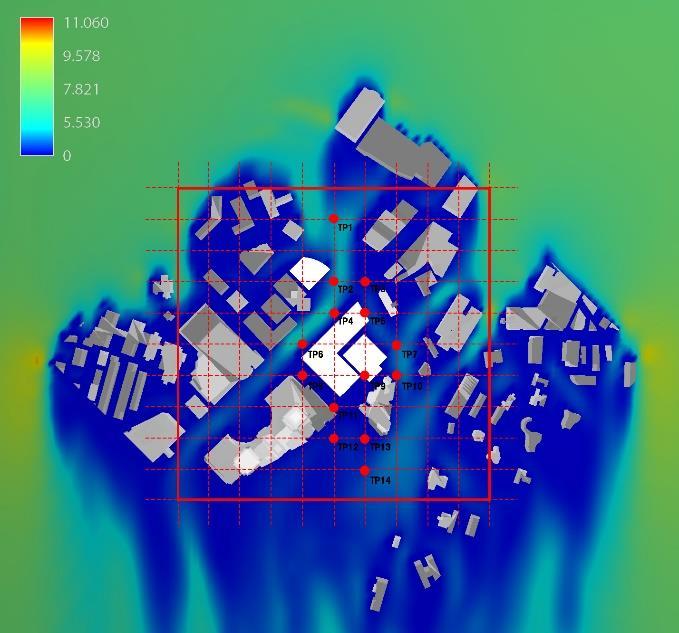
From the results, there is no significant improvements of wind velocity from the existing massing and the Iteration B-0. The implementation of 20m wide vertical porosity do not encourage much wind permeability through the target buildings. In fact, the wind velocity at those areas were at 0m/s. However, in the leeward side of Cineleisure, TP 7-14, wind
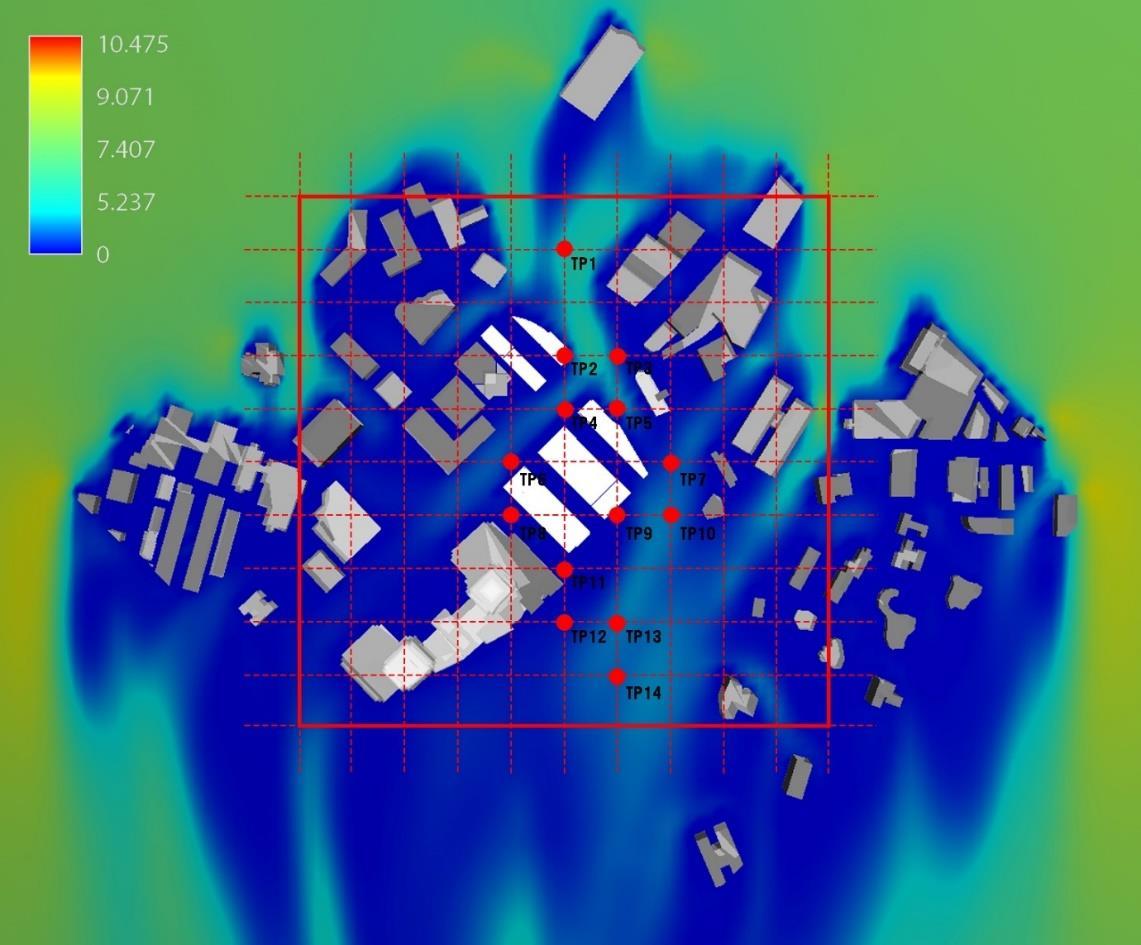
velocity increased slightly to 1-1.5m/s. From the figure above, the reason for increased wind velocity is due to the Frontal Density of the podium block, which directs the airflow to the deeper parts of the city. Compared to Iteration B-0, the podium with ‘valley’ does not encourage and generate potential airflow to walkways along Orchard Road. The readings of test point 4
6 are at 0.5 and 1m/s, respectively. The only improvement is windward side at TP1 – 2, where wind velocity reached 6 and 5m/s respectively.
The simulation test confirms that the hypothetical airflows are incorrect. This may be due to the presence of large cavities between the individual towers where they do not encourage much wind permeability. The figure illustrates the direction of flow lines below:
The third iteration involves the alteration of building coverage ratio and varying building heights. Here, the building typology is maintained while the tower block volumes are altered to reduce the building coverage ratio. The volumes are stacked, resulting in the narrower tower block. For Mandarin Orchard, the footprint of the towers is reduced, increasing in height. The height of tower blocks varies at 165 metres and 125 metres. In addition, the tower block of The Heeren stands at the height of 135meters. The aim of varying building height encourages circulation of airflow between the buildings. Furthermore, the narrow tower blocks may be utilized to dictate the direction of airflow. Cineleisure podium block is redesigned with a low raised tower above the podium block. This helps to create a consistent building separation between the tower and podium blocks, allowing wind to permeate. The hypothetical airflow hopes to explain how varying building height and reduction of building coverage ratio improve wind permeability and potential airpaths.
From the results, there is a substantial improvement of wind velocity when compared to existing massing and previous iterations. The windward sides, TP1-2 have improved significantly with velocity of 6.5 and 5m/s respectively. With reduction of building coverage ratio and terrace podium of The Heeren, wind velocities on the walkways along Orchard
Road have been heightened to 5m/s. However, on the leeward sides, more improvements are desired. Readings of TP 9 -14 have not improved.
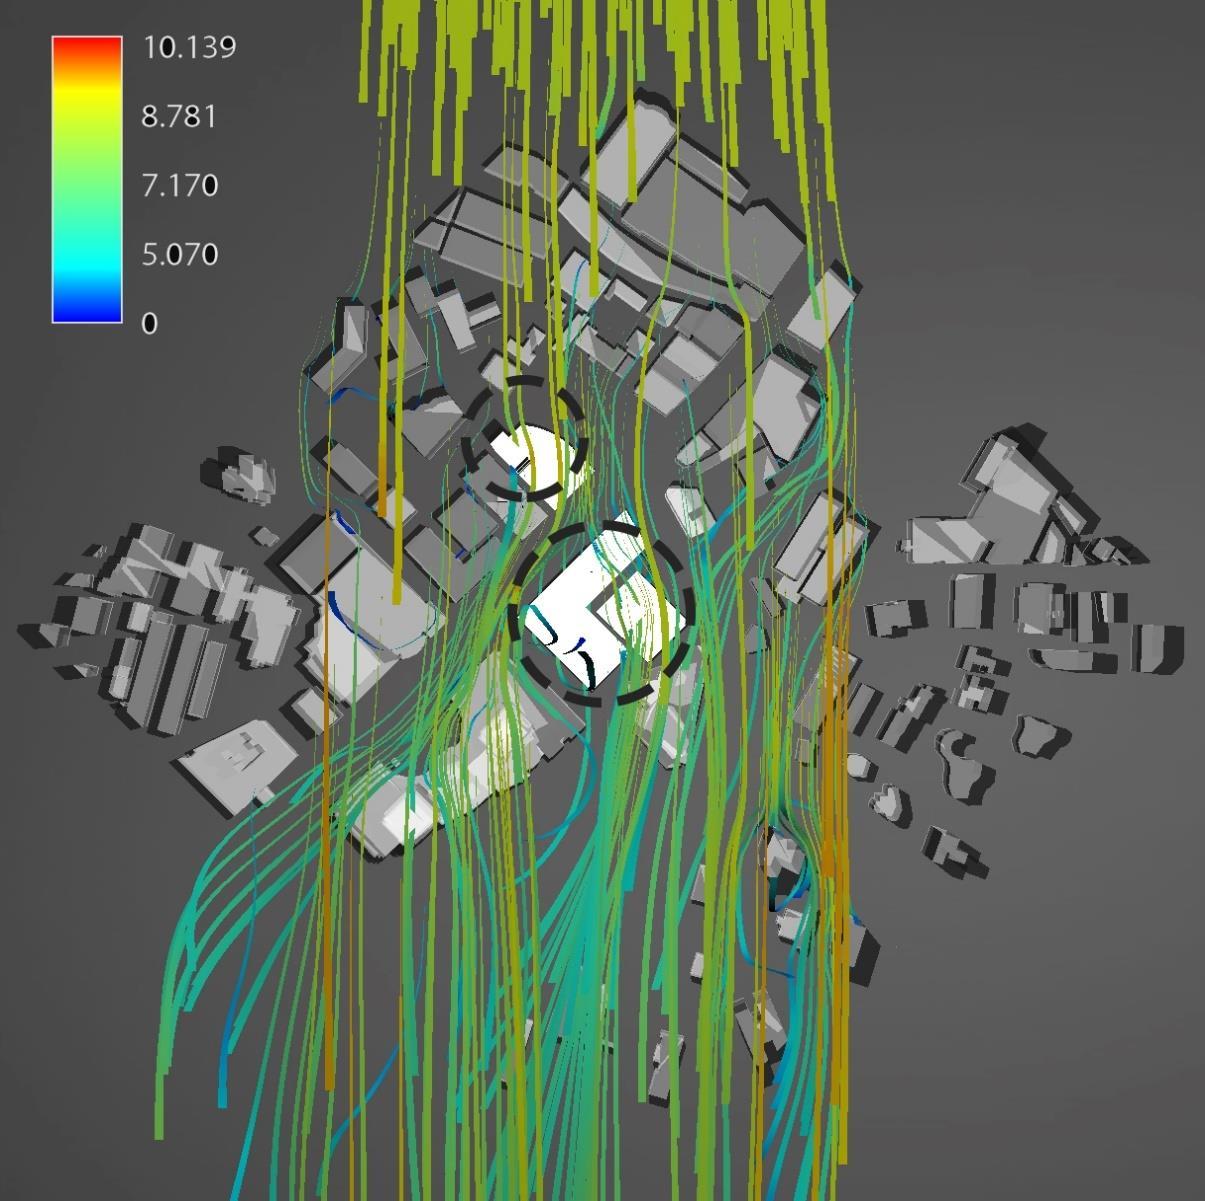
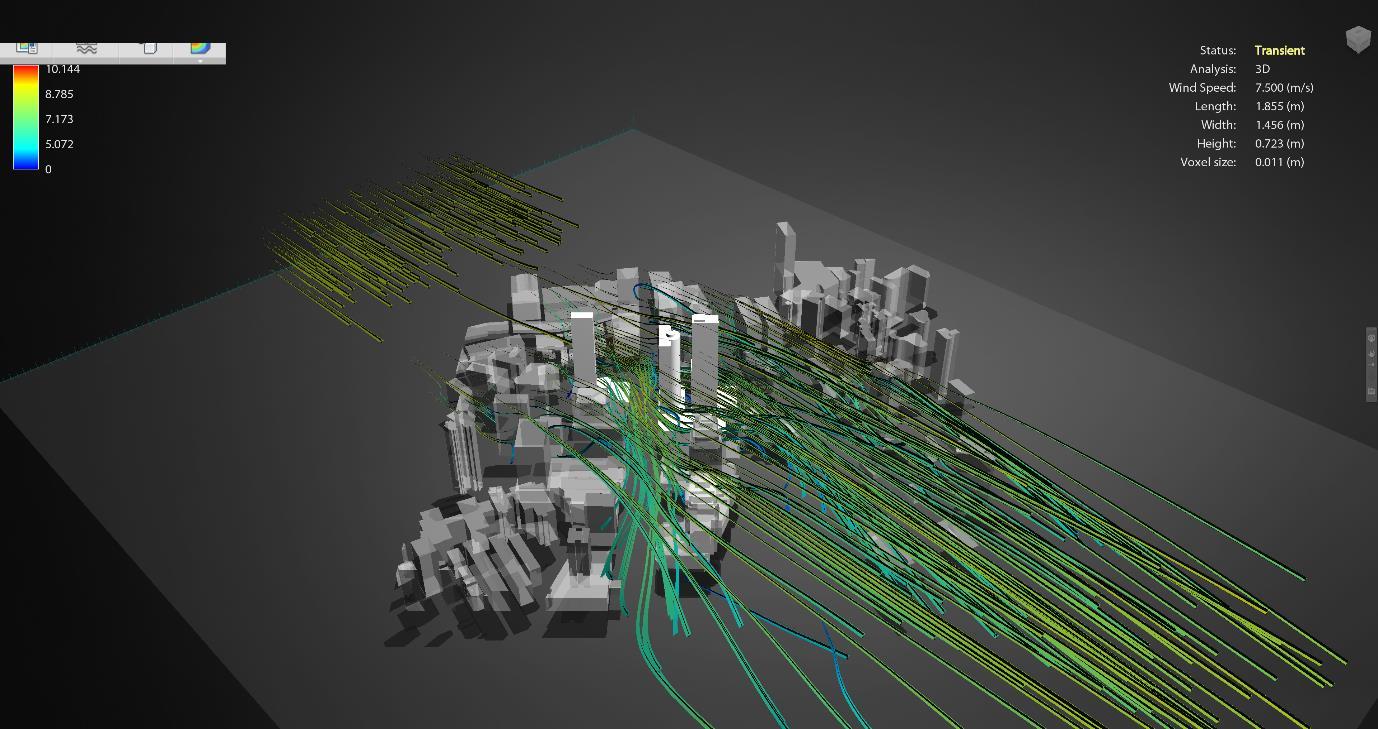
The simulation test confirms that the hypothetical airflows are relatively correct. The narrow and tall tower block helps to dictate the inflow of NE prevailing winds, noticeability to the walkways along Orchard Road, the green plot behind Ngee Ann city and areas behind the target buildings. The figure illustrates the direction of flow lines below:
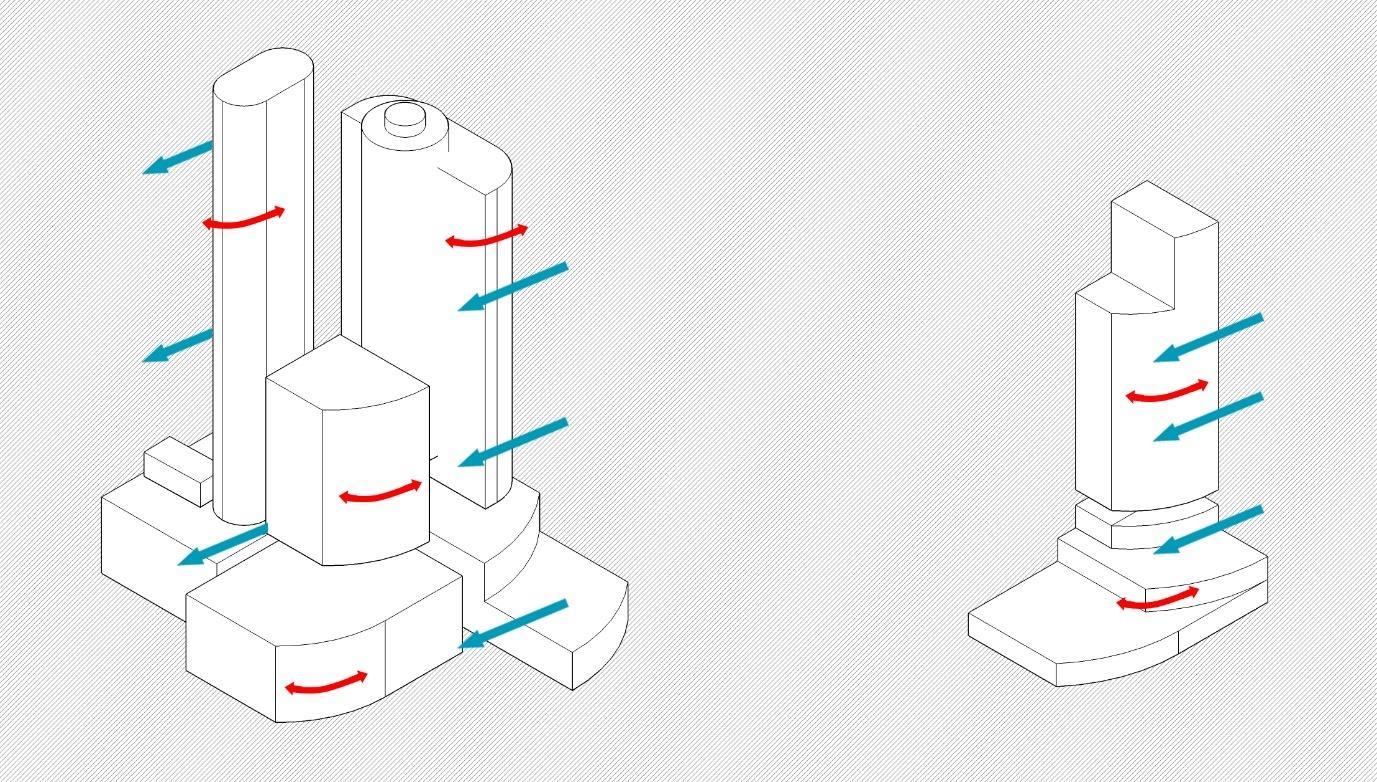
The fourth iteration is an extension from the previous iteration. The experimental approach of considering the frontal density and drag coefficient of the building block aim to reduce air resistance and speed up wind velocity. In addition, it may help direct the inflows of prevailing winds and encourage the formation of determined airpath. Retaining the volumes from the previous iteration, the geometries of massing blocks are curved on the sides, creating a more streamline geometry. The implementation aims to minimise wind resistance, speed up wind velocity and allowing airflow to be directed to the deeper parts on the site domain. The hypothetical airflow shows how wind is travelled around the target buildings.
The results reveal the enhancement of wind conditions where wind velocity and ventilation are improved. The consideration of frontal density and building geometry assist in redirect the inflow of wind. The prevailing wind from the North Eastern enters the site domain with a
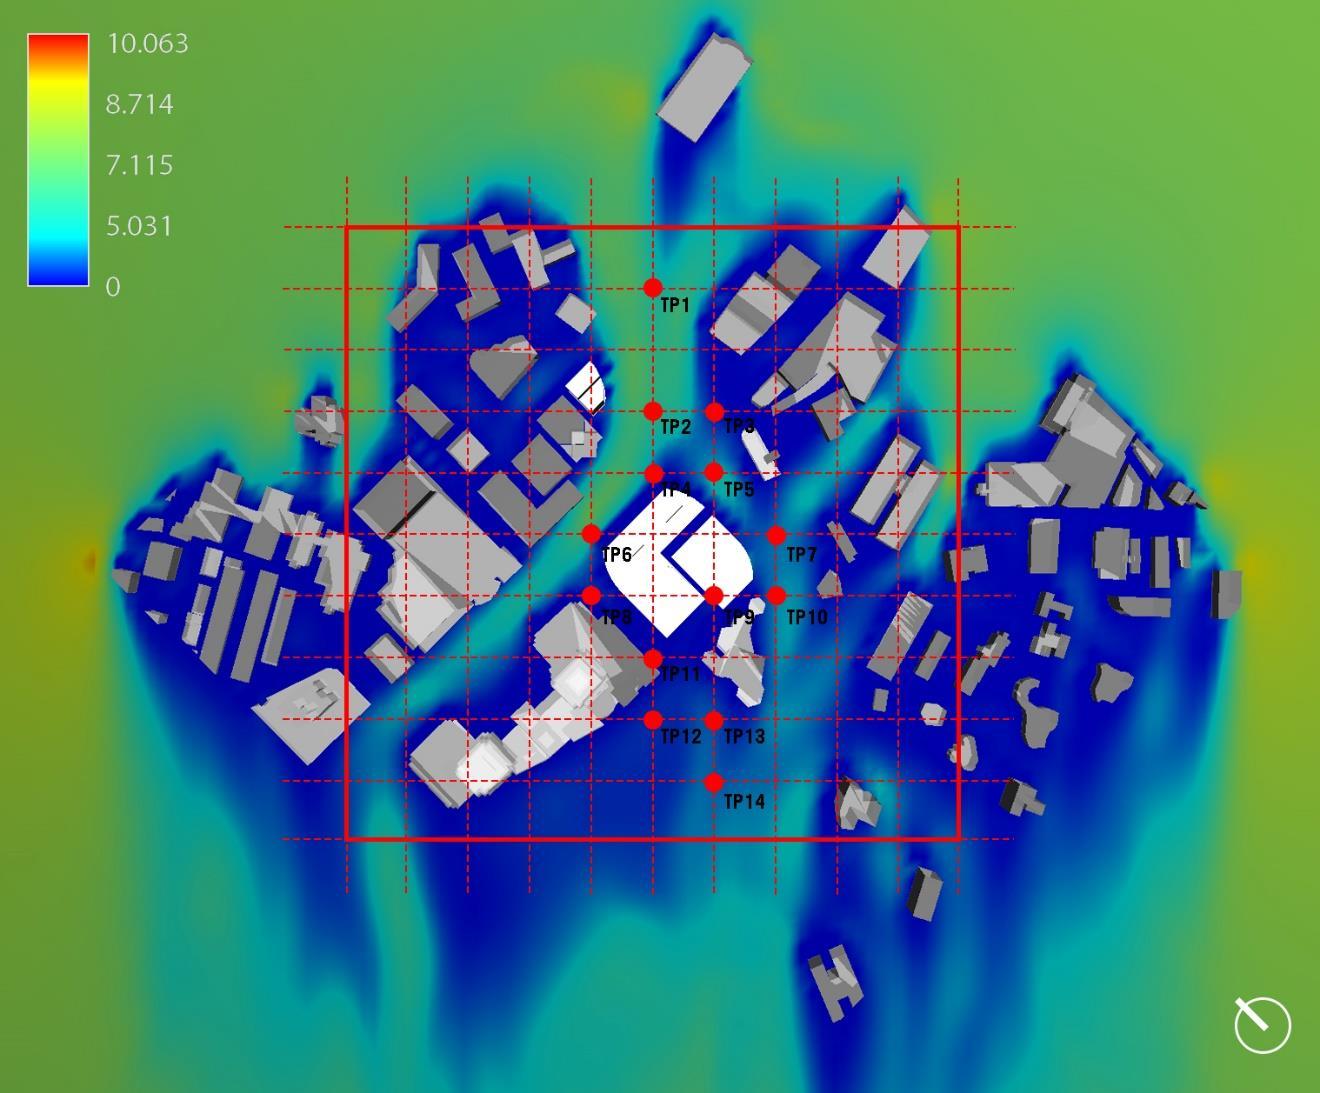
velocity of 7m/s, TP 1 – 2. According to Figure 1, ‘moderate breeze’ will be felt at these points. The most noticeable improvement is the walkway along Orchard Road. The curved geometry of tower and podium blocks provide high wind permeability, due to the reduction of air resistances. This is reflected in the readings of TP 4 and 6, where velocity is 7m/s. In addition, TP 5 has significant improved to 5m/s. The test points in the leeward side of target buildings have also improved slightly.
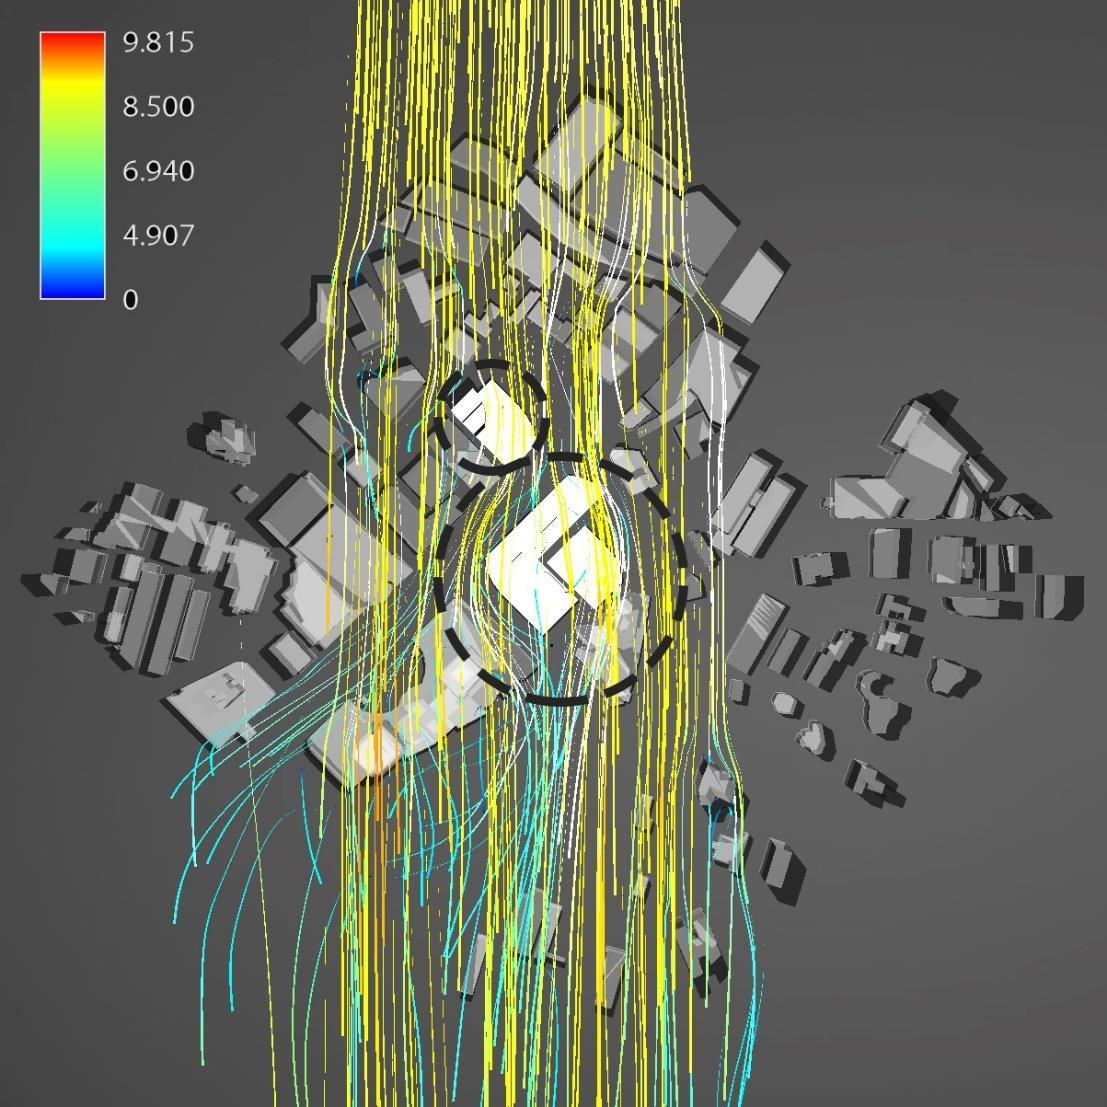
The simulation test proves that the hypothetical airflow are correct. The direction of flow lines indicates that the implementation of frontal density and drag coefficient
The last iteration involves the integration of several strategies. The strategies are selected based on the positive results. The strategies from Iteration A-0 and B-1, Horizontal Porosity and Building geometry are integrated. The horizontal opening on curved tower and podium blocks are formed to increase wind permeability through the buildings and allow more wind to be penetrated deep in the site domain. The dimension of horizontal openings from Iteration A-0 and Geometries from Iteration B-1 are replicated to form an iteration. Iteration C-0 aims to achieve a more optimised readings of wind velocity and ventilation. The figure above displays how wind will be travelled on a hypothetical level.
Comparing the results from Iteration B-1, there is a slight improvement in the terms of wind velocity. In TP 1-2, the new readings are recorded at 7 - 6m/s respectively. This is compared
to Iteration B-1 TP 1-2, where the wind velocity reaches 6.5 to 5m/s correspondingly. However, comparing to Iteration A-0, there is a large improvement. Generally, the readings of Iteration A-0 and D have comparable readings. This round of simulation suggests that the implementation of horizontal porosity does not significantly improve the reading of Iteration B-1. In addition, the importance of frontal density and building geometrical shapes are essential in enhancing the wind conditions and ventilation.
The figure below displays the direction of airflow through the site domain. A similar reading to Iteration B-1 suggest that porosity in building mass do not necessarily encourage wind permeable through the target building. Most of the airflow travels pass the sides of the building. As such, the hypothetical airflow is not entirely correct.
Test Points Plane @ Podium level Iteration Design Strategy Diagram
Existing -
Remarks
The existing massing obstructs airflow on podium level. Most of test points are at 0m/s.
The implementation of horizontal porosity shows an improvement, noticeably on the walkways. Leeward sides are affected.
The intention of vertical porosity was not satisfied. The formation of valley on the podium block did not encourage wind to pass through. Additionally, there is a decrease in wind velocity on the walkways.
The consideration of building coverage ratio and height variation show a large improvement in the windward and leeward of the target building. The target building helps to direct airflow, constructing new airpaths in the site domain

The alteration of building geometry shows a better improvement. Noticeably of the ingress of NE prevailing wind. In addition, a continuous airflow on the side of Cineleisure can be seen.
The integration of strategies do not necessary improve the wind performance. Porosity in general, may not be the most ideal strategy for wind permeability.
A-0 Horizontal Porosity
A-1 Vertical Porosity
B-0 Building Coverage Ratio & Height variation
B-1 Building Coverage Ratio & Height variation & Building geometry drag
C-0 Building Coverage Ratio & Height variation & Building geometry drag & Horizontal Porosity (C-1 + B-0)
From the simulation of design iterations, the most optimised strategy is the Iteration B-1. The iteration increases wind permeability and help construct new airpaths within the site domain.
This report aims to discover the most optimised iteration of target buildings, Mandarin Orchard & Cineleisure and secondary target building, The Heeren. The utilization of Autodesk Flow design provides a quick simulation results of the suggested design iteration. The limitation of Flow design, particularly, navigation, inability to save sessions, lack of accuracy of result set apart from the other software. Despite of the limitations, Flow design is selected an appropriate wind simulation software, as it adheres the objectives and focus of the project. The objective of the student’s methodology to selected and achieve an enhanced iteration can be seen in this report. From the list of simulated design iteration, Iteration B-1 is considered as the most ideal strategy. When compared to the original building massing, there is a significant improvement in wind conditions; specifically, wind velocity, wind permeability, formation of new airpaths. In addition, the study suggest that the strategy of building porosity may not be the most ideal as it does not encourage wind to permeated through the buildings. The airflow will be obstructed, reducing the velocity. As such, the study demonstrates that a reduction of building coverage ratio, building height variation and building geometry enhance the wind conditions.

Chao Yuan. (2018). Lecture 2_AR5959D [7]. Retrieved from https://ivle.nus.edu.sg/v1/File/Student/default.aspx?CourseID=4baa2e00-9bba-4aee-9ba7880979f557c6&WorkbinID=0367fdcd-d739-4c37-beb3-7728903c5e20&FolderID=f1f20de1-c2cd-409a-92075a121defd308
“Plane.” Autodesk Support & Learning, knowledge.autodesk.com/support/flow-design/learnexplore/caas/CloudHelp/cloudhelp/ENU/FlowDesign/files/GUID-B0FB3A1F-A472-44859D47-B40E20637B23-htm.html.