


Copyright by KW Advisors 2024 June 2024
Palo Alto area
Palo Alto Los Altos
Jump to Palo Alto Report
Redwood City
Jump to Redwood City Report
Portola Valley
Jump to Portola Valley Report
Menlo Park
Jump to Menlo Park Report
Atherton
Jump to Atherton Report
Jump to Los Altos Report
San Jose
Jump to San Jose Report
Mountain View
Jump to Mountain View Report
San Mateo County
Jump to San Mateo County Report
Santa Clara County
Jump to Santa Clara County Report
Monterey County
Jump to Monterey County Report
Santa Cruz County
Jump to Santa Cruz County Report
East Palo Alto
Jump to East Palo Alto Report
Sunnyvale
Jump to Sunnyvale Report

Santa Clara City
Jump to Santa Clara City Report
Saratoga
Jump to Saratoga Report
What’syourhome reallyworthin today’smarket?
That's the question you should be asking yourself.
Our market is incredibly diverse and rapidly changing. Values vary not just by neighborhood but by street. Your home isn't necessarily worth what your neighbors' home is. It's the current market that sets the value of your home.
So, do you know what your home is worth today's market?
Icanhelp...
Contact me for a confidential, no obligation assessment of your home's value.

WhatToExpectifYouBuyor SellaHomeThisJune
June is a busy month in the housing market because a lot of people buy and sell this time of year. So, if you’ve got a move on your mind and you’re looking to make it happen this month, here’s a snapshot of what you need to know to make sure you’re ready.
If You’re Buying This June
A lot of homebuyers with children like to move after one school year ends and before the next one begins. That’s one reason why late spring into summer is a popular time for homes to change hands. And whether that’s a motivator for you or not, it’s important to realize more buyers are going to be looking right now – and that means you’ll want to be ready for a bit more competition. But there is a silver lining to a move this time of year. This is also when more sellers will list – so you should find you have more options. As an article from Bankrate says:
“Late spring and early summer are the busiest and most competitive time of year for the real estate market. There’s usually more inventory listed for sale than other times of year . . . This is a double-edged sword for a buyer, as you will be met with more opportunities but [also] much more competition.”


Get instant pre-approval and FAST closing -plus a dedicated loan advisor -- for the ultimate mortgage journey. The Customer-Centric Mortgage
The Simplest Mortgage Approval Ever
Buying a home should be painless. Find your financing right here! Contact me, your Real Estate Expert, for support and to learn more about REMA. Get Pre-Approved Online In Minutes without affecting your credit score! Our Fast Digital Loan Process... Get pre-approved online in minutes! Your personal Finance Manager is there to help! Your Finance Manager sources a vast array of wholesale & retail lenders for your best rate. Your Finance Manager does the heavy lifting. So you get to funding quickly & easily. Get Fast Loan Pre-Approval Find A Great Rate Quickly Stop Worrying Your Personal "Easy" button A Dedicated Loan Advisor... Let our financial tools work hard for you. We gather the largest array of wholesale & retail lenders to compete for your loan! So you get the lowest rate while we do the work. Enjoy our silky smooth platform, along with passionate, live support from your dedicated Finance Manager. Mortgage expertise at every step! You work hard for your money.

PROTECT
WHAT YOU DON’T EXPECT
You can’t always see a breakdown coming, but you can plan for it with American Home Shield. Our home service plans help fix or replace covered home systems and appliances, and help you stay on budget. Protect what you don’t expect.

CLICK HERE TO WATCH THE VIDEO
Contact me, your Real Estate Expert, for support and to learn more about AHS. READY TO GET STARTED?

Looking to lighten the mood in your laundry room?
EIGHTEYECATCHING
Laundry Room Colors
To Look Out For

These refreshing colors make the wash-and-dry chore a little more pleasant.
Tranquil Blue
View it here
Sage Green
View it here
Eight Colrs fo Laundry
White
View it here
Yellow
View it here
Gray
View it here
Dusty Pink
View it here
View it here
Navy Blue Purple
View it here
Create a tranquil laundry space with Benjamin Moore's Beach Glass Its light blue shade, coupled with a subtle gray undertone, offers a clean and versatile aesthetic that avoids any baby nursery associations.
Transform your space with earthy tones like October Mist and Gloucester Sage from Benjamin Moore. Test out the trendy sage in your laundry room for a lowcommitment update easy to change and customize, ensuring lasting satisfaction with your design choice.
Create an elegant laundry room with Chantilly Lace by Benjamin Moore The classic white choice adds sophistication, opens up the space, and simplifies stain detection.
Elevate your laundry space with the energizing touch of yellow. Behr's Roasted Corn or Upbeat bring warmth and optimism, while Pearly White offers a mellow option a yellow-based white that brings a perfect harmony of vibrancy and calmness
Gray remains a top choice for laundry room walls, providing a timeless and serene backdrop A soft gray for a whisper of sophistication, easily personalized with printed patterned tile flooring or Behr's bold 2024 Color of the Year, Cracked Pepper.
Sherwin-Williams' Rosebud for a touch of romance in laundry rooms. The dusty pink hue, paired with gold accents, adds a luxurious and warm atmosphere
Navy as the key to a striking laundry room. Beyond lighter blues, navy paired with lighter accents or white fixtures, especially Benjamin Moore's Hale Navy, creates a bold choice that makes the laundry room stand out.
Dare to take a style risk in your laundry room with a pop of color Opt for the subtle smoky lavender of Farrow & Ball's Peignoir for a neutral touch or go all-out glam with Backdrop's dark and vampy McQueen, drawing inspiration from the famous fashion designer.
Source : https://www familyhandyman com/list/laundry-room-colors/
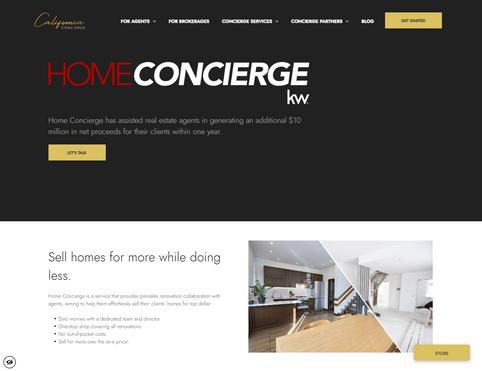
Want to know how Home Concierge can help with your listing? Contact me today!
WITH UNLOCKING YOUR PROPERTY’S POTENTIAL

Thinking about boosting your property value and adapting to changing family needs? An Accessory Dwelling Unit (ADU) might be your answer. A recent success story, from the Willow Glen neighborhood in San Jose, shows just how impactful the right ADU can be

Project Overview
In early 2021, a homeowner in Willow Glen partnered with Acton ADU to enhance their property value and create a flexible living space for their parents. Initially, the home was appraised at $1,450,000. The goal was to boost property value and meet their family’s housing needs.
Construction and Results
Construction of the 748-square-foot ADU began in August 2021 with a cost of $487,130 and was completed by December 2021. The new appraisal, by an appraiser affiliated with US Bank, revealed the property’s value had already jumped to an impressive $2,050,000.
Potential for Gains
After the project, the total investment was $1,937,130 and their property value increased by $112,870, resulting in a 5.8% ROI. This highlights the potential value an ADU can bring, while providing close, safe living space for their elderly parents.
Learn More and Connect with an Expert
Curious about how an ADU could enhance your property? Contact your real estate agent today and get expert guidance on understanding the benefits an ADU may bring to your family and property’s value
Reach out today
LEARN MORE

VENDOR DIRECTORY
When it comes to home ownership, knowing who you can trust is crucial. That's why we've curated a select list of trusted vendors who are ready to help with your home goals.


CLICK HERE CLICK HERE
for your mortgage needs for your home warranty needs


HERE for your home renovation needs for your insurance needs for
CLICK
CLICK HERE CLICK
your all-in-one solution to ADUs (Accessory Dwelling Units)
HERE
PaloAlto
What's in the Palo Alto data?
There were 45 single-family homes for sale, providing 0.9 months of inventory. There were 56 new listings, and 54 homes sold at a median price of $3.6m. The median overbid percentage was at 103%, with an average of 12 days on the market.
There were 9 condo and townhome units for sale, providing 0.9 months of inventory. There were 7 new listings and 11 units sold at a median sale price of $1.4m. The median overbid percentage was at 100%, with an average of 20 days on the market.

Single-Family Homes
56 New Listings
54 Sold Listings
0.9 Months of Inventory
$3.6M Median Sale Price
103% Median Sale vs List
12 Avg Days on Market
The data, sourced from InfoSparks and Trend Graphix, includes all single-family homes, condos and townhomes in the California Area above from May 2023 to May 2024. This may include preliminary data, and may vary from the time the data was gathered. All data is deemed reliable but not guaranteed. DRE# 01511642. Copyright KW Advisors Palo Alto 2024. Each office is independently owned and operated.
SFH
Condo & Townhomes
7
New Listings
11
Sold Listings
0.9
Months of Inventory
$1.4M
Median Sale Price 100%
Median Sale vs List 20 Avg Days on Market

CONDO
Single-Family Homes
Last 12 months, year-over-year.
Condos & Townhomes
Last 12 months, year-over-year
PaloAlto MAY 2023 - MAY 2024
May2023 Jun2023 Jul2023 Aug2023 Sep2023 Oct2023 Nov2023 Dec2023 Jan2024 Feb2024 Mar2024 Apr2024 May2024 0 10 20 30 40 50 60 May2023 Jun2023 Jul2023 Aug2023 Sep2023 Oct2023 Nov2023 Dec2023 Jan2024 Feb2024 Mar2024 Apr2024 May2024 0 5 10 15 20 LISTINGS FOR SALE SOLD LISTINGS
Median SalesPrice
Single-Family Homes
The median sale price has decreased from $3 65m last May 2023, to $3 6m as of May 2024
Condos & Townhomes
The median sale price has decreased from $1 8m last May 2023, to $1 4m as of May 2024
AVGDays OntheMarket
Single-Family Homes
The average time spent on the market went down from 25 days last May 2023, to 12 days as of May 2024
Condos & Townhomes
The average time spent on the market went down from 25 days in May 2023, to 20 days as of May 2024.
Overbids
Single-Family Homes
The overbid percentage has increased from 98% last May 2023, to 103% a year later
Condos & Townhomes
The overbid percentage has decreased from 103% last May 2023, to 100% a year later.
Back to Table of Contents May2023 Jun2023 Jul2023Aug2023Sep2023Oct2023Nov2023Dec2023 Jan2024Feb2024Mar2024Apr2024May2024 $0 $1,000,000 $2,000,000 $3,000,000 $4,000,000 May2023 Jun2023 Jul2023Aug2023Sep2023 Oct2023Nov2023Dec2023 Jan2024 Feb2024Mar2024 Apr2024May2024 0 20 40 60 80 100 May2023 Jun2023 Jul2023Aug2023Sep2023 Oct2023Nov2023Dec2023 Jan2024 Feb2024Mar2024Apr2024May2024 000% 2000% 4000% 6000% 8000% 10000% 12000%

Redwood City
What's in the Redwood City data?
There were 39 single-family homes for sale, providing 1.1 months of inventory. There were 55 new listings, and 37 homes sold at a median price of $2.3m. The median overbid percentage was at 105%, with an average of 18 days on the market
There were 21 condo and townhome units for sale, providing 2.7 months of inventory. There were 17 new listings and 14 units sold at a median sale price of $1.2m. The median overbid percentage was at 98%, with an average of 33 days on the market.

Single-Family Homes
55 New Listings
37 Sold Listings
1.1 Months of Inventory
$2.3M Median Sale Price
105% Median Sale vs List
18 Avg Days on Market
The data, sourced from InfoSparks and Trend Graphix, includes all single-family homes, condos and townhomes in the California Area above from May 2023 to May 2024. This may include preliminary data, and may vary from the time the data was gathered. All data is deemed reliable but not guaranteed. DRE# 01511642. Copyright KW Advisors Palo Alto 2024. Each office is independently owned and operated.
SFH
17
New Listings
14
Sold Listings
2.7
Months of Inventory
$1.2M
Median Sale Price 98%
Median Sale vs List
33
Avg Days on Market

CONDO
Condo & Townhomes
MAY
Single-Family Homes Last 12 months, year-over-year.
& Townhomes
12 months, year-over-year May2023 Jun2023 Jul2023 Aug2023 Sep2023 Oct2023 Nov2023 Dec2023 Jan2024 Feb2024 Mar2024 Apr2024 May2024 0 10 20 30 40 50 60 May2023 Jun2023 Jul2023 Aug2023 Sep2023 Oct2023 Nov2023 Dec2023 Jan2024 Feb2024 Mar2024 Apr2024 May2024 0 5 10 15 20 25 LISTINGS FOR SALE SOLD LISTINGS
RedwoodCity MAY 2023 -
2024
Condos
Last
Median SalesPrice
Single-Family Homes
The median sale price has increased from $2 1m last May 2023, to $2 3m as of May 2024
Condos & Townhomes
The median sale price has decreased from $1 3m last May 2023, to $1 2m as of May 2024
AVGDays OntheMarket
Single-Family Homes
The average time spent on the market went up from 15 days last May 2023, to 18 days as of May 2024
Condos & Townhomes
The average time spent on the market went up from 21 days in May 2023, to 33 days as of May 2024.
Overbids
Single-Family Homes
The overbid percentage has increased from 104% last May 2023, to 105% a year later
Condos & Townhomes
The overbid percentage has decreased from 107% last May 2023, to 98% a year later.
Back to Table of Contents May2023 Jun2023 Jul2023Aug2023Sep2023Oct2023Nov2023Dec2023 Jan2024Feb2024Mar2024Apr2024May2024 $0 $500,000 $1,000,000 $1,500,000 $2,000,000 $2,500,000 May2023 Jun2023 Jul2023Aug2023Sep2023 Oct2023Nov2023Dec2023 Jan2024 Feb2024Mar2024 Apr2024May2024 0 10 20 30 40 50 60 May2023 Jun2023 Jul2023Aug2023Sep2023 Oct2023Nov2023Dec2023 Jan2024 Feb2024Mar2024Apr2024May2024 000% 2000% 4000% 6000% 8000% 10000% 12000%

Portola Valley
What's in the Portola Valley data?
There were 14 single-family homes for sale, providing 2.3 months of inventory. There were 8 new listings, and 6 homes sold at a median price of $3.4m. The median overbid percentage was at 96%, with an average of 14 days on the market
There was no data for condo and townhouse units for this month.

Single-Family Homes
8 New Listings
6 Sold Listings
2.3 Months of Inventory
$3.4M Median Sale Price
96% Median Sale vs List
14 Avg Days on Market
The data, sourced from InfoSparks and Trend Graphix, includes all single-family homes, condos and townhomes in the California Area above from May 2023 to May 2024. This may include preliminary data, and may vary from the time the data was gathered. All data is deemed reliable but not guaranteed. DRE# 01511642. Copyright KW Advisors Palo Alto 2024. Each office is independently owned and operated.
SFH
No data for this month.

C
lley , y y ec2023 Jan2024 Feb2024 Mar2024 Apr2024 May2024 displa� OLD LISTINGS
Median SalesPrice
Single-Family Homes
The median sale price has decreased from $3 5m last May 2023, to $3 4m as of May 2024
Condos & Townhomes
No data for this month
AVGDays OntheMarket
Single-Family Homes
The average time spent on the market went up from 13 days last May 2023, to 14 days as of May 2024
Condos & Townhomes
No data for this month
Overbids
Single-Family Homes
The overbid percentage has decreased from 101% last May 2023, to 96% a year later
Condos & Townhomes
No data for this month
Back to Table of Contents May2023 Jun2023 Jul2023Aug2023Sep2023Oct2023Nov2023Dec2023 Jan2024Feb2024Mar2024Apr2024May2024 $0 $2,000,000 $4,000,000 $6,000,000 $8,000,000 May2023 Jun2023 Jul2023Aug2023Sep2023 Oct2023Nov2023Dec2023 Jan2024 Feb2024Mar2024 Apr2024May2024 0 10 20 30 40 50 60 70 May2023 Jun2023 Jul2023Aug2023Sep2023 Oct2023Nov2023Dec2023 Jan2024 Feb2024Mar2024Apr2024May2024 000% 2000% 4000% 6000% 8000% 10000% 12000%

MenloPark
What's in the Menlo Park data?
There were 32 single-family homes for sale, providing 1 month of inventory. There were 34 new listings, and 40 homes sold at a median pric of $3.3m. The median overbid percentage was at 96%, with an average of 20 days on the market.
There were 11 condo and townhome units for sale, providing 1.4 months of inventory. There were 10 new listings and 8 units sold at a median sale price of $1.6m. The median overbid percentage was at 100%, with an average of 27 days on the market.

34 New Listings
40 Sold Listings
1 Month of Inventory
$3.3M Median Sale Price
96%
Median Sale vs List
20 Avg Days on Market
New Listings
1.4
Months of Inventory
Sold Listings
$1.6M
Median Sale Price 100%
Median Sale vs List 27 Avg Days on Market 8

C
10
k , y y ec2023 Jan2024 Feb2024 Mar2024 Apr2024 May2024 ec2023 Jan2024 Feb2024 Mar2024 Apr2024 May2024 OLD LISTINGS
Median SalesPrice
Single-Family Homes
The median sale price has decreased from $3 4m last May 2023, to $3 3m as of May 2024
Condos & Townhomes
The median sale price has decreased from $2 1m last May 2023, to $1 6m as of May 2024
AVGDays OntheMarket
Single-Family Homes
The average time spent on the market went down from 24 days last May 2023, to 20 days as of May 2024
Condos & Townhomes
The average time spent on the market went up from 19 days in May 2023, to 27 days as of May 2024.
Overbids
Single-Family Homes
The overbid percentage has decreased from 102% last May 2023, to 96% a year later
Condos & Townhomes
The overbid percentage has decreased from 101% last May 2023, to 100% a year later.
Back to Table of Contents May2023 Jun2023 Jul2023Aug2023Sep2023Oct2023Nov2023Dec2023 Jan2024Feb2024Mar2024Apr2024May2024 $0 $1,000,000 $2,000,000 $3,000,000 $4,000,000 May2023 Jun2023 Jul2023Aug2023Sep2023 Oct2023Nov2023Dec2023 Jan2024 Feb2024Mar2024 Apr2024May2024 0 10 20 30 40 50 60 70 May2023 Jun2023 Jul2023Aug2023Sep2023 Oct2023Nov2023Dec2023 Jan2024 Feb2024Mar2024Apr2024May2024 000% 2000% 4000% 6000% 8000% 10000% 12000%

Atherton
What's in the Atherton data?
There were 24 single-family homes for sale, providing 1.8 months of inventory. There were 6 new listings, and 9 homes sold at a median price of $7.6m. The median overbid percentage was at 99%, with an average of 16 days on the market.
There was no data for condo and townhouse units for this month.

Single-Family Homes
6 New Listings
9 Sold Listings
1.8 Months of Inventory
$7.6M Median Sale Price
99% Median Sale vs List
16 Avg Days on Market
The data, sourced from InfoSparks and Trend Graphix, includes all single-family homes, condos and townhomes in the California Area above from May 2023 to May 2024. This may include preliminary data, and may vary from the time the data was gathered. All data is deemed reliable but not guaranteed. DRE# 01511642. Copyright KW Advisors Palo Alto 2024. Each office is independently owned and operated.
SFH
New Listings
1 Sold Listing
0
Months of Inventory
$1.3M
Median Sale Price 104%
Median Sale vs List 11 Avg Days on Market

CONDO
Condo & Townhomes 0
Single-Family Homes
Last 12 months, year-over-year.
Condos & Townhomes
Last 12 months, year-over-year
Atherton MAY 2023 - MAY 2024
May2023 Jun2023 Jul2023 Aug2023 Sep2023 Oct2023 Nov2023 Dec2023 Jan2024 Feb2024 Mar2024 Apr2024 May2024 0 5 10 15 20 25 30 35 LISTINGS FOR SALE SOLD LISTINGS May2023 Jun2023 Jul2023 Aug2023 Sep2023 Oct2023 Nov2023 Dec2023 Jan2024 Feb2024 Mar2024 Apr2024 May2024 00 02 04 06 08 10
Median SalesPrice
Single-Family Homes
The median sale price has increased from $5 4m last May 2023, to $7 6m as of May 2024
Condos & Townhomes
The median sale price has increased from $0 last May 2023, to $1 3m as of May 2024
AVGDays OntheMarket
Single-Family Homes
The average time spent on the market went down from 33 days last May 2023, to 16 days as of May 2024
Condos & Townhomes
The average time spent on the market went up from 0 days in May 2023, to 11 days as of May 2024.
Overbids
Single-Family Homes
The overbid percentage has increased from 96% last May 2023, to 99% a year later
Condos & Townhomes
The overbid percentage has increased from 0% last May 2023, to 104% a year later.
Back to Table of Contents May2023 Jun2023 Jul2023Aug2023Sep2023Oct2023Nov2023Dec2023 Jan2024Feb2024Mar2024Apr2024May2024 $0 $5,000,000 $10,000,000 $15,000,000 $20,000,000 May2023 Jun2023 Jul2023Aug2023Sep2023 Oct2023Nov2023Dec2023 Jan2024 Feb2024Mar2024 Apr2024May2024 0 50 100 150 200 May2023 Jun2023 Jul2023Aug2023Sep2023 Oct2023Nov2023Dec2023 Jan2024 Feb2024Mar2024Apr2024May2024 000% 2000% 4000% 6000% 8000% 10000% 12000%

Lo
What's
There we providing new listin of $4.4m 104%, wit
There we sale, prov 10 new li price of $ was at 10 market.

40 New Listings
31 Sold Listings
1.1 Months of Inventory
$4.4M Median Sale Price
104% Median Sale vs List
12 Avg Days on Market
single-family homes, May 2024. This gathered. All data Advisors Palo Alto
New Listings
2
Months of Inventory
Sold Listings
$2.2M
Median Sale Price 100%
Median Sale vs List
17 Avg Days on Market 12

CONDO
Condo & Townhomes 10
LosAltos
MAY
MAY 2024 Single-Family Homes
12 months, year-over-year.
& Townhomes
12 months, year-over-year May2023 Jun2023 Jul2023 Aug2023 Sep2023 Oct2023 Nov2023 Dec2023 Jan2024 Feb2024 Mar2024 Apr2024 May2024 0 5 10 15 20 25 30 35 May2023 Jun2023 Jul2023 Aug2023 Sep2023 Oct2023 Nov2023 Dec2023 Jan2024 Feb2024 Mar2024 Apr2024 May2024 0 5 10 15 20 25 LISTINGS FOR SALE SOLD LISTINGS
2023 -
Last
Condos
Last
Median SalesPrice
Single-Family Homes
The median sale price has increased from $4m last May 2023, to $4 4m as of May 2024
Condos & Townhomes
The median sale price has increased from $1 3m last May 2023, to $2 2m as of May 2024
AVGDays OntheMarket
Single-Family Homes
The average time spent on the market went up from 10 days last May 2023, to 12 days as of May 2024
Condos & Townhomes
The average time spent on the market went up from 10 days in May 2023, to 17 days as of May 2024.
Overbids
Single-Family Homes
The overbid percentage has increased from 101% last May 2023, to 104% a year later
Condos & Townhomes
The overbid percentage has decreased from 104% last May 2023, to 100% a year later.
Back to Table of Contents May2023 Jun2023 Jul2023Aug2023Sep2023Oct2023Nov2023Dec2023 Jan2024Feb2024Mar2024Apr2024May2024 $0 $1,000,000 $2,000,000 $3,000,000 $4,000,000 $5,000,000 May2023 Jun2023 Jul2023Aug2023Sep2023 Oct2023Nov2023Dec2023 Jan2024 Feb2024Mar2024 Apr2024May2024 0 20 40 60 80 100 May2023 Jun2023 Jul2023Aug2023Sep2023 Oct2023Nov2023Dec2023 Jan2024 Feb2024Mar2024Apr2024May2024 000% 2000% 4000% 6000% 8000% 10000% 12000%

SanJo
What's in the
There were 330 single providing 0.8 months new listings, and 418 price of $1.7m. The m was at 109% with an a market.
There were 205 condo sale, providing 1 3 mo were 239 new listings median sale price of $ percentage was at 10 days on the market.

545 New Listings
418 Sold Listings
0.8 Months of Inventory
$1.7M Median Sale Price
109%
Median Sale vs List
11 Avg Days on Market
Graphix, includes all single-family homes, from May 2023 to May 2024. This time the data was gathered. All data 511642. Copyright KW Advisors Palo Alto 2024. Each office is independently owned and operated.
s
Condo & Tow
239
New Listings
176
Sold Listings
1.3
Months of Inventory $943K
Median Sale Price 105%
Median Sale vs List 15 Avg Days on Market

CON
y y
May2024 pr2024 May2024
r2024
Median SalesPrice
Single-Family Homes
The median sale price has increased from $1 5m last May 2023, to $1 7m as of May 2024
Condos & Townhomes
The median sale price has increased from $840k last May 2023, to $943k as of May 2024
AVGDays OntheMarket
Single-Family Homes
The average time spent on the market went down from 19 days last May 2023, to 11 days as of May 2024
Condos & Townhomes
The average time spent on the market went down from 17 days in May 2023, to 15 days as of May 2024.
Overbids
Single-Family Homes
The overbid percentage has increased from 104% last May 2023, to 109% a year later
Condos & Townhomes
The overbid percentage has increased from 103% last May 2023, to 105% a year later.
Back to Table of Contents May2023 Jun2023 Jul2023Aug2023Sep2023Oct2023Nov2023Dec2023 Jan2024Feb2024Mar2024Apr2024May2024 $0 $500,000 $1,000,000 $1,500,000 $2,000,000 May2023 Jun2023 Jul2023Aug2023Sep2023 Oct2023Nov2023Dec2023 Jan2024 Feb2024Mar2024 Apr2024May2024 0 10 20 30 40 May2023 Jun2023 Jul2023Aug2023Sep2023 Oct2023Nov2023Dec2023 Jan2024 Feb2024Mar2024Apr2024May2024 000% 2000% 4000% 6000% 8000% 10000% 12000%

Moun View
What's in the data?
There were 18 singleproviding 0.6 months new listings, and 33 h of $2.7m. The median 108% with an average
There were 31 condo sale, providing 0.9 mo were 37 new listings a sale price of $1.2m. T percentage was at 10 days on the market.
28 New Listings
33 Sold Listings
0.6 Months of Inventory
$2.7M Median Sale Price
108% Median Sale vs List
16 Avg Days on Market
Graphix, includes all single-family homes, from May 2023 to May 2024. This time the data was gathered. All data 511642. Copyright KW Advisors Palo Alto 2024. Each office is independently owned and operated.
s
37
New Listings
36 Sold Listings
0.9
Months of Inventory
$1.2M
Median Sale Price 107%
Median Sale vs List 10 Avg Days on Market

CONDO
Condo & Townhomes
Single-Family Homes
Last 12 months, year-over-year.
Condos & Townhomes
Last 12 months, year-over-year
MountainView MAY 2023 - MAY 2024
May2023 Jun2023 Jul2023 Aug2023 Sep2023 Oct2023 Nov2023 Dec2023 Jan2024 Feb2024 Mar2024 Apr2024 May2024 0 5 10 15 20 25 30 35 May2023 Jun2023 Jul2023 Aug2023 Sep2023 Oct2023 Nov2023 Dec2023 Jan2024 Feb2024 Mar2024 Apr2024 May2024 0 10 20 30 40 LISTINGS FOR SALE SOLD LISTINGS
Median SalesPrice
Single-Family Homes
The median sale price has increased from $2 5m last May 2023, to $2 7m as of May 2024
Condos & Townhomes
The median sale price has increased from $1m last May 2023, to $1 2m as of May 2024
AVGDays OntheMarket
Single-Family Homes
The average time spent on the market went up from 11 days last May 2023, to 16 days as of May 2024
Condos & Townhomes
The average time spent on the market went down from 28 days in May 2023, to 10 days as of May 2024.
Overbids
Single-Family Homes
The overbid percentage has increased from 107% last May 2023, to 108% a year later
Condos & Townhomes
The overbid percentage has increased from 104% last May 2023, to 107% a year later.
Back to Table of Contents May2023 Jun2023 Jul2023Aug2023Sep2023Oct2023Nov2023Dec2023 Jan2024Feb2024Mar2024Apr2024May2024 $0 $500,000 $1,000,000 $1,500,000 $2,000,000 $2,500,000 $3,000,000 May2023 Jun2023 Jul2023Aug2023Sep2023 Oct2023Nov2023Dec2023 Jan2024 Feb2024Mar2024 Apr2024May2024 0 5 10 15 20 25 30 May2023 Jun2023 Jul2023Aug2023Sep2023 Oct2023Nov2023Dec2023 Jan2024 Feb2024Mar2024Apr2024May2024 000% 2000% 4000% 6000% 8000% 10000% 12000%

SanM Coun
What's in the data?
There were 463 single providing 1.6 months new listings, and 368 price of $2.3m. The m was at 106 2%, with a market.
There were 224 condo sale, providing 2.5 mo were 173 new listings median sale price of $ percentage was at 10 days on the market

529 New Listings
368 Sold Listings
1.6 Months of Inventory
$2.3M Median Sale Price
106.2% Median Sale vs List
16 Avg Days on Market
Graphix, includes all single-family homes, from May 2023 to May 2024. This time the data was gathered. All data 511642. Copyright KW Advisors Palo Alto 2024. Each office is independently owned and operated.
s
173
New Listings
117
Sold Listings
2.5
Months of Inventory
100.5%
Median Sale vs List
$925K
Median Sale Price
26
Avg Days on Market

CONDO
Condo & Townhomes
SanMateo
MAY 2023 - MAY 2024
Single-Family Homes
Last 12 months, year-over-year.
Condos & Townhomes
Last 12 months, year-over-year
May2023 Jun2023 Jul2023 Aug2023 Sep2023 Oct2023 Nov2023 Dec2023 Jan2024 Feb2024 Mar2024 Apr2024 May2024 0 100 200 300 400 500 600 May2023 Jun2023 Jul2023 Aug2023 Sep2023 Oct2023 Nov2023 Dec2023 Jan2024 Feb2024 Mar2024 Apr2024 May2024 0 50 100 150 200 250 LISTINGS FOR SALE SOLD LISTINGS
Median SalesPrice
Single-Family Homes
The median sale price has increased from $1 8m last May 2023, to $2 3m as of May 2024
Condos & Townhomes
The median sale price has increased from $915k last May 2023, to $925k as of May 2024
AVGDays OntheMarket
Single-Family Homes
The average time spent on the market went down from 20 days last May 2023, to 16 days as of May 2024
Condos & Townhomes
The average time spent on the market remained the same from 26 days in May 2023, to 26 days as of May 2024.
Overbids
Single-Family Homes
The overbid percentage has increased from 102 1% last May 2023, to 106 2% a year later
Condos & Townhomes
The overbid percentage has increased from 100.1% last May 2023, to 100.5% a year later.
Back to Table of Contents May2023 Jun2023 Jul2023Aug2023Sep2023Oct2023Nov2023Dec2023 Jan2024Feb2024Mar2024Apr2024May2024 $0 $500,000 $1,000,000 $1,500,000 $2,000,000 $2,500,000 May2023 Jun2023 Jul2023Aug2023Sep2023 Oct2023Nov2023Dec2023 Jan2024 Feb2024Mar2024 Apr2024May2024 0 10 20 30 40 50 60 70 May2023 Jun2023 Jul2023Aug2023Sep2023 Oct2023Nov2023Dec2023 Jan2024 Feb2024Mar2024Apr2024May2024 000% 2000% 4000% 6000% 8000% 10000% 12000%

SantaClara County
What's in the Santa Clara County data?
There were 861 single-family homes for sale, providing 1.3 months of inventory. There were 1,206 new listings, and 899 homes sold at a median price of $2.1m. The median overbid percentage was at 107 9%, with an average of 14 days on the market.
There were 507 condo and townhome units for sale, providing 1.8 months of inventory. There were 571 new listings and 397 units sold at a median sale price of $1m. The median overbid percentage was at 103%, with an average of 15 days on the market

Single-Family Homes
1,206 New Listings
899 Sold Listings
1.3 Months of Inventory
$2.1M
Median Sale Price
107.9%
Median Sale vs List
14 Avg Days on Market
The data, sourced from InfoSparks and Trend Graphix, includes all single-family homes, condos and townhomes in the California Area above from May 2023 to May 2024. This may include preliminary data, and may vary from the time the data was gathered. All data is deemed reliable but not guaranteed. DRE# 01511642. Copyright KW Advisors Palo Alto 2024. Each office is independently owned and operated.
SFH
571
New Listings
397
Sold Listings
1.8
Months of Inventory
$1M
Median Sale Price 103%
Median Sale vs List 15 Avg Days on Market

CONDO
Condo & Townhomes
SantaClaraCounty
MAY 2023 - MAY 2024
Single-Family Homes
Last 12 months, year-over-year.
Condos & Townhomes
Last 12 months, year-over-year
May2023 Jun2023 Jul2023 Aug2023 Sep2023 Oct2023 Nov2023 Dec2023 Jan2024 Feb2024 Mar2024 Apr2024 May2024 0 200 400 600 800 1000 May2023 Jun2023 Jul2023 Aug2023 Sep2023 Oct2023 Nov2023 Dec2023 Jan2024 Feb2024 Mar2024 Apr2024 May2024 0 100 200 300 400 500 600 LISTINGS FOR SALE SOLD LISTINGS
Median SalesPrice
Single-Family Homes
The median sale price has increased from $1 7m last May 2023, to $2 1m as of May 2024
Condos & Townhomes
The median sale price has increased from $955k last May 2023, to $1m as of May 2024
AVGDays OntheMarket
Single-Family Homes
The average time spent on the market went down from 18 days last May 2023, to 14 days as of May 2024
Condos & Townhomes
The average time spent on the market went down from 21 days in May 2023, to 15 days as of May 2024.
Overbids
Single-Family Homes
The overbid percentage has increased from 103 6% last May 2023, to 107 9% a year later
Condos & Townhomes
The overbid percentage has increased from 101.4% last May 2023, to 103% a year later.
Back to Table of Contents May2023 Jun2023 Jul2023Aug2023Sep2023Oct2023Nov2023Dec2023 Jan2024Feb2024Mar2024Apr2024May2024 $0 $500,000 $1,000,000 $1,500,000 $2,000,000 $2,500,000 May2023 Jun2023 Jul2023Aug2023Sep2023 Oct2023Nov2023Dec2023 Jan2024 Feb2024Mar2024 Apr2024May2024 0 10 20 30 40 May2023 Jun2023 Jul2023Aug2023Sep2023 Oct2023Nov2023Dec2023 Jan2024 Feb2024Mar2024Apr2024May2024 000% 2000% 4000% 6000% 8000% 10000% 12000%

Monterey County
What's in the Monterey County data?
There were 349 single-family homes for sale, providing 2.2 months of inventory. There were 223 new listings, and 168 homes sold at a median price of $1m. The median overbid percentage was at 94%, with an average of 33 days on the market
There were 53 condo and townhome units for sale, providing 1.9 months of inventory. There were 34 new listings and 30 units sold at a median sale price of $670k. The median overbid percentage was at 98%, with an average of 48 days on the market.

Single-Family Homes
223 New Listings
168 Sold Listings
2.2 Months of Inventory
$1M Median Sale Price
94%
Median Sale vs List
33 Avg Days on Market
The data, sourced from InfoSparks and Trend Graphix, includes all single-family homes, condos and townhomes in the California Area above from May 2023 to May 2024. This may include preliminary data, and may vary from the time the data was gathered. All data is deemed reliable but not guaranteed. DRE# 01511642. Copyright KW Advisors Palo Alto 2024. Each office is independently owned and operated.
SFH
34
New Listings
30 Sold Listings
1.9
Months of Inventory
$670K
Median Sale Price 98%
Median Sale vs List
48 Avg Days on Market

CONDO
Condo & Townhomes
Homes
12 months, year-over-year.
MontereyCounty MAY 2023 - MAY 2024 Single-Family
Last
Condos & Townhomes
May2023 Jun2023 Jul2023 Aug2023 Sep2023 Oct2023 Nov2023 Dec2023 Jan2024 Feb2024 Mar2024 Apr2024 May2024 0 50 100 150 200 250 300 350 May2023 Jun2023 Jul2023 Aug2023 Sep2023 Oct2023 Nov2023 Dec2023 Jan2024 Feb2024 Mar2024 Apr2024 May2024 0 10 20 30 40 50 60 LISTINGS FOR SALE SOLD LISTINGS
Last 12 months, year-over-year
Median SalesPrice
Single-Family Homes
The median sale price has increased from $877k last May 2023, to $1m as of May 2024
Condos & Townhomes
The median sale price has increased from $620k last May 2023, to $670k as of May 2024
AVGDays OntheMarket
Single-Family Homes
The average time spent on the market went down from 37 days last May 2023, to 33 days as of May 2024
Condos & Townhomes
The average time spent on the market went up from 32 days in May 2023, to 48 days as of May 2024.
Overbids
Single-Family Homes
The overbid percentage has remained the same from 94% last May 2023, to 94% a year later
Condos & Townhomes
The overbid percentage has increased from 91% last May 2023, to 98% a year later.
Back to Table of Contents May2023 Jun2023 Jul2023Aug2023Sep2023Oct2023Nov2023Dec2023 Jan2024Feb2024Mar2024Apr2024May2024 $0 $200,000 $400,000 $600,000 $800,000 $1,000,000 $1,200,000 May2023 Jun2023 Jul2023Aug2023Sep2023 Oct2023Nov2023Dec2023 Jan2024 Feb2024Mar2024 Apr2024May2024 0 10 20 30 40 50 60 May2023 Jun2023 Jul2023Aug2023Sep2023 Oct2023Nov2023Dec2023 Jan2024 Feb2024Mar2024Apr2024May2024 000% 2000% 4000% 6000% 8000% 10000%

SantaCruz County
What's in the Santa Cruz County data?
There were 282 single-family homes for sale, providing 2.5 months of inventory. There were 216 new listings, and 109 homes sold at a median price of $1.3m. The median overbid percentage was at 99%, with an average of 29 days on the market
There were 67 condo and townhome units for sale, providing 2.4 months of inventory. There were 39 new listings and 38 units sold at a median sale price of $730k. The median overbid percentage was at 99%, with an average of 27 days on the market.

Single-Family Homes
216 New Listings
109 Sold Listings
2.5 Months of Inventory
$1.3M Median Sale Price
99% Median Sale vs List
29 Avg Days on Market
The data, sourced from InfoSparks and Trend Graphix, includes all single-family homes, condos and townhomes in the California Area above from May 2023 to May 2024. This may include preliminary data, and may vary from the time the data was gathered. All data is deemed reliable but not guaranteed. DRE# 01511642. Copyright KW Advisors Palo Alto 2024. Each office is independently owned and operated.
SFH
39
New Listings
38 Sold Listings
2.4
Months of Inventory
$730K
Median Sale Price 99%
Median Sale vs List 27 Avg Days on Market

CONDO
Condo & Townhomes
SantaCruzCounty
Homes
12 months, year-over-year.
May2023 Jun2023 Jul2023 Aug2023 Sep2023 Oct2023 Nov2023 Dec2023 Jan2024 Feb2024 Mar2024 Apr2024 May2024 0 50 100 150 200 250 300 May2023 Jun2023 Jul2023 Aug2023 Sep2023 Oct2023 Nov2023 Dec2023 Jan2024 Feb2024 Mar2024 Apr2024 May2024 0 10 20 30 40 50 60 70 LISTINGS FOR SALE SOLD LISTINGS
MAY 2023 - MAY 2024 Single-Family
Last
Condos & Townhomes Last 12 months, year-over-year
Median SalesPrice
Single-Family Homes
The median sale price has increased from $1 35m last May 2023, to $1 36m as of May 2024
Condos & Townhomes
The median sale price has decreased from $744k last May 2023, to $730k as of May 2024
AVGDays OntheMarket
Single-Family Homes
The average time spent on the market went down from 34 days last May 2023, to 29 days as of May 2024
Condos & Townhomes
The average time spent on the market went down from 44 days in May 2023, to 27 days as of May 2024.
Overbids
Single-Family Homes
The overbid percentage has increased from 97% last May 2023, to 99% a year later
Condos & Townhomes
The overbid percentage has remained the same from 99% last May 2023, to 99% a year later.
Back to Table of Contents May2023 Jun2023 Jul2023Aug2023Sep2023Oct2023Nov2023Dec2023 Jan2024Feb2024Mar2024Apr2024May2024 $0 $500,000 $1,000,000 $1,500,000 $2,000,000 May2023 Jun2023 Jul2023Aug2023Sep2023 Oct2023Nov2023Dec2023 Jan2024 Feb2024Mar2024 Apr2024May2024 0 10 20 30 40 50 60 70 May2023 Jun2023 Jul2023Aug2023Sep2023 Oct2023Nov2023Dec2023 Jan2024 Feb2024Mar2024Apr2024May2024 000% 2000% 4000% 6000% 8000% 10000% 12000%

gle-Family Homes
13 New Listings
9 Sold Listings
1.3 Months of Inventory
$925K
Median Sale Price
104%
Median Sale vs List
28 Avg Days on Market
data, sourced from InfoSparks and Trend Graphix, includes all single-family homes, and townhomes in the California Area above from May 2023 to May 2024. This include preliminary data, and may vary from the time the data was gathered. All data eemed reliable but not guaranteed. DRE# 01511642. Copyright KW Advisors Palo Alto 2024. Each office is independently owned and operated.
FH
New Listings
1 Sold Listing
2 Months of Inventory
$635K Median Sale Price 94%
Median Sale vs List 30 Avg Days on Market
C
0
Alto , y y ec2023 Jan2024 Feb2024 Mar2024 Apr2024 May2024 ec2023 Jan2024 Feb2024 Mar2024 Apr2024 May2024 OLD LISTINGS
Median SalesPrice
Single-Family Homes
The median sale price has increased from $880k last May 2023, to $925k as of May 2024
Condos & Townhomes
The median sale price has increased from $0 last May 2023, to $635k as of May 2024
AVGDays OntheMarket
Single-Family Homes
The average time spent on the market went up from 14 days last May 2023, to 28 days as of May 2024
Condos & Townhomes
The average time spent on the market went up from 0 days in May 2023, to 30 days as of May 2024.
Overbids
Single-Family Homes
The overbid percentage has decreased from 105% last May 2023, to 104% a year later
Condos & Townhomes
The overbid percentage has increased from 0% last May 2023, to 94% a year later.
Back to Table of Contents May2023 Jun2023 Jul2023Aug2023Sep2023Oct2023Nov2023Dec2023 Jan2024Feb2024Mar2024Apr2024May2024 $0 $500,000 $1,000,000 $1,500,000 $2,000,000 May2023 Jun2023 Jul2023Aug2023Sep2023 Oct2023Nov2023Dec2023 Jan2024 Feb2024Mar2024 Apr2024May2024 0 50 100 150 200 250 300 May2023 Jun2023 Jul2023Aug2023Sep2023 Oct2023Nov2023Dec2023 Jan2024 Feb2024Mar2024Apr2024May2024 000% 2000% 4000% 6000% 8000% 10000% 12000%

Sunn
What's in the
There were 34 single providing 0.6 months new listings, and 57 h of $2.6m. The media 114% with an averag
There were 37 condo sale, providing 1.1 m were 51 new listings sale price of $1.2m. T percentage was at 10 days on the market.

63 New Listings
57 Sold Listings
0.6 Months of Inventory
$2.6M Median Sale Price
114% Median Sale vs List
7 Avg Days on Market
Graphix, includes all single-family homes, from May 2023 to May 2024. This time the data was gathered. All data 511642. Copyright KW Advisors Palo Alto
s
Condo & Townhomes
51
New Listings
28 Sold Listings
1.1
Months of Inventory
$1.2M
Median Sale Price 107%
Median Sale vs List 12 Avg Days on Market

CONDO
Sunnyvale
MAY 2023 - MAY 2024
Single-Family Homes
Last 12 months, year-over-year.
Condos & Townhomes
Last 12 months, year-over-year
May2023 Jun2023 Jul2023 Aug2023 Sep2023 Oct2023 Nov2023 Dec2023 Jan2024 Feb2024 Mar2024 Apr2024 May2024 0 10 20 30 40 50 60 May2023 Jun2023 Jul2023 Aug2023 Sep2023 Oct2023 Nov2023 Dec2023 Jan2024 Feb2024 Mar2024 Apr2024 May2024 0 10 20 30 40 LISTINGS FOR SALE SOLD LISTINGS
Median SalesPrice
Single-Family Homes
The median sale price has increased from $2 3m last May 2023, to $2 6m as of May 2024
Condos & Townhomes
The median sale price has increased from $1 1m last May 2023, to $1 2m as of May 2024
AVGDays OntheMarket
Single-Family Homes
The average time spent on the market went down from 11 days last May 2023, to 7 days as of May 2024
Condos & Townhomes
The average time spent on the market went up from 11 days in May 2023, to 12 days as of May 2024.
Overbids
Single-Family Homes
The overbid percentage has increased from 108% last May 2023, to 114% a year later
Condos & Townhomes
The overbid percentage has increased from 104% last May 2023, to 107% a year later.
Back to Table of Contents May2023 Jun2023 Jul2023Aug2023Sep2023Oct2023Nov2023Dec2023 Jan2024Feb2024Mar2024Apr2024May2024 $0 $500,000 $1,000,000 $1,500,000 $2,000,000 $2,500,000 $3,000,000 May2023 Jun2023 Jul2023Aug2023Sep2023 Oct2023Nov2023Dec2023 Jan2024 Feb2024Mar2024 Apr2024May2024 0 5 10 15 20 25 30 35 May2023 Jun2023 Jul2023Aug2023Sep2023 Oct2023Nov2023Dec2023 Jan2024 Feb2024Mar2024Apr2024May2024 000% 2000% 4000% 6000% 8000% 10000% 12000%

Santa City
What's in the data?
There were 28 single providing 0.7 month new listings, and 46 of $2.1m. The media 113%, with an avera
There were 49 cond sale, providing 1.8 m were 49 new listings sale price of $1.2m. percentage was at 1 days on the market.

50 New Listings
46 Sold Listings
0.7 Months of Inventory
$2.1M Median Sale Price
113% Median Sale vs List
10 Avg Days on Market
Graphix, includes all single-family homes, above from May 2023 to May 2024. This the time the data was gathered. All data 511642. Copyright KW Advisors Palo Alto 2024. Each office is independently owned and operated.
es
49
New Listings
33
Sold Listings
1.8
Months of Inventory
$1.2M
Median Sale Price 108%
Median Sale vs List 13 Avg Days on Market

C
aCity , y y ec2023 Jan2024 Feb2024 Mar2024 Apr2024 May2024 Dec2023 Jan2024 Feb2024 Mar2024 Apr2024 May2024 OLD LISTINGS
Median SalesPrice
Single-Family Homes
The median sale price has increased from $1 7m last May 2023, to $2 1m as of May 2024
Condos & Townhomes
The median sale price has increased from $1m last May 2023, to $1 2m as of May 2024
AVGDays OntheMarket
Single-Family Homes
The average time spent on the market went down from 17 days last May 2023, to 10 days as of May 2024
Condos & Townhomes
The average time spent on the market went up from 9 days in May 2023, to 13 days as of May 2024.
Overbids
Single-Family Homes
The overbid percentage has increased from 107% last May 2023, to 113% a year later
Condos & Townhomes
The overbid percentage has increased from 106% last May 2023, to 108% a year later.
Back to Table of Contents May2023 Jun2023 Jul2023Aug2023Sep2023Oct2023Nov2023Dec2023 Jan2024Feb2024Mar2024Apr2024May2024 $0 $500,000 $1,000,000 $1,500,000 $2,000,000 $2,500,000 May2023 Jun2023 Jul2023Aug2023Sep2023 Oct2023Nov2023Dec2023 Jan2024 Feb2024Mar2024 Apr2024May2024 0 5 10 15 20 25 30 35 May2023 Jun2023 Jul2023Aug2023Sep2023 Oct2023Nov2023Dec2023 Jan2024 Feb2024Mar2024Apr2024May2024 000% 2000% 4000% 6000% 8000% 10000% 12000%

Saratoga
What's in the Saratoga data?
There were 32 single-family homes for sale, providing 1 month of inventory. There were 3 new listings, and 32 homes sold at a median of $4m. The median overbid percentage was 107%, with an average of 10 days on the ma
There were 0 condo and townhome units for providing 0 months of inventory. There were new listings and 2 units sold at a median sal price of $1.3m. The median overbid percenta was at 104%, with an average of 15 days on market.

He-Family Homes
36 New Listings
32 Sold Listings
1 Month of Inventory
$4M
Median Sale Price
107%
Median Sale vs List
10 Avg Days on Market
sourced from InfoSparks and Trend Graphix, includes all single-family homes, townhomes in the California Area above from May 2023 to May 2024. This preliminary data, and may vary from the time the data was gathered. All data reliable but not guaranteed. DRE# 01511642. Copyright KW Advisors Palo Alto 2024. Each office is independently owned and operated.
4 New Listings

2 Sold Listings
0
Months of Inventory
$1.3M
Median Sale Price 104%
Median Sale vs List 15 Avg Days on Market
MAY 2023 - MAY 2024
amily Homes months, year-over-year. & Townhomes months, year-over-year
ratoga
023 Jul2023 Aug2023 Sep2023 Oct2023 Nov2023 Dec2023 Jan2024 Feb2024 Mar2024 Apr2024 May2024 023 Jul2023 Aug2023 Sep2023 Oct2023 Nov2023 Dec2023 Jan2024 Feb2024 Mar2024 Apr2024 May2024 NGS FOR SALE SOLD LISTINGS
Median SalesPrice
Single-Family Homes
The median sale price has increased from $3 8m last May 2023, to $4m as of May 2024
Condos & Townhomes
The median sale price has decreased from $2 1m last May 2023, to $1 3m as of May 2024
AVGDays OntheMarket
Single-Family Homes
The average time spent on the market went down from 16 days last May 2023, to 10 days as of May 2024
Condos & Townhomes
The average time spent on the market went up from 8 days in May 2023, to 15 days as of May 2024.
Overbids
Single-Family Homes
The overbid percentage has increased from 99% last May 2023, to 107% a year later
Condos & Townhomes
The overbid percentage has increased from 93% last May 2023, to 104% a year later.
Back to Table of Contents May2023 Jun2023 Jul2023Aug2023Sep2023Oct2023Nov2023Dec2023 Jan2024Feb2024Mar2024Apr2024May2024 $0 $1,000,000 $2,000,000 $3,000,000 $4,000,000 $5,000,000 May2023 Jun2023 Jul2023Aug2023Sep2023 Oct2023Nov2023Dec2023 Jan2024 Feb2024Mar2024 Apr2024May2024 0 20 40 60 80 May2023 Jun2023 Jul2023Aug2023Sep2023 Oct2023Nov2023Dec2023 Jan2024 Feb2024Mar2024Apr2024May2024 000% 2000% 4000% 6000% 8000% 10000% 12000%


505 Hamilton Ave Suite #100, Palo Alto, CA 94301 PaloAlto ErnestoFayard Realtor® DRE #02118896 (510) 334-7333 EFayard@kw.com EFayard.kw.com
